Just in time for what appears to be a potentially massive market price rotation, our researchers have put together this post to highlight what we believe will become a surprise price correction in the US Equities markets.  Our team of researchers believes the correlation of our predictive modeling tools, predictive cycle tools, and other indicators are set up for what may become a massive 5~8% price rotation over the next 60 days.

We were expecting this rotation to start unfolding around mid-September (now) but at this time the technical are still bullish so we are not betting against the market just yet.

The combination of new US tariffs ($200 Billion about to hit in the China trade war), as well as a combination of technical issues with regards to Technology Stocks and retail expectations, could jolt the market if a correction does take place as our predictive modeling tools suggest.  A simple rotation of 2~3% is fairly common in the markets.  These predictive modeling solutions are suggesting we are just 4~5 days away from the start of a much bigger correction in the US Equities and Indexes.

We believe the coming US elections in combination with the other aspects of the global economy are going to drive a downward price correction that many people are not expecting right now. But there is one pocket of stocks that could benefit from this tariff stuff which members or our Wealth Building Newsletter just got long today!

Anyway, Let’s take a look at some of our index charts to see how this will likely play out.

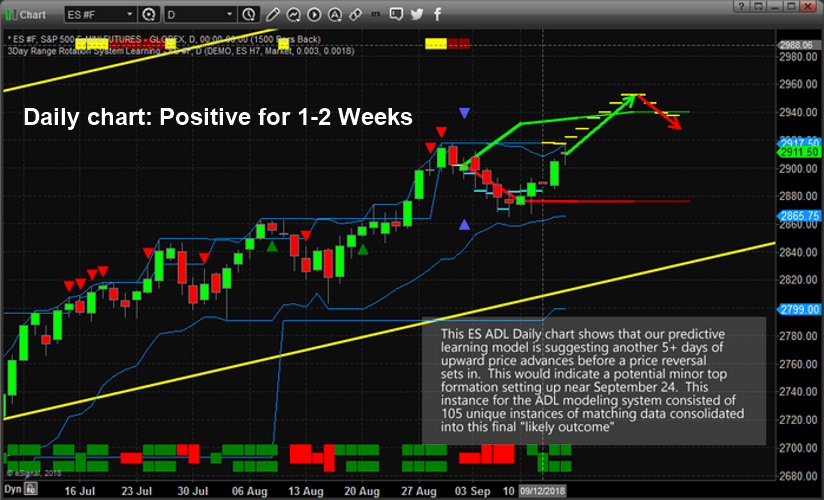
This first chart is a Daily ES chart showing our Adaptive Dynamic Learning (ADL) predictive price modeling tool.  The YELLOW/CYAN dashed lines over the price bars and into the future show the highest probable outcome from the ADL predictive modeling analysis.  This instance that predicts a 5~6 day price advance before a price peak sets up consisted of 105 unique instances of correlative price data making up this predictive analysis.  In other words, 105 unique instances of similar predictive price patterns and predicts future price moves based on the highest likely outcome of all instances of data.

In this case, the ADL modeling system is suggesting we have about 4~6 more days of moderately higher price activity before a price top/peak will setup – prompting a new downward price trend.

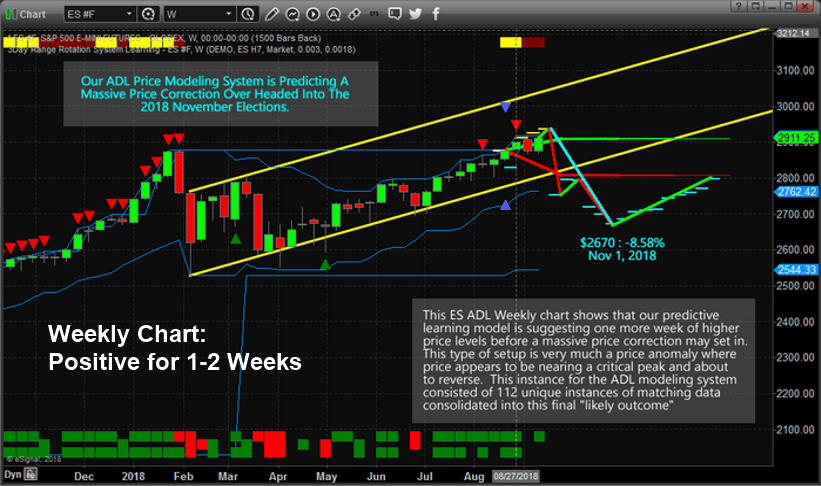
This ES Weekly ADL price chart correlates with the Daily chart almost perfectly.  The Weekly chart predicts one additional week of upward price action before a massive 5~6% price decline drives prices lower.  This massive price rotation executes over a 1 to 2-week span before briefly stalling, then an additional price decline of about 2% sets up driving prices to a predicted low near $2670 (-8.58%) on November 1, 2018 (just before the US elections).

This ADL analysis was generated by 112 unique instances of similar price data and the combined highest probability outcome is shown by the YELLOW and CYAN dashed lines on the chart.  Simply put, we have a very high probability of a 5~8% price correction setting up over the next 20+ days in the US Equities markets with a projected bottom setting up near $2670.

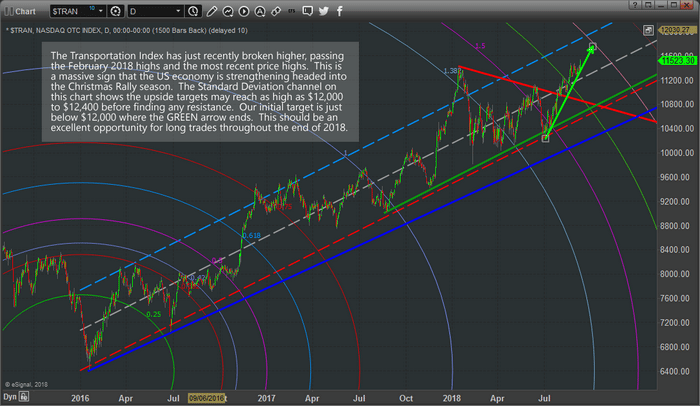
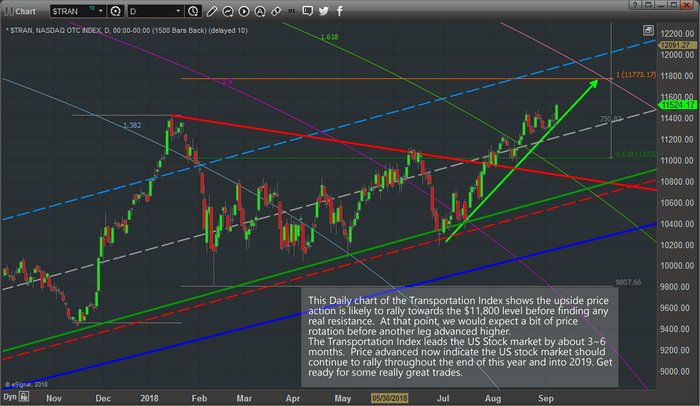
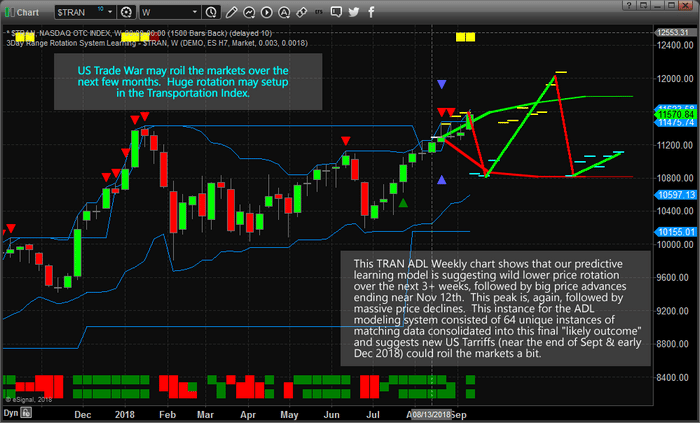
This last Weekly Transportation Index chart displaying the ADL predictive modeling system paints a very interesting picture when you combine it with the two earlier charts.  The Transportation index typically leads the major markets by about 3 to 6 months.  We have seen continued upside price advances in the Transportation Index over the past 6 months which leads us to think the US equities markets will continue to push higher overall.  Yet, this Weekly ADL predictive modeling chart shows two massive price rotations are likely to unfold before the end of 2018.  The first one is set up for a downside price rotation, ending near $10,800, starting the week of September 17, 2018, and lasting about 3~4 weeks.  Then, the ADL predicts the Transportation Index will rocket higher, near $11,800, for about 5~6 weeks before falling again to retest the $10,800 lows near early December 2018.

We believe critical global news and expectations regarding global trade, banking and credit may become the catalysts for these moves.  The US is expected to enact over $200 billion in trade tariffs this week with China.  We believe the ADL predictive modeling system is capable of identifying these massive price rotations and predicting the future rotations simply because of the massive amounts of data that it is capable of crunching.  This Weekly ADL prediction consisted of 112 unique price instances and displays only the highest probable outcome.  In other words, our predictive modeling system is suggesting these price moves are likely to happen based on its analysis with a greater than 50% probability.

Please pay close attention to our research posts and other articles throughout the end of this year and early into 2019.  As we have been attempting to warn our followers, expect increased volatility and wider price rotation throughout the end of this year.

We expect to find a number of incredible opportunities for our members over the next few months and we have already been incredibly successful throughout this recent price rally.  Our ADL systems predicted this upside price move in February of 2018 and we have stuck with it.  Now, the ADL is predicting a massive rotation is about to take place – somewhat similar to February 2018.  If you want to learn how to profit from these moves, visit www.TheTechnicalTraders.com to learn how we help our members stay ahead of these types of market moves.

Chris Vermeulen
Technical Traders Ltd.

If you are a Bitcoin fan or looking for the next opportunity for a Bitcoin rally, you may not have long to wait before a price breakout takes place.  Our research team, at www.TheTechnicalTraders.com, believes a price breakout may occur before the end of 2018 – the only question is will it be a breakout rally or a breakdown crash before the next mega rally?

Cryptos and, in particular, Bitcoin has increased in popularity and adoption over the past 24 months across the globe.  Recently, Citigroup has announced new technology making Crypto transactions more secure and reducing the risk of such transactions.  Additionally, Circle recently announced a US Dollar based Crypto-currency that is backed by Goldman-Sachs.  News from Europe is that the EU has been urged to adopt common Crypto-Currency rules that will fuel more attention and enterprise on developing suitable Crypto solutions for the European markets.

All of this plays into our research that a breakout/breakdown is inevitable and it is just a matter of time before this coiling price consolidation “apexes” and expands.

This chart shows massive breakdown washout below $6000 taking it back to prices before crypto became popular in early 2017.


This next chart below shows our cycle analysis and how much bitcoin moved from our cycle bottoms to tops. We are now at NEARING a critical juncture of a $6000 breakdown which is clearly a support level, and a potential major cycle bottom or continuation down cycle. Huge money can be made from this extreme volatility that is about to unfold and savvy technical traders can see the profit potential unfolding.


We urge all traders to keep Cryptos in focus over the next few weeks and months.  Our research team shares our proprietary analysis and research with our paid members regarding the Crypto-currency trends and trades.

If you want to learn what we believe will be the next big move in the Crypto markets, then visit www.TheTechnicalTraders.com to learn more.  Our proprietary modeling systems are clearly showing us what we should expect over the next few weeks and months.  As a member, you will have access to this research and benefit from our Daily Research Videos.

Chris Vermeulen

The recent upside breakout seen in the US Transportation Index is a very important signal for traders.  Our research team has been following these moves for many months and we believe the recent upside breakout in the $TRAN is a strong sign of future US Equities price moves and all traders should be paying very close attention.

The Transportation Index typically leads the US Equities markets by about 3 to 6 months.  Transportation is one of the core elements of economic activity.  Items entering the US or distributed throughout the US must rely on transportation to ship/deliver these goods to resellers, wholesalers, and ports.  When the Transportation Index rises, one should expect the economic activity to continue to increase.

Given that we are only three months from the Christmas holiday season and understanding that retailers, wholesalers, and warehouses have likely already been stocking up on the holiday items, it makes sense that the Transportation Index would have been climbing over the past few months.  Remember, the Transportation Index leads equities by about 3 to 6 months.  So, we would have expected the Transportation Index to rally about 6 months before December if the economy was strengthening.

The breakout rally currently exhibited in the Transportation Index paints a picture that many may not be aware of for early 2019.  Should the Transportation Index rally continue into October or November, or possibly longer, this would indicate that the US Equities market could continue to rally well into March or April of 2019 – possibly much longer.  This means traders looking for a massive top any time soon, or big short sellers could have some big soling positions as this rally continues for the next 6+ months. While many are bearish on stocks and short the market, we remain long IYT with our position with members.

Let’s take a look at another chart.  This Daily Transportation Index chart is very long term as we wanted to clearly illustrate the Standard Deviation channel that is in place going all the way back to 2016.  The DASHED lines on the chart represent the Standard Deviation channel range that is likely to continue to operate as a price boundary going forward.  The ARCs that appear on the chart are a unique tool we use to measure Fibonacci price acceleration and ranges.  The upside price breakout points to an upside target of near $11,800 to $12,00 very quickly.  From this level, we expect a bit of price rotation before another upside leg begins.

This next chart is the same Daily Transportation Index chart, just a closer view of the most recent 10+ months of price data.  We can still see the Standard Deviation channel ranges and the upside breakout highlighted by our GREEN arrow.  We’ve also added a Fibonacci price extension tool based on recent price rotation that points to an $11,773 upside target.  We see confluence in multiple analysis techniques when multiple studies point to the same outcome.  In this case, the Fibonacci Arcs, Fibonacci extensions and Standard Deviation channel all support the continued rally to near $11,800 for the Transportation Index.

As traders, this should be a very interesting and rewarding “look into the future” for many of you.  These charts are suggesting the US Equities markets may continue to push much higher well into early 2019.  As long as this upside trend in the Transportation Index continues, we should continue to expect a strengthening US economy, stronger economic and GDP levels and stronger consumer activities.  In other words, get ready for some great long trades over the next few months and get ready to pick apart these opportunities as they play out.

Our team or researchers and professionals have been long the Transportation index for many weeks now.  We identified this move months ago and alerted our followers to get into this trade early.  If you want to know what our team of professional traders are telling our members now and how to find great opportunities throughout this move, visit www.TheTechnicalTraders.com to learn more.

Chris Vermeulen