Chris Vermeulen, Founder of The Technical Traders shares his outlook for the oil, natural gas, and the US dollar. Natural gas is looking like a nice trader at it’s current level and oil while it is pulling back today is still at holding the recent breakout range. As for the USD long-term bearish is where we both stand.
Click download link to listen on this device: Download Show
https://thegoldandoilguy.com/wp-content/uploads/2018/02/featuring-cory.png109173adminhttp://www.thegoldandoilguy.com/wp-content/uploads/2014/11/tgaoglogo.pngadmin2018-02-28 19:22:362018-02-28 19:23:58Short and Long-Term Outlooks for Oil, Nat Gas, and Dollar
Our articles, Technical Trading Mastery book, and 3 Hour Trading Video Course are designed for both traders and investors to explore the tools and techniques that discretionary and algorithmic traders need to profit in today’s competitive markets. Created with the serious trader and investor in mind – whether beginner or professional – our approach will put you on the path to win. Understanding market structure, trend identification, cycle analysis, volatility, volume, when and when to trade, position management, and how to put it all together so that you have a winning edge.
https://thegoldandoilguy.com/wp-content/uploads/2016/02/Radio.jpg473560adminhttp://www.thegoldandoilguy.com/wp-content/uploads/2014/11/tgaoglogo.pngadmin2018-02-27 21:00:222018-02-27 21:00:22“Average Joe ” Panic Selling on New York Exchange
Over the past few months, our research team has nailed many of the recent moves in the Metals market thanks to our advanced price modeling systems and detailed research. Recently, we’ve been watching a setup play out in Gold that has excited us. The potential for a massive upside rally that should originate as early as March 19 (only a few weeks away). The reason this is so exciting is that a breakout move in the gold market would indicate a global rush into a protective market because of fears originating from other market sectors.
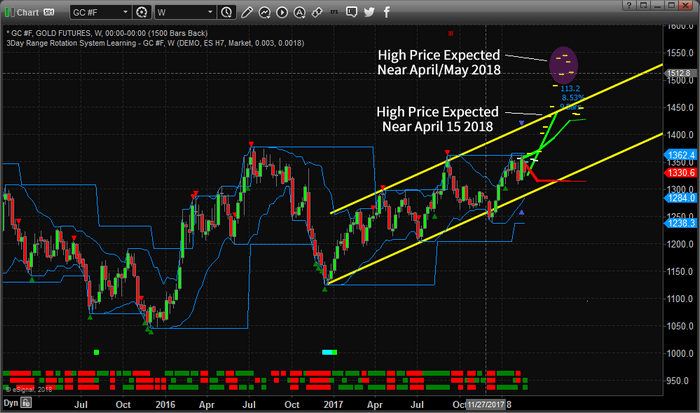
This first chart is a Weekly Gold chart highlighting our Adaptive Dynamic Learning (ADL) price modeling system. This price modeling system is capable of identifying and mapping historical price and technical patterns as well as ranking and evaluating future price moves – showing only the highest probable outcomes. This analysis is designed to teach us exactly what price should be doing based on a current price pattern. Please notice the two highlighted areas, a high price level near April 15 (near $1450) and a high price level near the end of April or early May (near $1550). Both of these moves represent massive upside legs in Gold. The first being nearly 8.5% and the second being nearly 18% advancements.
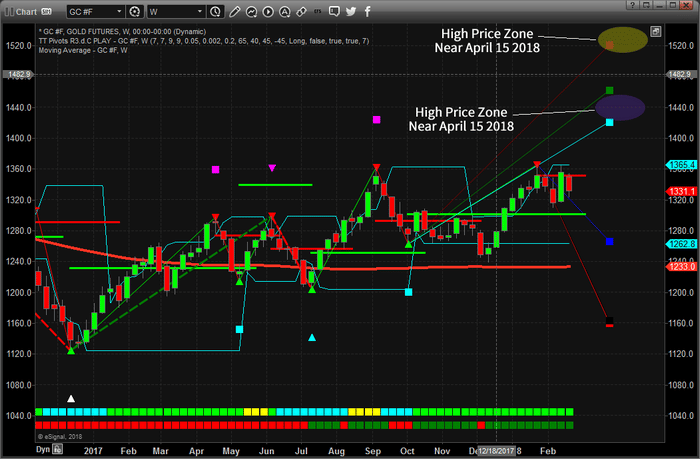
This second chart illustrates our Adaptive Fibonacci price modeling system on a Gold Weekly chart. This price modeling system tracks price rotation and uses a unique form of AI to apply Fibonacci price rotation price models showing us where price rotation is happening and what to expect in future moves. Please note the similarities in the projected future price levels in addition to the moderately tight price flag that is setting up on the right side of this chart. With higher lows and multiple top formations near $1365, this new analysis plays perfectly with our most recent analysis.
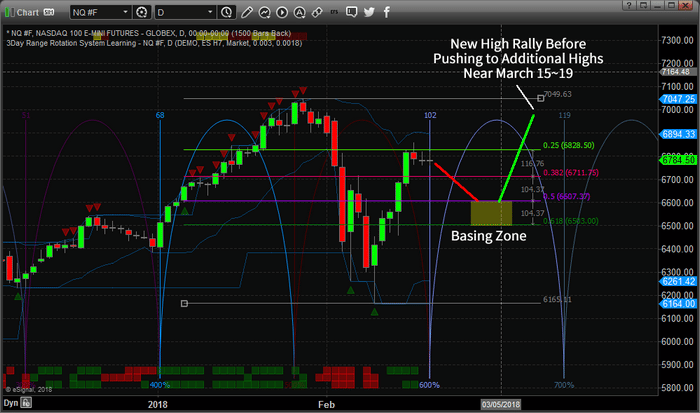
Over the past few weeks, we alerted our members to a breakdown in price which we traded DUST inverse gold miners ETF, followed by a recent price basing/bottoming zone and breakout. We have been warning our members that the US major markets would experience weakness over from February 20 till about March 2 where a new price rally/breakout would begin. We’ve recently called a basing level in the NQ near $6500 that should happen within the next few days where support should be found before a price rally/breakout happens to create a peak near March 15. Everything we have been warning our clients about has played out almost perfectly.
Now, our price modeling systems are warning of a metals market breakout/rally originating near March 26th. Why is this so important to us and why do we believe this could be an ominous signal? The answer is simple, for the metals markets to experience this type of breakout move, some global concern must be driving a fear component and driving global investment into the metals market in a protectionist move. So, we are expecting some market event to play out near the middle of March 2018 that generates a bit of fear, resulting is a massive increase in the price of Gold and Silver. This move appears to peak near May 21~28, 2018 before weakening a bit.
We can’t stress enough that you should not worry about the overall market implications of a crisis event at this time. Our analysis of the US majors shows that the remainder of this year should continue to be relatively positive in price activity with overall higher than average price volatility after the recent surge in volatility. In other words, this crisis event appears to be an external event – not a US event.
If you want to know how you can profit from these types of move and how our research team can assist you, visit www.TheTechnicalTraders.com to learn more.
https://thegoldandoilguy.com/wp-content/uploads/2018/02/Chart_18-02-22_GOLD_Breakout.png413700adminhttp://www.thegoldandoilguy.com/wp-content/uploads/2014/11/tgaoglogo.pngadmin2018-02-25 08:32:022018-02-25 08:32:02Gold Setting Up For A Massive Upside Rally
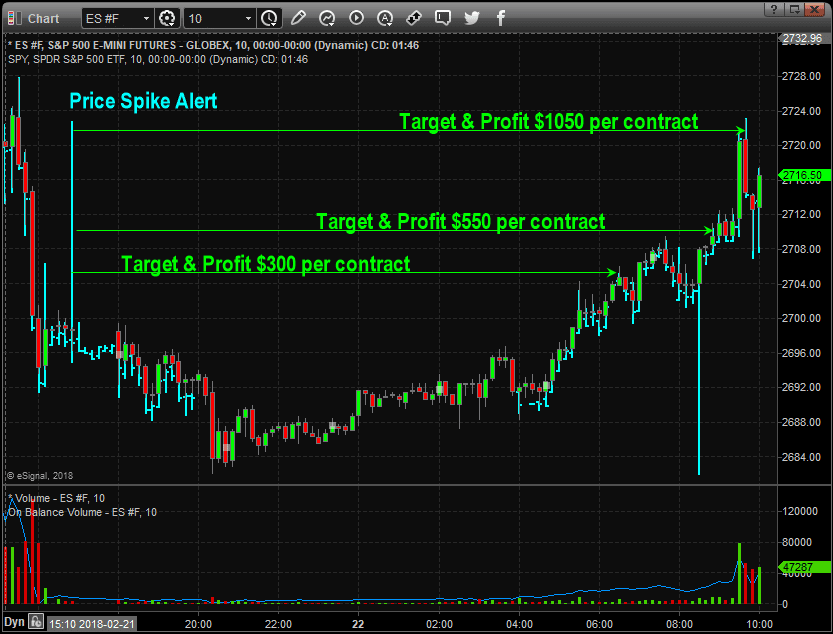
Last night the stock market flashed us a quick price spike on the SP500 index and we sent this out to our members as soon as we saw it. Price spikes are the markets way to tipping its hand for us to see where the big player’s should move in the next 1-3 trading sessions. Most spikes trade targets are hit within 12 hours. Last night spike provided trades with a $300. $550, or $1050 profit per ES mini contract they traded. But with that said, spikes can be traded with SP500 index ETF’s as well as long as your broker allows you to trade Pre/Post market hours, which most brokers do allow.
Below is a chart showing the spike and move to the upside:
These spikes are something will be providing on a regular base as they show up on the charts in our pre-market video analysis or a quick email and chart image during post market hours. These spikes take place ONLY in pre/post market hours which is why the average Joe does not know about this hidden gem.
To learn more click on the post below to see more charts and our explainer video on trading price spikes.
53 years experience in researching and trading makes analyzing the complex and ever-changing financial markets a natural process. We have a simple and highly effective way to provide our customers with the most convenient, accurate, and timely market forecasts available today. Our stock and ETF trading alerts are readily available through our exclusive membership service via email and SMS text. Our newsletter, Technical Trading Mastery book, and 3 Hour Trading Video Courseare designed for both traders and investors. Also, some of our strategies have been fully automated for the ultimate trading experience.
https://thegoldandoilguy.com/wp-content/uploads/2018/02/spike-alert.jpg437407adminhttp://www.thegoldandoilguy.com/wp-content/uploads/2014/11/tgaoglogo.pngadmin2018-02-22 10:44:032018-02-22 10:44:03How to Trade Index Price Spikes & Alert
Our proprietary price modeling systems are showing us that our expected price basing, which we have been warning our members of for near 3 months, has altered in range and scope. What we did expect to happen near February 21 is now expected to START sometime between February 21 and February 26. In other words, we are warning our clients that a moderate downside move is expected in the US majors through most of this current week ending near the end of February before a strong rally in prices is likely to begin.
At www.TheTechnicalTraders.com, we are constantly using our proprietary price modeling systems and price cycling systems to determine when and where the next trading opportunity will happen. We’ve posted a number of research reports to the public to assist all traders and investors throughout this year. We called the early rally in the US majors weeks before it started. We called the correction months before it happened. We called the bottom in this volatile rotation and told all our members that we believed prices would accelerate higher after a tight pennant formation completed. Now, we are warning our members to prepare for a mild to moderate downward price rotation to an extended 3~5 day basing pattern near Feb 25 through Feb 27. This basing pattern should be a perfect opportunity for intermediate-term swing traders to initiate and setup trades headed into the March 15 price peak we have been telling you about.
This NQ chart clearly shows the markets have sufficiently retraced (in this case nearly 75%) and have stalled. This move aligned perfectly with our cycle definitions and our projected higher price activity. Now, our proprietary Adaptive Dynamic Learning (ADL) modeling system is telling us the BASING ZONE is likely to happen near the end of February – not near the February 21 date we saw earlier in the year. So, we are altering our scope of analysis to address this change by telling readers to expect a downward price move over the next 5~7 days into the BASING ZONE before the next leg of a rally begins.
This ES chart presents a similar picture and shows our ADL system at work. You can see from the DASH markers on the chart where the ADL system is predicting prices to be into the future. We have determined that the $6500~6600 level of the NQ and the $2600~2650 level of the ES are key BASING target levels. From these levels, we expect the US majors to attempt a rally to recent highs first, pausing briefly, before breaking higher to attempt a fresh run at new highs.
This move should excite traders and investors. It means this recent volatility rotation provided a healthy “washout” of low volatility positions and the real price action can now begin in earnest. This is a classic setup for most technicians. A washout rotation setting up a potential double top pattern (acting like resistance) before a breakout move drives higher prices. All the while, setting up the short (with the double top formation) in a manner that will bait them into positions before the squeeze happens.
This move could be explosive and we are ready to help you understand the opportunities that exist in the markets now and for as long as you want our help. Just visit www.TheTechnicalTraders.com to learn how we can assist you. This type of research and our proprietary trading models will help you find successful trades and new opportunities. Our last trade generated a 42.5% return for our members in only 9 trading days.
Do you want to know what to expect over the next few weeks and months in the markets? We’re here to assist you. Pay attention to this move. Don’t get wrapped up in what might appear to be the beginning of a bigger downside move. There is a lot of fear still in the markets but our modeling systems are telling us the end result will be a breakout rally. Play it smart.
https://thegoldandoilguy.com/wp-content/uploads/2018/02/Chart_18-02-19_ES_Rotation.png413700adminhttp://www.thegoldandoilguy.com/wp-content/uploads/2014/11/tgaoglogo.pngadmin2018-02-19 23:06:182018-02-19 23:06:18Breakout Rally will Squeeze Shorts In March
As a technical trader, I like it when multiple charts, indicators, and asset classes agree with each other for trade setups. This short article is to show you some of the things I look at which provide a buy signal for gold stocks.
One of the key trading tips I learned years ago, is that average a sharp price reversal and surge in price, we as traders can buy into the first pullback with a high probability of a continuation in price.
Why is this key trading tip so important? Because picking bottoms and tops are risky business, and in most cases, we miss them. Thus, we need to know when the next best time to enter this asset is – buy the dip/first pullback!
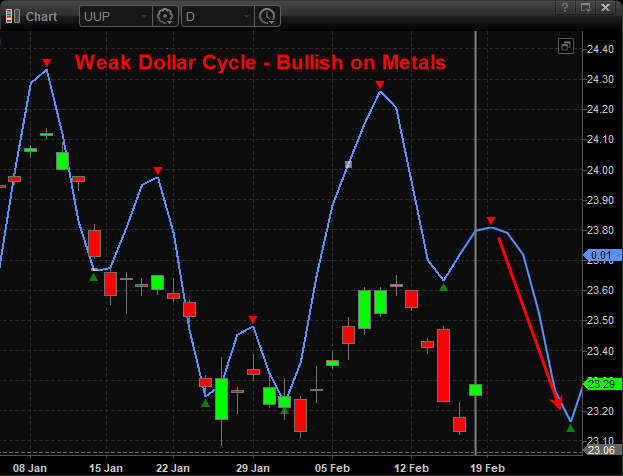
TRADING TECHNICAL ANALYSIS – US DOLLAR INDEX CYCLE BIAS
The blue lines on the chart is a blend of the most active price cycles for the dollar. As you can see the price is expected to move higher over the next 1-3 days, then be under pressure again. When the dollar falls in value, it helps lift the price of gold and gold-related assets like gold stocks.
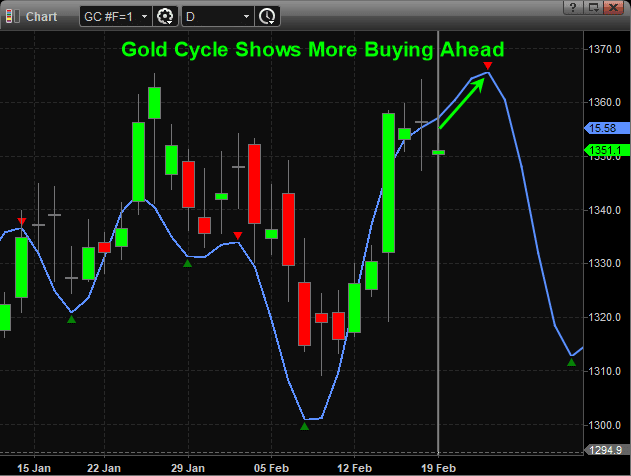
GOLD CYCLE ANALYSIS
Cycle analysis points to higher prices for a few days, but the upside for gold looks fairly limited as its struggling at recent highs (resistance). But as long as gold holds value or grinds higher it should help lift gold stocks higher.
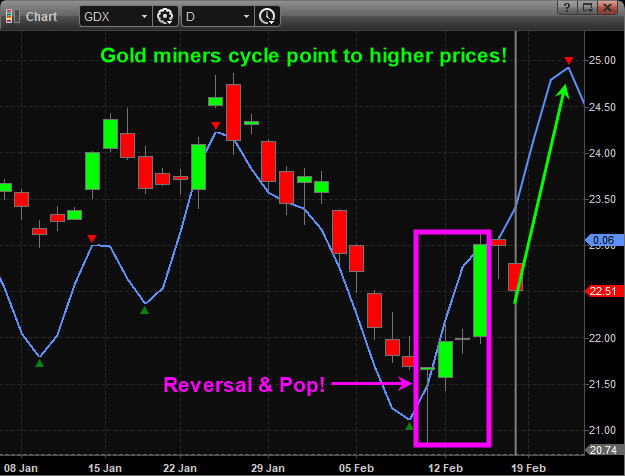
GOLD MINERS REVERSAL, POP, AND CYCLE ANALYSIS
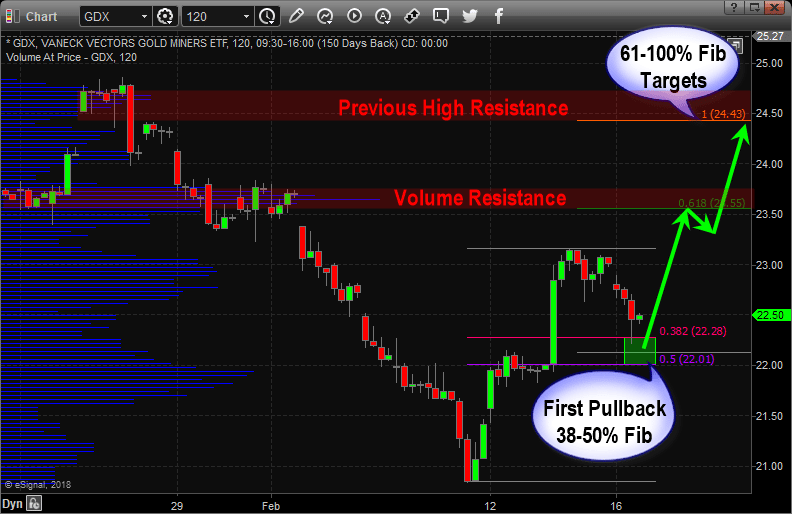
This daily chart of GDX gold miners shows a big reversal and pop in price. This sets the stage for a second leg higher once the first pullback in price reaches a buy trigger zone.
If you don’t know or understand Fibonacci retracements of 38-50%, or Fibonacci extensions of 61% and 100%, then the lines on the chart below will not make much sense to you. So, let sum things up quickly.
When price retraces (pulls back) 38% – 50% of a recent rally that is where price usually finds support. This is seen on the chart via the green box buy zone.
Once price reaches that buy zone we can then use Fibonacci extensions of 61% and 100% which uses the previous low down at $21 and rally up to $23 as the upside potential from the green box. Price should find minor resistance at the 61% level, and if a pause or pullback takes place at 61%, then 100% target should be reached as well.
On the chart, I have also added the two red resistance levels which happen to fall near our 61% and 100% targets. While this may seem like a coincidence, believe it or not, the more you study and learn to trade technical analysis you will notice the markets are not that random at all!
CONCLUSION
In short, the momentum behind gold mining stocks along with the technical analysis points to higher prices in the week ahead. Nothing in the financial markets are 100% certain, so this may not play out as we expect, but this is how I have been trading technical analysis for 21 years. If you have proper position sizing, risk management, and timely setups like what you see here, you can make a lot of money over time.
If you want to watch my live technical analysis videos each morning before the opening bell, so you know what to expect in the coming session and week ahead join my Technical Traders Wealth Building Newsletter right now!
My articles, Technical Trading Mastery book, and 3 Hour Trading Video Course are designed for both traders and investors to explore the tools and techniques that discretionary and algorithmic traders need to profit in today’s competitive markets. Created with the serious trader and investor in mind – whether beginner or professional – our approach will put you on the path to win. Understanding market structure, trend identification, cycle analysis, volatility, volume, when and when to trade, position management, and how to put it all together so that you have a winning edge.
Chris Vermeulen
Founder of Technical Traders Ltd.
https://thegoldandoilguy.com/wp-content/uploads/2018/02/gdx-120.png514792adminhttp://www.thegoldandoilguy.com/wp-content/uploads/2014/11/tgaoglogo.pngadmin2018-02-18 20:24:492018-02-18 20:24:50How To Trade Gold Stocks with Momentum
Our articles, Technical Trading Mastery book, and 3 Hour Trading Video Course are designed for both traders and investors to explore the tools and techniques that discretionary and algorithmic traders need to profit in today’s competitive markets. Created with the serious trader and investor in mind – whether beginner or professional – our approach will put you on the path to win. Understanding market structure, trend identification, cycle analysis, volatility, volume, when and when to trade, position management, and how to put it all together so that you have a winning edge.
Our focus is to provide you with updated and accurate market price predictions for all of 2018, we believe we are entering a period that will be fantastic for traders and active investors. We believe this recent volatility has shaken out the low volatility expectations and will allow the markets to start moving in a more normal rotational mode going forward. This means we’ll have lots of trading opportunities to profit from.
For those of you who have not been following our research over the past 2 to 3 months, we urge you to visit our Technical Traders Ltd.website to read our published research and to learn how we’ve been calling these moves in the markets for our members. We called the early 2018 market rally weeks before it started. We called the lower price rotation over a month before it happened. We called the bottom in this price correction almost to the day and told our members that we believed a very quick Pennant price formation was set up that will drive prices higher which we have seen this week.
Members know price should move higher leading to a March 15 price cycle peak. After that point, we’ll refresh our analysis for our members and attempt to provide further guidance. Today/Friday we closed our Short position in UVXY for a quick 50% in 9 days.
In this post, we are going to focus on one of our price modeling systems based on Adaptive Fibonacci Price Modeling and show you why we believe this recent price move will likely stabilize within a range while attempting future moves. Let’s start with the INDU.
WEEKLY DOW JONES CHART
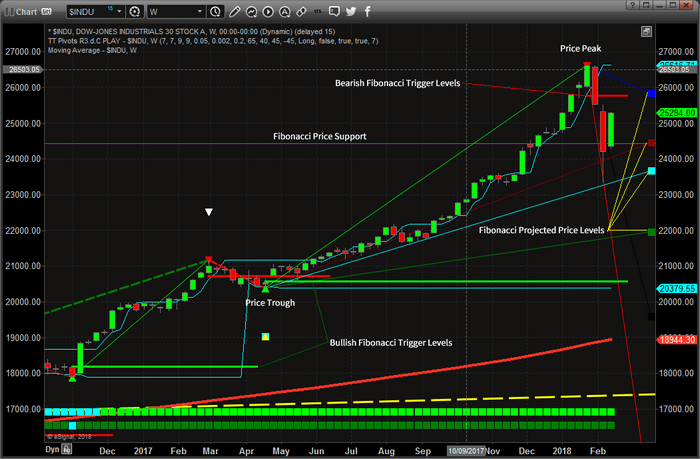
This first chart is the INDU Weekly chart with our Fibonacci Modeling system at work. We’ve highlighted certain areas with notes to help you understand it in more detail. This adaptive modeling system tracks price high and low points in various cycle lengths, then attempts to adapt a major and moderate cycle analysis model to key Fibonacci predictive points. The end result is that we can see where key Fibonacci price trigger levels are and also see what our predictive modeling system is telling us where prices is likely headed.
This weekly, chart shows us that the current support level (originating from near April 2017) is nearly exactly where the current price correction found support. This level is currently acting as a strong base for current price action and will likely continue to provide very strong support going forward. You can also see the Bearish Fibonacci Price Level near 25,776 that is acting like Resistance. Notice that this Bearish Fibonacci Price Level also coincides with the BLUE Fibonacci projected price level.
It is still our opinion that the US major markets will continue moderate price rotation within these levels for the next 5+ days before reaching an intermediate price low cycle near February 21. After this price low cycle is reached, we believe a new price advance will begin to drive the US majors higher reaching a peak near March 15.
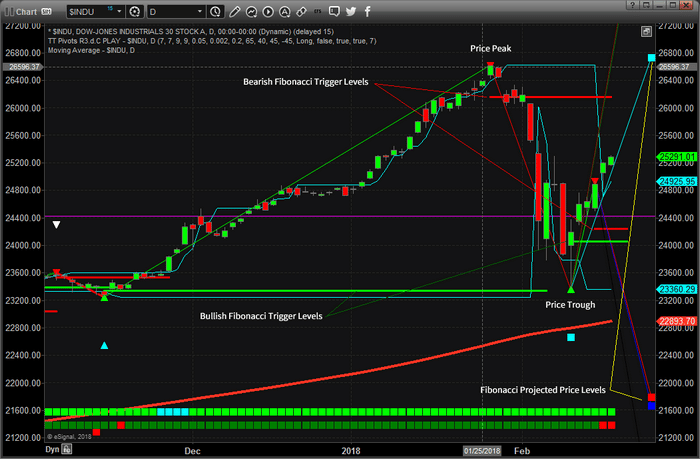
DAILY DOW JONES CHART
This next INDU Daily chart provides more detail of our projected analysis. Again, please read the notes we’ve made on this chart to assist you in understanding how we are reading it and interpreting it. The most recent price peak and trough clearly show the volatility spike that happened last week. It also shows us that the recent trough in price aligned almost perfectly with a Bullish Fibonacci Price Level from November 2017. We interpret this as a clear “double bottom” formation at Fibonacci Support.
The purple horizontal line is the Support Level originating from the earlier, Weekly, chart for reference.
This Daily chart shows more detail in terms of the Fibonacci Projected Price Levels and also shows the wide range of price that we are currently experiencing. Over time, this wide range will likely diminish a bit as the trend continues to consolidate price rotation into more narrow bands, but right now we have a very wide range of price volatility that we have to deal with. Additionally, the current upward price rotation is above the Bullish Fibonacci Price Level from the recent lows. This is a clear indication that prices want to continue to push higher till some new price peak is in place. We expect that will happen fairly soon.
Notice how the Fibonacci Projected Price Levels are quite a way away from the current price levels? This is because the recent increase in volatility is alerting the price modeling system that we expect larger range price rotation. As newer and more moderate price rotations form, these levels will begin to consolidate a bit with new price levels.
As of right now, our analysis has really not changed much since last week. We believe the Feb 21 price low will prompt a rally into the March 15 price peak. At that time, we’ll take a fresh look at these modeling systems to see what they can tell us about the future.
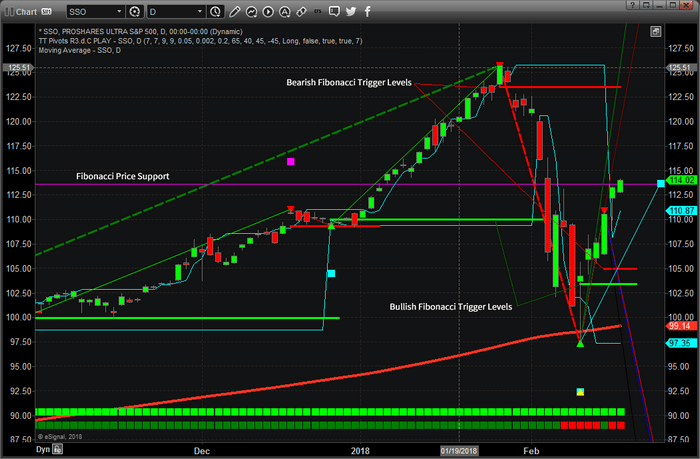
DAILY SP500 (SSO ETF) CHART
The last chart I wanted to share with you is the Daily SSO chart. This chart helps to firm up our analysis of what to expect in the immediate future as well as continues to support our analysis that the US Majors will likely stall near current levels and retrace slightly headed into the Feb 21 price low. Remember, we don’t believe this Feb 21 price low will be anywhere close to the recent lows. This move lower will be much more subdued and moderate in size and scope.
With this SSO chart, the Adaptive Fibonacci Price Modeling system is showing a potential “Major Bottom” near the recent lows. This happens when the system identifies a potentially massive or major price bottom. Over time, the modeling system will confirm this trigger or replace it with a new trigger when it forms.
We still see the massive price volatility in this chart. We still see the Fibonacci Price Trigger Levels that tell us we are below the Bearish Price Trigger (near the recent top) and above the Bullish Price Trigger (near the recent bottom), so what should expect price to do? At this point, the most recent Price Trigger Breach is the Bullish Price Trigger – thus we are expecting prices to continue higher overall. The new Bearish Fibonacci Price Trigger, below the current prices, is what we would watch for any signs of price weakness. When that level is breached, then we begin a new potential down leg.
Right now, we will issue this one simple warning – the upside move is likely to be ending soon and preparing for our February 21 price low point. The fact that prices are showing that they’ve already reached the Fibonacci Projected Price Level is telling us this upside leg may be over for now which is the reason we exited our short UVXY position here for a 50% profit.
Next, we expect the US majors to rotate lower for a few days headed into a February 21 price low. This will be following by an almost immediate and strong upside push to a March 15th price peak.
This means we will be setting up for some great trades over the next few days/weeks. Imagine being able to know that near February 20~22, we should be able to “pick” the best opportunities for quick trades where the US majors begin a new up leg? Also, imagine how critical this type of information can be to you going forward?
Our research team at www.TheTechnicalTraders.com has a combined 53 years of trading and analysis experience. We develop specialized and proprietary price modeling systems, like these, to assist us in being able to provide our members with an “edge” in the markets. Of course, we are not always 100% accurate with our predictions – no one can be 100% accurate. We simply do our best to make sure our members get the best we can offer them each and every day. We want them to understand the opportunities that are playing out and we help them find the best trade triggers for profits each week.
Stay tuned for our next post on Sunday with an instant trade setup,
so be sure to join our free mailing list!
If you find this information valuable and would like to include it in your daily trading activities, visit www.TheTechnicalTraders.com – Wealth Building Newsletter today!
Chris Vermeulen
https://thegoldandoilguy.com/wp-content/uploads/2018/02/Chart_18-02-16_SSO_FIB_D.png459700adminhttp://www.thegoldandoilguy.com/wp-content/uploads/2014/11/tgaoglogo.pngadmin2018-02-16 14:39:082018-02-16 14:39:08How to Trade as We Near March Top – Equities
Our articles, Technical Trading Mastery book, and 3 Hour Trading Video Course are designed for both traders and investors to explore the tools and techniques that discretionary and algorithmic traders need to profit in today’s competitive markets. Created with the serious trader and investor in mind – whether beginner or professional – our approach will put you on the path to win. Understanding market structure, trend identification, cycle analysis, volatility, volume, when and when to trade, position management, and how to put it all together so that you have a winning edge.
https://thegoldandoilguy.com/wp-content/uploads/2018/01/howest-video-interview.png372594adminhttp://www.thegoldandoilguy.com/wp-content/uploads/2014/11/tgaoglogo.pngadmin2018-02-14 10:00:042018-02-14 10:00:51How Long Until Markets Settle Down?