The People’s Bank of China (PBOC) has received approval from the World Bank allowing its’ issuance of bonds which are denominated in Special Drawing Rights (SDRs). The World Bank is the first entity to approve of it and consequently marks the launch of the SDR bond market of the worlds’ second-largest economy.

Jim Yong Kim, The World Bank Group President, said “this is a landmark development for China’s bond market and for the SDR as an international reserve asset. We are very pleased to support China’s growing role in global financial markets. World Bank issuance of SDR bonds in China will support the G-20’s objective of expanding the use of SDRs and help promote the development of China’s domestic capital market. It will also increase Chinese investors’ access to foreign currencies in the domestic bond market, while opening up new opportunities for international investors seeking high-quality investment products in the country.”

This new bond issuance is 2 billion SDRs which is equivalent to $2.8 billion. The bonds will be denominated in SDRs and payable in Chinese renminbi (RMB). The precise timing of issue and individual bond terms will be based on favorable market conditions, at the time of issuance.

The World Bank approval of China, as being the first issuer of SDR-denominated bonds, is a further step in the “internationalization” of the Chinese capital markets. It shows the vital role of the World Bank and how it assists in opening new markets as well as developing local capital markets. The World Bank SDR-denominated bonds in the Chinese market are a fantastic opportunity for Chinese investors to support the World Bank’s sustainable development activities via a new product. These bonds will also be attractive to international investors who are seeking SDR products to hedge SDR liabilities.

The World Bank raises $50-$60 billion, in the international capital markets, each year. The new SDR program in China is part of the World Banks’ strategy to open and support the development of new markets and will therefore expand World Banks’ product offerings which attract new domestic and international investors to World Bank bonds.

Officially, as of October 1st, 2016, the new mix of the SDR will include the Yuan. It now joins the dollar, euro, pound and yen in an exclusive club of currencies that have special drawing rights. The yuan will be weighted at 10.92%. This is the first change in the SDR basket since 1999.   In the past, the IMF rejected the yuan in 2010.


For many in the markets, this has been the year of the yuan. When China suddenly devalued its’ currency, earlier this year, it sent the global markets into a tailspin.  Currently, the yuan is depreciating even further since traders believe that the Chinese government will step down from its’ intervention in the currency. Being included in the exclusive club is a sign that the currency has ‘grown up’, in a manner of speaking.

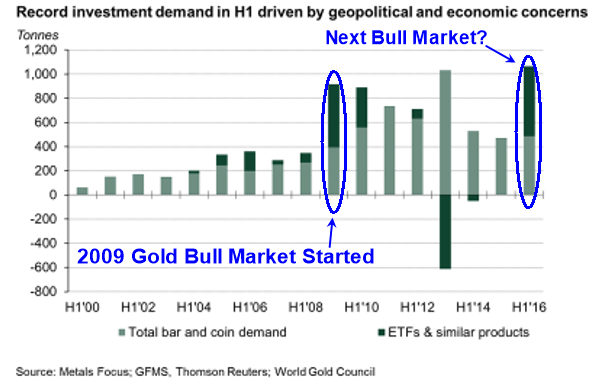
This story began in 2009 with the global financial crisis. The People’s Bank of China said that the economic shocks were due to the financial system being overly reliant on a single currency – the US dollar. It has been pushing for inclusion, ever since.

But what effect will this have on both the Chinese economy and other currencies in the basket? The Euro, for example, will surely be affected by this decision. The currency shared by 19 nations within the Eurozone has had a terrible decade and now it appears that things could get worse.

Check this out: This One Bank Could Take Down Entire Countries Overnight

When it comes to this special basket, the weighting of the currency is the most important aspect. If a new currency is introduced, then all of the others have to give up their share. Therefore, the yuan will be weighted at 10.97%, which means that the share of the euro will drop from 37.4% to 30.93%.

As for China, this announcement is nothing but good news. This move by the IMF is more than just ‘symbolic’. Being counted as a reserve currency mainly means that the government has taken the right steps to free up its’ economy. It has reined in intervention and has allowed the currency to be more ‘free’ within the international markets.

Central Banks, around the world, which hold SDRs in reserve, have this new currency as an option to convert into. This means that a lot more Chinese bonds (maybe a trillion dollars’ worth) will now be able to find their way into the market.

Additionally, there is no indication that Central Banks have a lot of demand for the Yuan. This decision gives them the option to convert into the currency, but whether or not they will is a question yet to be answered. The US dollar is still the worlds’ reserve currency.

I question how the SDR will maintain any value if all of its’ underlying currencies, that it has been composed of, have become worthless.

If this is what does occur, then they will be forced to back these fiat currencies with a tangible asset in order to accept this standard. The only money that has lasted for over 5,000 years is gold. I would not be surprised to see a new gold standard set in some way, but that is still a long way away and some serious catastrophes have to happen first.


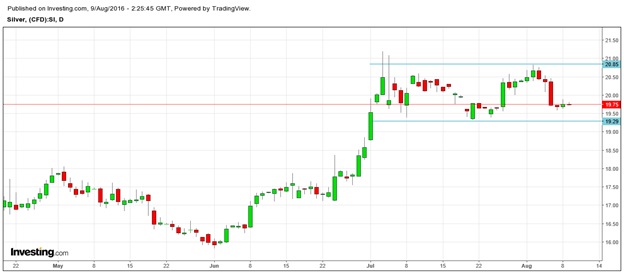
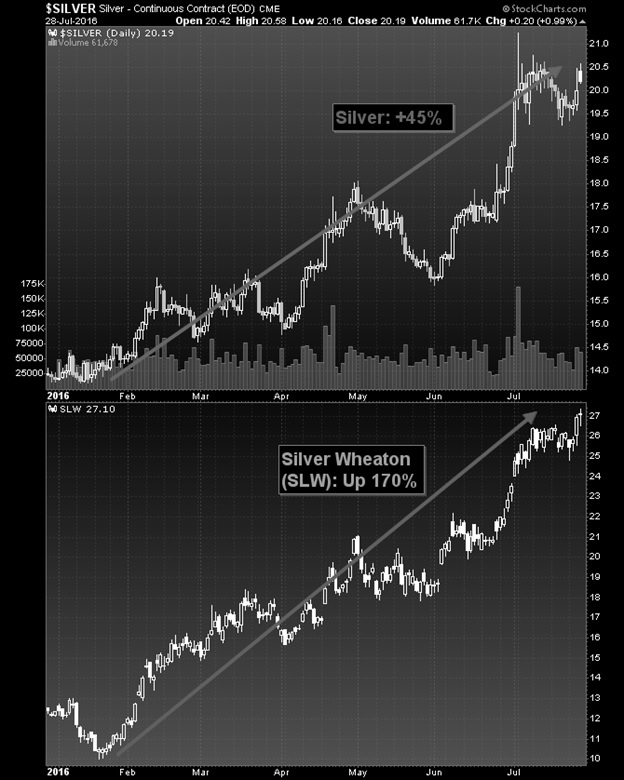
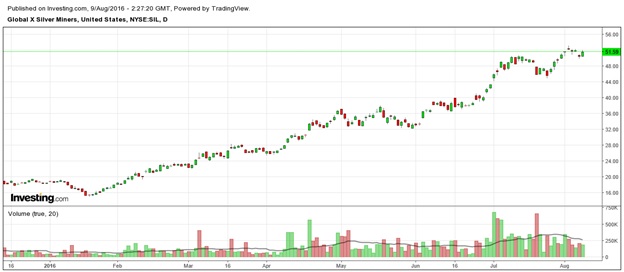
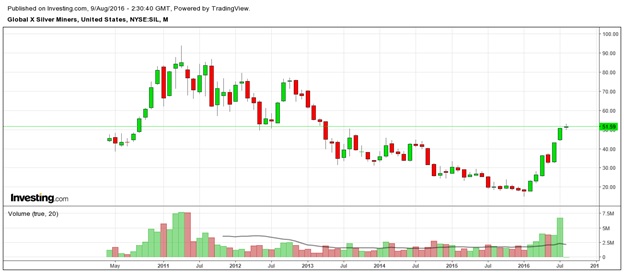
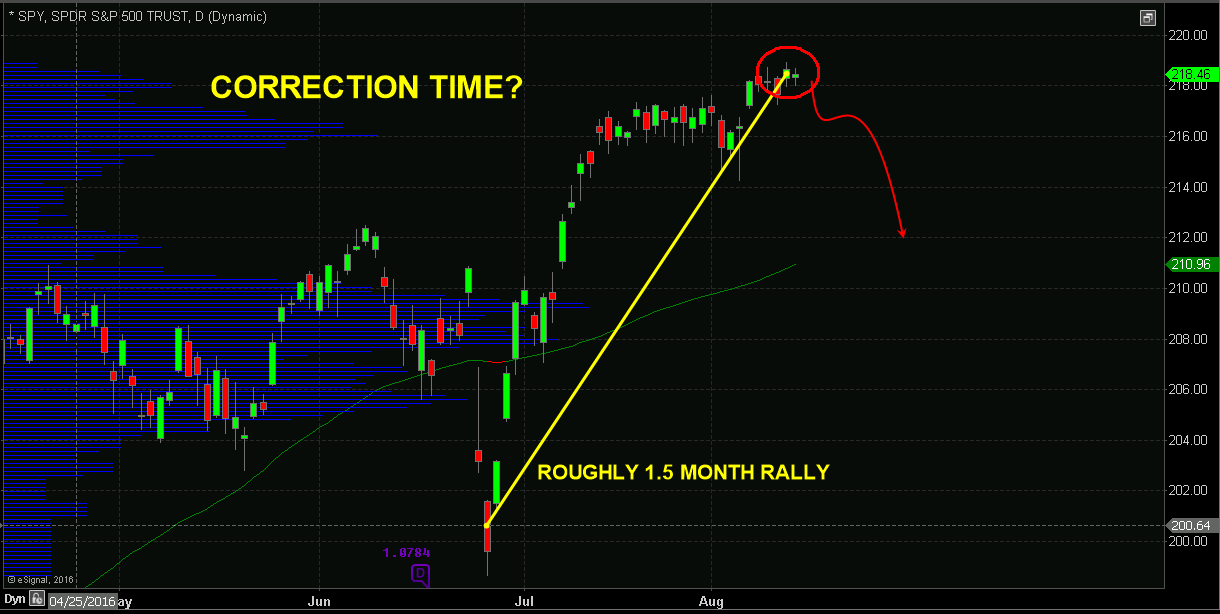
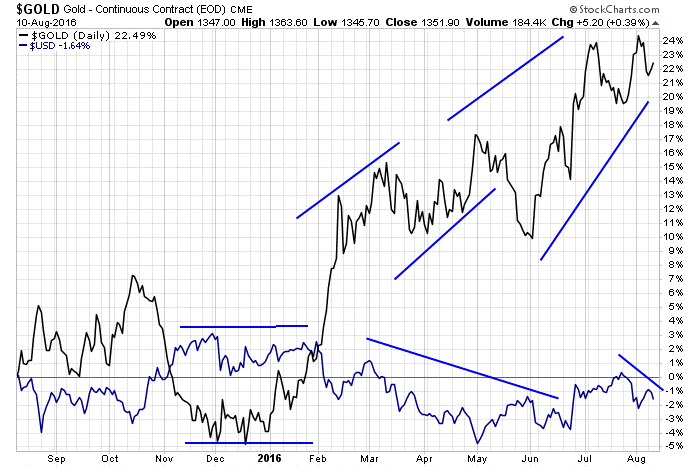
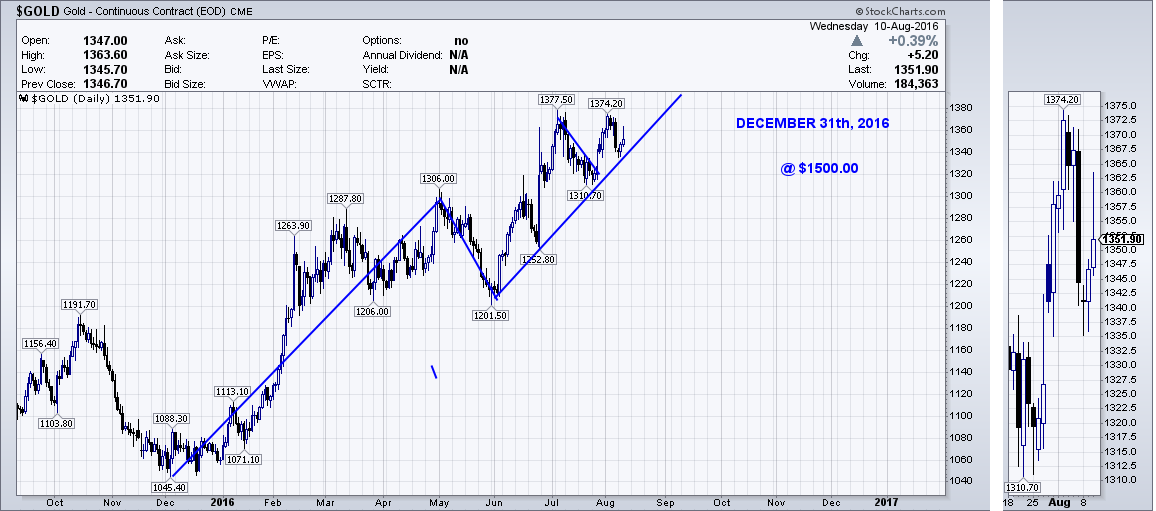
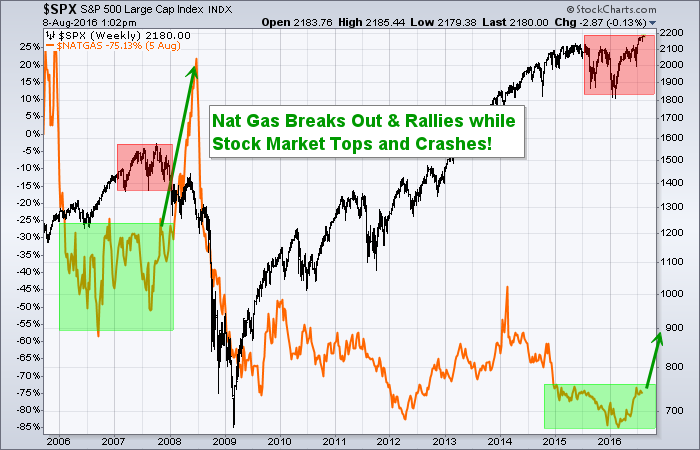
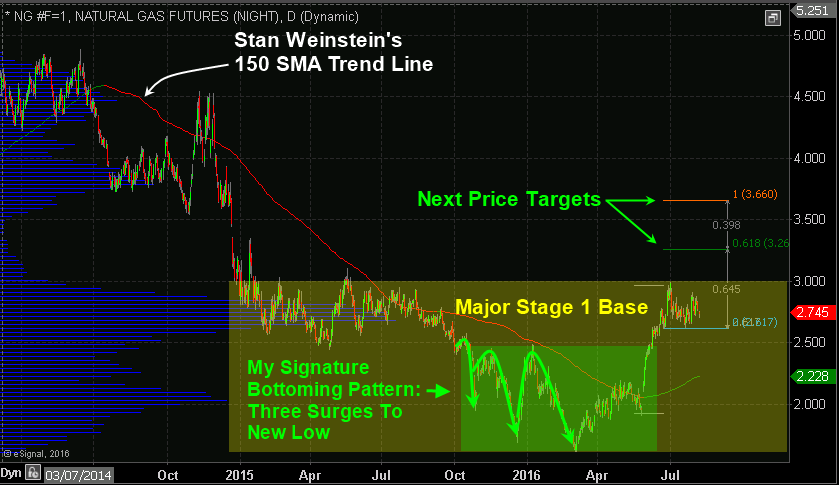
With that said, the markets tend to move before major events happen, so as things worsen globally, it only makes sense for precious metals (physical currency) to strengthen over time.

There are several big moves likely to happen in the coming month from indices, commodities, currencies and bonds. If you want to be positioned to profit from these next major moves be sure you join my premium newsletter at www.TheGoldAndOilGuy.com

Chris Vermeulen

The current overall SPX pattern is a broadening top, which is usually a very reliable pattern.  The market continues to look as though it wants to go even lower. The momentum shift, which I have been expecting, has been slow to start, however one should be prepared for this occurrence ahead of time.

Nevertheless, the large divergences which I have been viewing, in my proprietary oscillators, are most real, and, once the selling starts, the momentum should quickly move to the downside. 

The current market is being supported by a lack of sellers more so than aggressive buying.  With investors still thinking that there is no other place to store their money, they appear to be content with leaving their money with risk-on assets within a market that is pushing to all-time highs. 

This type of mentality usually leads to large losses rather than big gains.  There isn’t any real opportunity for growth in the SPX that I can see right now.

Dow Theory: Market Indexes Must Confirm Each Other

The Dow Theory was formulated from a series of Wall Street Journal editorials which were authored by Charles H. Dow from 1900 until the time of his death in 1902. These editorials reflected Dow’s beliefs regarding how the stock market behaved and how the market could be used to measure the health of the business environment.

Dow first used his theory to create the Dow Jones Industrial Index and the Dow Jones Rail Index (now Transportation Index), which were originally compiled by Dow for TheWall Street Journal. Dow created these indexes because he felt they were an accurate reflection of the business conditions within the economy, seeing as they covered two major economic segments: industrial and rail (transportation). While these indexes have changed, over the last 100 years, the theory still applies to current market indexes.

Market indexes must confirm one another. In other words, a major reversal from a bull or bear market cannot be signaled unless both indexes (generally the Dow Industrial and Transports Averages) are in agreement. Currently, THEY ARE DIVERGING,ISSUING A MAJOR NON-CONFIRMATION HIGH ON THE DOW JONES INDUSTRIAL AVERAGE. If one couples this with the volatility index (Fear Index), this is a warning sign and a recipe for disaster.

chart 1

The FEDs’ monetary policy over the last eight years has led to unproductive and reckless corporate behavior. The chart below shows U.S. non-financials’ year-on-year change in net debt versus operating cash flow as measured by earnings before interest, tax, depreciation, and amortization (EBITA).

Chart 2

The growth in operating cash flow peaked five years ago and has turned negative year-over-year. Net debt has continued to rise, which is not good for companies.

This has never before occurred in the post-World War II period. In the cycle preceding the Great Recession, the peaks had been pretty much coincidental. Even during that cycle, they only diverged for two years, and by the time EBITA turned negative, year-over-year, as it has today, growth in net debt had been declining for over two years. Again, the current 5-year divergence is unprecedented in financial history!

Today, most of that debt is used for financial engineering, as opposed to productive investments. In 2012, buybacks and M&A were $1.25 trillion, while all R&D and office equipment spending were $1.55 trillion. As valuations rose, since that time, R&D and office equipment grew by only $250 billion, but financial engineering grew by $750 billion, or three times this!

You can only live on your seed corn for so long. Despite there being no increase in their interest costs while growing their net borrowing by $1.7 trillion, the profit shares of the corporate sector peaked in 2012. The corporate sector, today, is stuck in a vicious cycle of earnings manipulation management, questionable allocation of capital, low productivity, declining margins and growing debt levels.

Conclusion:

In short, I continue to pound on the table to help keep you and fellow investors aware that something bad, financially, is going to take place – huge events like the tech bubble, the housing collapse a few years back, and now national financial instability. Experts saw all these events coming months and, in some cases, years in advance.

Big things typically don’t happen fast, but once the momentum changes direction you better be ready for some life changing events and a change in the financial market place.

Follow my analysis in real-time, swing trades, and even my long-term investment positions so you can survive from the financial storm: www.TheGoldAndOilGuy.com

Chris Vermeulen

Despite the expectations of a rate hike by the Fed in December of 2016, silver has remained close to its highs (as shown in the chart below).  After a stellar run, the white metal is consolidating near its highs, while anticipating its next imminent breakout.

Along with investing in the white metal directly, investors should also use this consolidation in silver to look at the silver miners, which offer excellent returns during silver bull runs.

Supply And Demand For Silver

“Industrial demand is set to increase, driven by rising incomes and growing penetration of technology in populous, developing nations, as well as new uses are being found for silver’s anti-bacterial and reflective properties in everything from hospital paints to Band-Aids to windows”, reports Bloomberg, who expects the industrial demand to surge within the next few years.

India and China will need approximately a billion smartphones and tablets by 2020. Demand for silver is expected to remain buoyant and demand will remain ahead of supply.

“Over the next ten or twenty years, more and more people are going to be using these devices, however, silver is a very limited commodity. “There’s just not a lot of it around” according to Keith Neumeyer, CEO of First Majestic Silver Corp.

It is this that most likely led a major Japanese electronics player to First Majestic in attempts to secure its’ future silver supply, which is a sign of a tightening supply.

“For an electronics manufacturer to come directly to us tells me something is changing in the market; I think we’ll see three-digit silver,” said Neumeyer to Bloomberg.

The Solar industry is booming, as well.  Solar power is taking over conventional power sources, and that is good news for silver as the solar industry is likely to consume more than 13% of the total silver demand in 2016. Similarly, ethylene oxide producers will also consume 25% more silver as compared to the previous year.

“Silver demand had a phenomenal 2015 with retail investment and jewelry fabrication both reaching all-time highs,” wrote Frank Holmes of US Global Investors in a post in early July 2016.

On the other hand, silver mine production is expected to drop for the first time since 2002 as mining production dips 5% during the current year.

Why Invest In Silver Miners Along With Silver?

After having established that silver prices are likely to increase further, due to supply shortage and increased demand, let’s review the best possible mode of investment in silver so as to maximize our profits.

During silver bull markets, the silver miners are favored by investors because their prices increase much more than the price of the white metal.  As the cost of production remains the same, the miners gain huge profits when silver prices move up.

Hence, traders prefer the silver miners, once the next Elliott Wave count is confirmed. This is the reason for the sharp 170% run-up in the stock prices of Silver Wheaton (SLW), a blue chip silver-streaming company.

For every $1 increase in silver prices, the silver miner has increased by more than $3, which indicates that the silver miners are a better trade than the underlying metal.

However, when silver corrects, the silver miners tend to underperform. The silver miners behave as the leveraged plays of silver, which are rising and falling far more than the underlying white metal.

The Global X Silver Miners ETF (SIL) offers an excellent opportunity to investors to enjoy the advantages of the silver miners with reduced risk, compared to owning single mining stocks. The ETF has seen a whopping rally from its lows of below $15 to the current price of $51.59.

Even after the phenomenal rise, the ETF is still well below its 2011 high of $94. (as shown in the chart below)

Traders can keep an eye on SIL to accumulate on dips.

Conclusion

Silver has put a bottom in place and will continue to move even higher, in the coming months and years. In order to benefit from this rise, traders should keep an eye on the silver miners, which act as leveraged plays for the underlying ‘white metal’. With silver booming, silver miners’ prices will continue to skyrocket higher.

However, every rally faces corrections, hence, the right time to buy is when the “risk-reward” is favorable. Keep following my articles and analysis for the right time to enter this ETF.

Stock & ETF Trading Signal Newsletter: www.TheGoldAndOilGuy.com

Chris Vermeulen

Nature functions in cycles. Each 24-hour period can be divided into smaller cycles of morning, afternoon, evening, and night. The whole year can be divided into seasonal cycles. Similarly, one’s life can also be divided into cycles. Cycles are abundant in nature – we just have to spot them, understand them, and be prepared for them, because they happen whether we like it or not. Likewise, economic experts have noticed that the world also follows different cycles. An important pioneer in this field was the Russian social economist, Nikolai Kondratiev, also called Nikolai Kondratieff, a relatively unknown genius.

Who Is Kondratiev?

Geniuses have been known to defend their principles and beliefs, even at the cost of losing their lives; they may die but their legacy lives on, as did Kondratiev. He was an economist who laid down his life defending his beliefs. He was the founding director of the Institute of Conjuncture, a famous research institution, which was located in Moscow. He devised a five-year plan for the development of agriculture in Russia from 1923-1925.

His book, “The Major Economic Cycles,” was published 1925, in which his policies were in stark contrast to that of Stalin’s. As a result of this, Kondratiev was arrested in 1930 and given a prison sentence. This sentence was reviewed, and, consequently, he was executed in 1938. What a tragic loss of such a genius at only 42 years of age. He was executed because his research proved him right and Stalin wrong! Nonetheless, his legacy lives on and, in 1939 Joseph Schumpeter named the waves Kondratiev Waves, also known as K-Waves.

What Are Kondratiev Waves?

Investopedia defines the Kondratieff Wave as, “A long-term cycle present in capitalist economies that represents long-term, high-growth and low-growth economic periods.” The initial study by Kondratiev was based on the European agricultural commodity and copper prices. He noticed this period of evolution and self-correction in the economic activity of the capitalist nations and felt it was important to document.

Chart 1 CNA

These waves are long cycles, lasting 50-60 years and consisting of various phases that are repetitive in nature. They are divided into four primary cycles:

  1. Spring-Inflationary growth phase: The first wave starts after a depressed economic state. With growth comes inflation. This phase sees stable prices, stable interest rates and a rising stock market, which is led by strong corporate profits and technological innovations. This phase generally lasts for 25 years.
  1. Summer-Stagflation (Recession): This phase witnesses wars such as the War of 1812, the Civil War, the World Wars and the Vietnam War. War leads to a shortage of resources, which leads to rising prices, rising interest rates and higher debt, and because of these factors, companies’ profits decline.
  1. Autumn-Deflationary Growth (Plateau period): After the end of war, people want economic stability. While the economy sees growth in selective sectors, this period also witnesses social and technological innovations. Prices fall and interest rates are low, which leads to higher debt and consumption.  At the same time, companies’ profits rise, resulting in a strong stock market. All of these excesses end with a major speculative bubble.
  1. Winter-Depression: This is a period of correcting the excesses of the past and preparing the foundation for future growth. Prices fall, profits decline and stock markets correct to the downside. However, this period also refines the technologies of the past with innovation, making it cheaper and more available for the masses.

Accuracy Of The Cycle Over The Last 200 Years

The K-Waves have stood the test of time.  They have correctly identified various periods of important economic activity within the past 200 years. The chart below outlines its accuracy.

Very few cycles in history are as accurate as the Kondratiev waves.

Chart 2 CNA

Criticism Of The Kondratiev Waves

No principle in the world is left unchallenged.  Similarly, there are a few critics of the K-Waves who consider it useful only for the pre-WWII era. They believe that the current monetary tools, which are at the disposal of the monetary agencies, can alter the performance of these waves. There is also a difference of opinion regarding the timing of the start of the waves.

The Wave Is Being Pushed Ahead But The Mood Confirms A Kondratiev Winter

Chart 3 CNA

Chart 4 CNA

A closer study reveals that the cycles are being pushed forward temporarily. Any intervention in the natural cycle unleashes the wrath of nature, and the current phase of economic excess will also end in a similar correction. The K-Wave winter cycle that started in 2000 was aligned with the dot-com bubble.

The current stock market rise is fueled by the easy monetary policy of the global central banks. Barring a small period of time from 2005-2007 when the mood of the public was optimistic, the winter had been spent with people in a depressed social mood. The stock market rally from 2009-2015 will be perceived as the most hated rally and the one most laden with fear.

Every dip of a few hundred points in the stock market starts with a comparison to the Great Recession of 2007-2009. The mood exudes fear and disbelief that the efforts of the central banks have not been successful and are unable to thwart off the winter, as predicted by the K-Waves. The winter is here and is reflected in the depressed social mood.

How To Weather Out Brutal Winter

In the last phase of the winter cycle, from 2016-2020, which is likely to test us, the stock market top is in place. Global economic activity has peaked, terrorism further threatens our lives, geopolitical risks have risen, the current levels of debt across the developed world are unmanageable, and a legitimate threat of a currency war occurring will all end with the “The Great Reset.” Gold will be likely to perform better during this winter cycle. Get in love with the yellow metal; it’s the blanket which will help you withstand the winter.

Conclusion

Cycles are generally repetitive forces that give us an insight into the future so we can be prepared to face it and prosper. Without excessive intervention, nature is very forgiving while correcting the excesses.  But if one meddles with nature, it can be merciless during the correction. The current economic condition will end with yet another reset in the financial markets. Prices will not rise forever, and a correction will take hold eventually. Until then, we follow and trade accordingly. I will suggest the necessary steps to avoid losses and prosper from market turmoil when it unfolds.

Follow My Analysis At: www.TheGoldAndOilGuy.com

Chris Vermeulen

The stock market tends to repeat itself on regular bases. Why? Because it moves mainly based on the emotions of market participants, with the exception of extreme times when the masses are moving the market with extreme fear or greed, at which point they are flooding the market with buy or sell orders to create a final pop or drop in the market just before a major market reversal.

As with everything in the universe, everything moves in cycles, periods of expansion and contraction, and there are regular wave-like patterns that happen on a regular basis no matter the time frame one is reviewing on a stock chart.

Below are three charts, each showing a similar price pattern of extreme washout lows, followed by roughly a 1.5-month rally taking investors on a roller coaster ride from fear and complete panic to greedy know-it-alls.


Current S&P 500 Daily Chart Price Action

spypre-crash


October 2014 – S&P 500 Daily Chart Price Action

SPXCORRECTION

September 2015 – S&P 500 Daily Chart Price Action

SPXCORRECTION2


Trading Conclusion:

In short, no pun intended, us large cap stocks look and feel toppy here. I feel a correction is likely to take place any day now, and the big question is “how much will the stock market pullback?

Will it be another 4-5% correction similar to the chart examples above? Or will it be something larger 8-15% correction?

Get My Stock and ETF Trade Signals Today

www.TheGoldAndOilGuy.com

Chris Vermeulen

My analysis indicates that gold will be implemented in order to protect ‘global purchasing power’ and to minimize losses during our upcoming periods of ‘market shock’. It serves as a high-quality, liquid asset to be used whereas selling other assets would cause losses. Central Banks of the world’s largest long-term investment portfolios use gold to mitigate portfolio risk, in this manner, and have been net buyers of gold since 2010.

Investors should make use of golds’ lack of ‘correlation’ with other assets which makes it the best hedge against currency risk.  Last May of 2016, there was a huge trend change in U.S. gold investment as the Swiss exported a record amount of gold to the United States. There has been a huge increase in gold flows into the Global Gold ETFs & Funds.  Something seriously changed, in May of 2016, as the Swiss exported more gold to the U.S. within one month than they have done so over the last year.

gcseasonblack

Gold has a “clear presence” to play in a world dominated
with ‘global economic uncertainty”

Despite the fact that we are in for a period of great financial turmoil, investors can safeguard themselves by investing wisely in gold. Do not be left behind and witness your dollar assets losing their value.

It is in these very conditions that gold (precious metals) is the only investment that will appreciate in value over time.  Gold will continue to perform its’ role as a “safe haven” during these times of crisis which currently appear to be never ending. The metals surge of as much as 8.1% on the day of the “Brexit” vote, last month, is an indicator that its’ luster of safety is undimmed in the current markets. There is little to be gained from arguing whether such beliefs are right or wrong:  Governments, around the globe, have moved to a new stage of desperation by toying with the idea of “helicopter money”.

It is my belief that since “Brexit” occurred, it could unleash a general exodus and the disintegration of the European Union is now almost unavoidable.

The list of prominent Hedge Fund Managers who are investing in gold is growing.  Paul Singer, of Elliott Management Corporation, is the latest name to lend his support. It is likely that more investment institutions will turn to gold as the logical solution to countervail the effects of many years of ‘quantitative easing”.

Gold has been traded for over 5,000 years and for the first time has a positive carry in many parts of the globe as bankers are now experimenting with the absurd notion of negative interest rates. Some regard it as a precious metal while I regard it as a currency!

Soros Fund Management LLC, which manages $30 billion for Mr. Soros and his family, sold stocks and bought gold and shares of gold miners whilst anticipating weakness in various markets. Investors view gold as a ‘safe haven’, during times of turmoil but they tend to be late to the game as they don’t buy gold until there truly is turmoil and gold will have already appreciated substantially at that point.

gcseason1

“It’s a glaring warning sign of deflation. We’ve never really had deflationary fears throughout such a widespread part of the world before,” said Phil Camporeale, a Multi-Asset Specialist at JPMorgan Asset Management.

The FED is doing everything in its’ power to prevent a rise in the dollar. They are willing to “orchestrate” any scenario so as the stock market will continue to soar and people will feel a “wealth effect” from new stock market highs while the others are experiencing the economy “contracting”. The FED is getting everything it wants, in this regard, and will continue to do so as their number one priority is “debasing” the U.S. Dollar.

As the U.S. Dollar falls from all of the FEDs’ QE, it will lift up gold prices to unprecedented highs.

golddollar

Investors of all levels of experience are attracted to gold as a solid, tangible and long-term “store of value” that historically has moved independently of other assets classes.

Golds’ importance, even in today’s environment, was clearly visible during the massive rally at the start of the year, when all other asset classes were tanking. Investors piled into gold on the scare of an imminent global financial reset.

Investors should make use of golds’ lack of ‘correlation’ with other assets which makes it the best hedge against currency risk.


Does Gold Continue Its Bull Market Towards $1500.00?

goldseason


Conclusion:

The trend for ETFs to pile in to the precious metal sent the price of gold soaring by 25% in H1, the biggest price rise since 1980. For the first time ever, investment, rather than jewelry, was the largest component of gold demand for two consecutive quarters.

There will be another great opportunity in gold, silver and especially miners in the near future which followers of my work will benefit from. Follow my analysis and trades at: www.TheGoldAndOilGuy.com

Chris Vermeulen

During the last stock market top in 2007-2008 the price of natural gas completed a basing pattern (bottom) and broke out and had a massive rally. Will this happen again this time around?

Based on the stock market stage analysis, market sentiment, and the price action of natural gas, it appears the stock market is topping and natural gas is on the verge of a breakout and rally.

The price of natural gas moves in strange ways, and I mention this to subscribers when its taking place. I found that on when there is fear in the stock market and stocks are down along with almost every other asset class (this is rare), that natural gas is typically the only asset and/or commodity trading higher those days. I’m not 100% sure what to make of it, but I have seen this repeatedly over the years.


See the weekly chart below of the SP500 index and natural gas

NG4cst

Natural Gas Forms Bottoming Pattern and Basing Pattern

NG4cst2


Earlier this week I recorded my conversation with HoweStreet
talking about natural gas, gold and oil – LISTEN HERE


Natural Gas Trading Conclusion:

In short, no matter if this correlation in stock price and natural gas exists or not, the fact of the matter is that stocks are showing signs of a significant top, while natural gas appears to be bottoming.

In the coming days several swing trade and long-term opportunities will present themselves and I will share which ETFs and or stocks I will trade to profit from the pending moves.

Receive My Trading Signals & Analysis: www.TheGoldAndOilGuy.com

Chris Vermeulen

Get Chris Vermeulen’s Stock & ETF Picks : Click Here

We are currently experiencing a Kondratiev Winter stage in this stock market which is at its’ “tipping” point.  This is where nominal to incremental highs on the SPX can be exceeded by 2%, but, by no more than 4%.  I am observing a “MARKET FAILURE” right here and now. This is a BULL TRAP!

Last Fridays’, August 5th, 2016 rally in the SPX big price move, on low volume, resulted in no trend change to the larger BEARISH patterns. It does not change the Bearish pattern, but it probably does mean that the current rally will last for at least a few more days.  There are multiple times in which rallies are reversed during the early part of the following week after a strong jobs report.

Both investors and traders continue to throw money at stocks every time that there is any hint of “manufactured” good news. The majority of stocks, on the NYSE, are still in ‘downtrends’.  Last Friday, August 5th, 2016, the Bureau of Labor Statistics released their “bogus” jobs report claiming that 255,000 new jobs were created.

This strong number caused gold to drop sharply, which momentum traders could have profited handsomely if they knew about the rouge price spikes taking place in gold just hours before the move.

The labor participation rate rose a mere 0.2 percent to 62.8 percent which is at a 40 year low. This means that potentially over 90 million Americans are still not working.

After adding only 11,000 jobs, in May of 2016, the Bureau of Labor Statistics would have the public believe that the US has now added over 550,000 jobs, in the sixty-day period, since. I find these numbers still hard to believe.  There is no actual evidence of this having occurred:

It is all just a statistical adjustment as well as the “seasonal adjustment” factor as mentioned by Zero Hedge.

Over the past 120 years, within in a 7-year bull market, it is during the Fall season of the 7th year when the next major decline commences.  The SPX is putting in its’ final TOP.  It will become a well-defined top that usually cannot exceed a 2% to 4% throw over.

We are currently witnessing an extremely aged and overvalued bull market.  The SPX Index, despite the exuberance of “record highs,” is just 2% above its’ May 2015 peak.  The SPX has pushed it to its’ most extreme overvalued, overbought and over bullish syndrome in an environment where momentum is slowly rolling over.  Whether one is bullish or bearish, one needs to recognize that any current extremes are “unparalleled”.

art1


Statistically speaking, the single most probable outcome is actually a small gain which we have experienced and which is then followed by abrupt and severe losses that can have the potential of wiping out weeks or even months of upside progress with an unexpected and rapid decline.

I will have to wait for the market sentiment to shift toward “risk-aversion”, before participating in any long-term bearish ETF trades.  Within an increased global systematic world, both investors and traders are making “risky and unparalleled” bets, these days.

I can visualize the financial meltdown.  Many financial entities will have lower profits since low interest rates persist. Historically, low yields squeeze the net interest income of banks and make liabilities harder to meet for insurance companies. I would cut their EPS forecasts by 5%-7%. The fall in Treasury yields explains most of the cut. Their strong headwind is headed our way.


Sell into These Rallies: If you are still in the stock market, I continue to recommend to sell stock positions into the rallies.

Chart End of July 31st, 2016

Take a look at the stock index outflows in July. This shows money continues to leave the leading indicator stocks (Russel 2k, and the Nasdaq).

art2


CNN Chart of Fear and Greed August 6th, 2016

Now, take a look at the fear index. While I personally use a slightly different mix of indicators to measure market sentiment, this is very close to my calculation and shows it in a simple visual format.

art3


Conclusion:

With all of the “Extreme” complacently and the “Extreme” greed in the stock market, it is the perfect storm for DISASTER!

With that said, nothing happens exactly when it should in the stock market. The market is constantly trying to get the mass of participants on the wrong side of the market. If it doesn’t shake you out, it will wait you out and I feel it’s doing the later method now.

Huge opportunities are just around the corner for both swing trades and long-term ETF investment positions that shoot up in value sooner than later, which I will share with my readers.

Get My Trade Alerts at: www.TheGoldAndOilGuy.com

Chris Vermeulen

Here is my chart of GLD during post-market trading today (Thursday, Aug 4th). I sent this chart to my followers alerting them of the next day’s market bias/trend and trade setup.

If you don’t know what spike alerts are, let me explain briefly. In short, the market gives of these rogue price spikes which I have been able to filter and identify. On top of that, some data feeds filter their data depending on the chart timeframe you are loading and will only use the AVERAGE price and not every tick to create the price bar on the chart to remove these spikes.

Meaning, even if your charting platform and data feeds don’t filter out these rogue price spikes then you may only see these price spike with specific chart time frames like the 30-minute or a 10-minute chart. It varies from day to day and when these special rogue spikes happen.

Bottom line, if you see these spikes, 80% of the time we see the price spike target reached within 24-48 hours.


Thursday Aug 4th Spike Alert:

This shows you the spike down as it was taking place with my automated spike identification software. This spike took place right after the market closed Thursday giving us several hours in afterhours trading to enter the trade (short gold, or buy an inverse ETF).

GLD didn’t only drop to the price target of $128.87, but gap below that and continued to fall all session closing at $127.55 a share. There are many ways to play these spikes in price of gold. You can trade the ETFs or futures contract as shown in the chart below, or trade the even faster moving ETFs like DUST or NUGT, GDX, GDXJ, or even a high beta gold miner stock.

gld-spike


Trading Chart Post Spike Alert:

gldspike2

Back in April/March I shared many of these spike alerts trade setups and I also talked about the best ways to trades them and my recommended USA/Canadian broker and also the CFD and spread betting firms I use.

Check out this post showing spike alerts in more detail and best brokers: Click Here


Trading Conclusion:

In short, while most price spike alerts are not huge by any means, in many cases these spikes will provide $1-$3 per share profit and if you are active trader with 500 or 1000 share lots or trading futures with a $5000 account size you can making some decent weekly/monthly gains with these special price spikes.

Get My Special Secret Spike Alerts Today: SPIKE ALERTS

Chris Vermeulen
TheGoldAndOilGuy.com