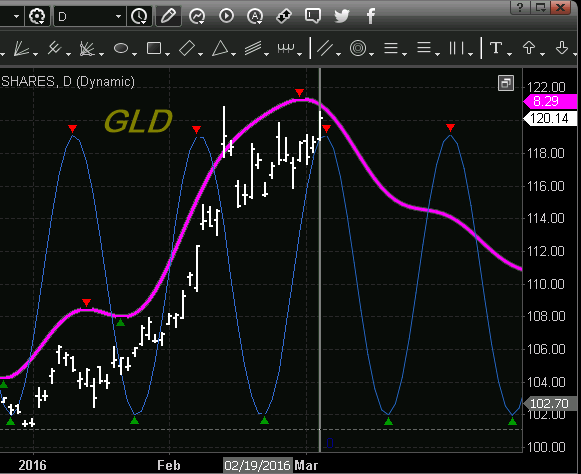
Its beginning to feel a lot like greed buying in stocks and metals… As talked about in today’s video and many other times in the past 10 days we are waiting to see if we get a bearish price pattern on gold miners, or a blow off time. Today looks and feels like a blow-off top in gold and miners. We could see price gap up tomorrow or maybe more up for another day or two, but overall I think big selling is just around the corner. My story has not changed, it just that them market always has a way for dragging patterns out longer than you anticipated.
The saying is “If the market can’t shake you out, it will wait you out.”
Here are two gold cycles… See chart below or login to view:
https://thegoldandoilguy.com/wp-content/uploads/2010/04/3-Cycle.jpg532548adminhttp://www.thegoldandoilguy.com/wp-content/uploads/2014/11/tgaoglogo.pngadmin2016-03-03 13:43:422016-03-03 13:43:42Gold Cycles Are Topping – Believe It or Not
Yesterday the US stock market posted massive gains with indexes closing up 2-3%. We don’t see that very often. This type of price action is what causes most traders and investors to become bullish at the wrong time
I could write a book on the characteristics of a bear market but the important point for today is to know that some of the strongest rallies is stocks happen during bear markets. It’s just the way the market moves because of fear, greed, and short covering.
When traders and investors see these massive price gains the think the bull market is back and price will continue higher. While they may be correct for some time, the overall longer market trend clearly remains down and price will weaken and drop over time.
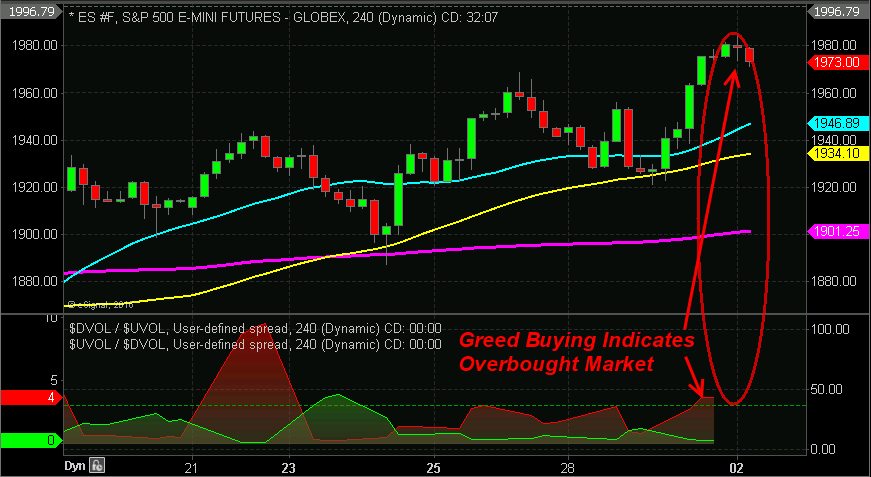
Take a look at the chart below because they paint a simple picture of short term market trend and timing of minor market tops and bottoms.
SP500 Futures 240 Minute Chart (4 hour bar chart)
This chart shows the overall trend is up by looking at the moving averages. And more importantly the bottom custom RED indicator line which moves above the dotted line threshold.
I use tells us when market participants are becoming greedy and buying at high price s because they fear they will miss more of a price rise. This is blatant greed and it typically signals a top is very close.
On the contrary, the GREEN line indicates fear/panic among traders and that they are dumping shares because they fear price is going to continue to drop.
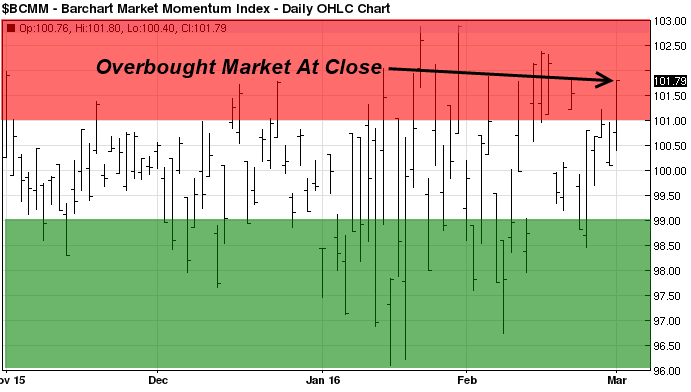
Now let’s take a look at the Barchart.com market momentum index.
This is a simple free online chart I follow closely so I know if I should be looking to get long, short or just avoid day trades or momentum trades. I like to only take positions during extreme levels because it typically means price will have a strong reversal and trend vs a slower, choppy and more unpredictable movement.
This indicator is simple yet highly effective. If the price is over 101 then the market is overbought and we should see price pullback the same day or the next session. When its is below 99 then the market is oversold and a bounce or bottom is likely.
It is important to understand that if the trend is up with the broad market, then you should be looking buy into the oversold dips and be taking partial profits during overbought times. And Vice-versa in a down trend. See this momentum index chart live here.
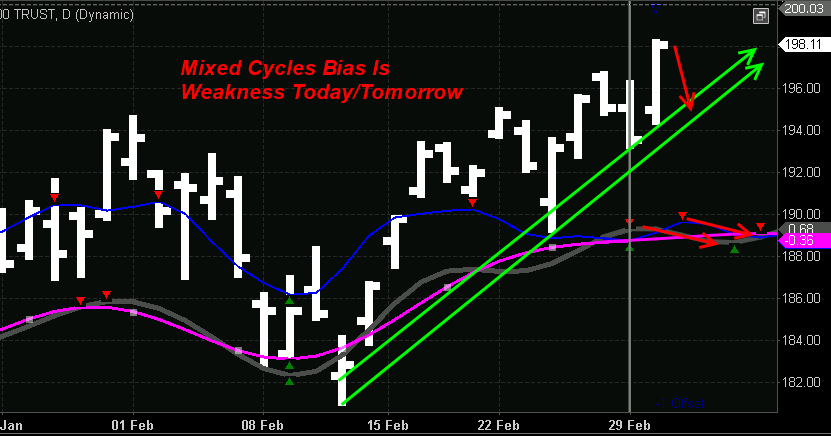
My Cycle Analysis and Trend Forecast
It’s tough to see the dark blue cycle line and the dark grey line point to a pullback for a couple days. A pullback to first support level is highly likely.
Price Spikes Provide Steady Stream of Intraday/Momentum Trades
Yesterday March 1st was a great day for day traders and momentum traders who followed my price spike trade setups in the SPY and GLD. Both of these setups played out and reached their targets in the first day.
Market Forecast Tips and Analysis Conclusion:
Hopefully, this short article helps shed some light on how to identify market tops and bottoms. Trading is not rocket science but it does take extreme discipline, patients and practice.
https://thegoldandoilguy.com/wp-content/uploads/2016/02/spikemetal.jpg350350adminhttp://www.thegoldandoilguy.com/wp-content/uploads/2014/11/tgaoglogo.pngadmin2016-03-02 09:02:242016-03-02 09:18:35How to Spot Short Term Market Tops & Bottoms with Ease
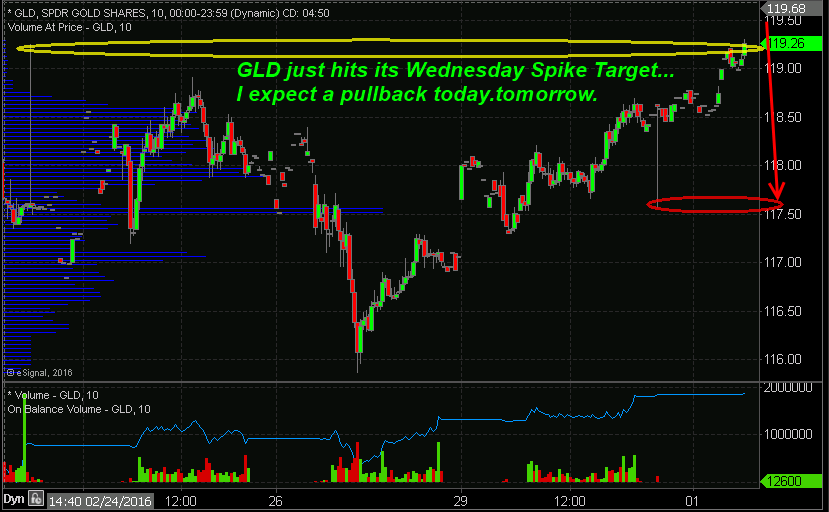
Last Wednesday I sent out an update telling you we have a price spike pointing to higher prices.. well today that level was reached, and in fact last night we had a spike down… likely gold rolls over today.
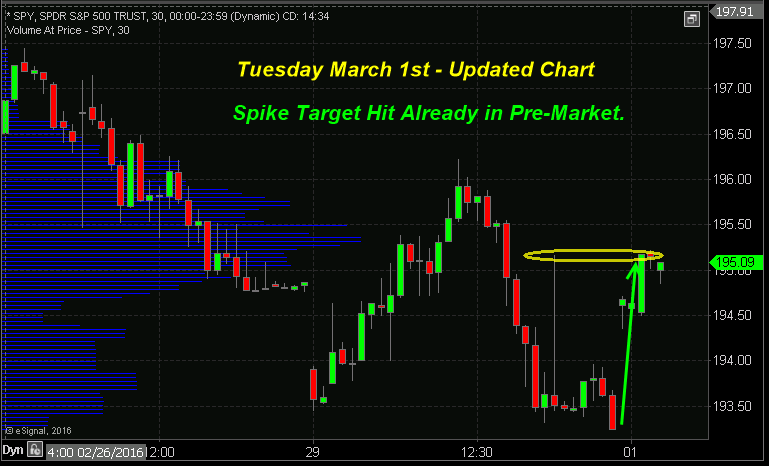
Well, I just woke up to get an early start reviewing the market and I see the SPY (SP500 Index) has already reached it’s post-market spike… Geez that was fast. See updated chart below. But that is like 6or 7 of these SPY price spikes we have seein the past 6 weeks and everyone has been a success.
—————————————– FEB 29th EVENING POST: —————————————–
Couple things to touch on as this week begins.
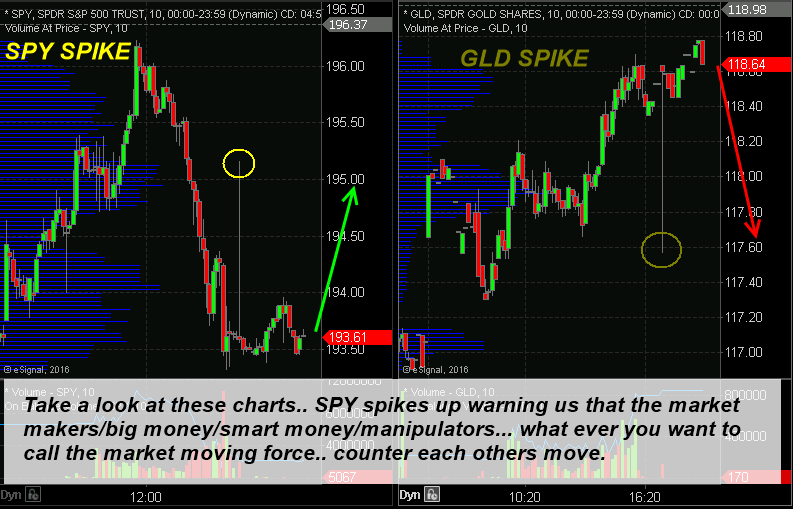
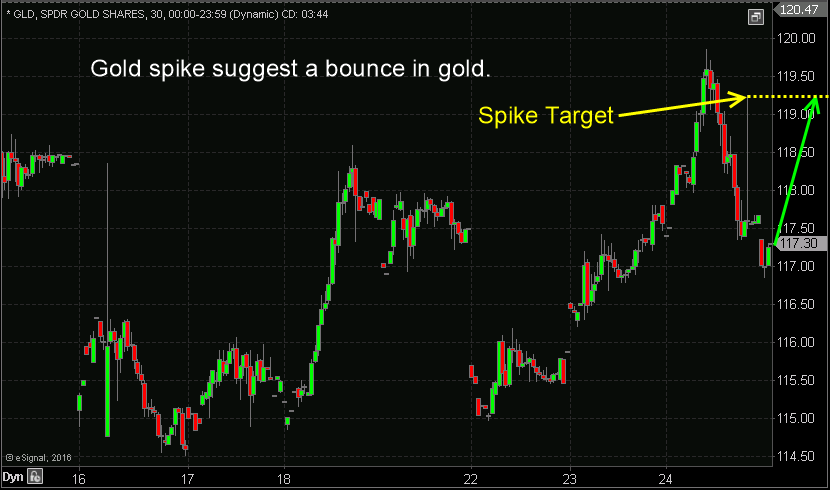
Below is a chart of two price spikes tonight: SPY and GLD.
Remember the market always has a way of making it difficult to get into a trade or stay in it long enough to make money. And when we get these price spikes we typically get a better chance to enter the following day/morning when the market tries to shake everyone out of the market who are positioned for this direction of a move. Meaning we could see SPY drop and shake everyone out before heading higher tomorrow afternoon, and GLD may spike to shake all the shorts out of the market before it drops.
The way the market has been moving is that if stocks are going up, gold is going down… so these spikes make a lot of sense right now.
I find it’s best to wait for a setup you are really excited about at an extreme price than to just jump in at first sign of a signal. I would rather miss some trades and get in only when I’m really feeling the setup is screaming at me. Most signals like Price Spikes and Cycles topping or bottoming are early indicators by a half day to three days in most cases.
The ideal setup could be Tuesday March 1st for gold miners. I feel they will gap higher and give us a great shorting opportunity (buy DUST) and the returns could be big. With that said remember DUST is 3x move and you can see your position grow or shrink by 15-20% in one day…
Also, keep in mind price spikes and my short term forecasts are “Trade Ideas” for active traders who are comfortable taking trades on their own. When I have an OFFICIAL Trade Alert subscribers will be sent an email, SMS text alert and it will be posted on the members area home page and in the portfolio.
Now we will see what gold does today. I do feel gold will move up then reverse hard in afternoon.
LEARN MORE ABOUT FINDING AND TRADING PRICE SPIKES: CLICK HERE
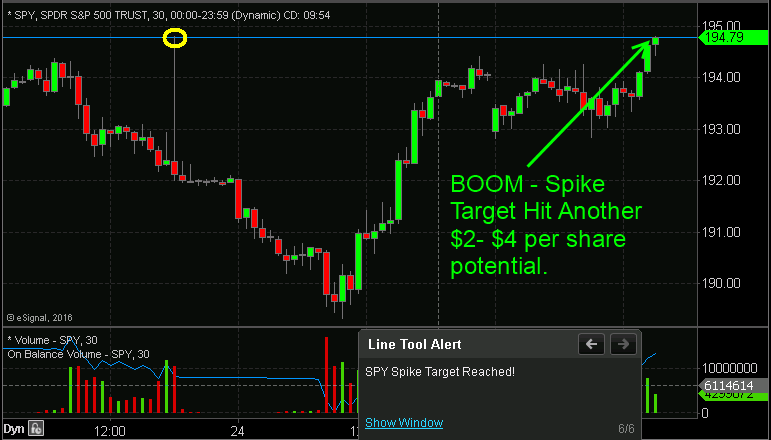
I hope you have been watching and learning about these price spike moves I am sharing…
Market just did it again and nailed another target that had a $2-$4 profit per share move depending when you got in, IF you got in.
I should not these are trade ideas for intraday/momentum traders but just look at the potential gains that can be made in 24-48 hours when they occur!
I sent this spike alert out on Feb 23rd after hours, market opened sharply lower the next day and all indicators were screaming buy also… Gotta love it!
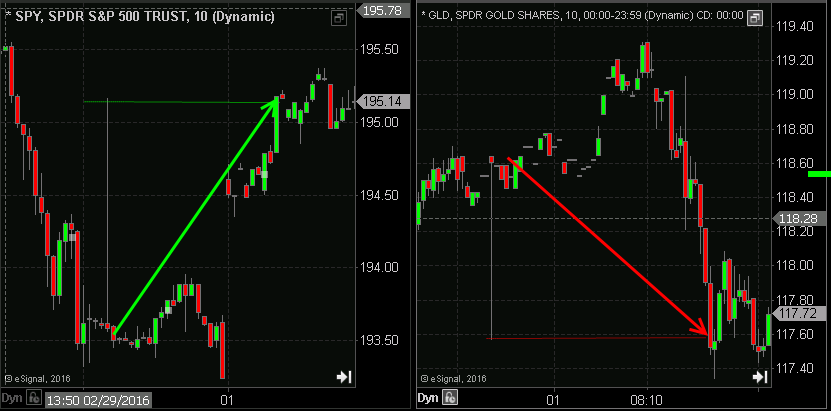
Today the stock market and gold moved exactly as we expected…
The SP500 hit our spike target this afternoon for a potential $4 per share move in SPY in just 2 days – that is huge.
Gold started to rise but has not yet reached the spike target.
If the market were to do what I think it will tomorrow. we see stocks move higher in the morning then roll over and sell off to start its decent to the downside spike target.
If that happens then we should see gold rally in the afternoon and tag its upside spike target I shared with you this morning.
GET THESE ALERTS BY EMAIL AND SMS TEXT – PROFIT WITH ME:SUBSCRIBE HERE
https://thegoldandoilguy.com/wp-content/uploads/2016/02/em.jpeg315800adminhttp://www.thegoldandoilguy.com/wp-content/uploads/2014/11/tgaoglogo.pngadmin2016-02-25 14:34:232016-02-25 17:31:10Words Cant Say Enough – Wow Profits!
Chris Vermeulen joins us today as a preview to this weekend’s show to discuss his outlook on the precious metals. The move in gold has been great but are we due for a natural / healthy correction? And why has silver not moved tot he degree that gold has?
https://thegoldandoilguy.com/wp-content/uploads/2016/02/Radio.jpg473560adminhttp://www.thegoldandoilguy.com/wp-content/uploads/2014/11/tgaoglogo.pngadmin2016-02-25 10:17:562016-02-25 10:17:56A FOCUS ON THE MOVES IN GOLD, SILVER AND THE MINERS
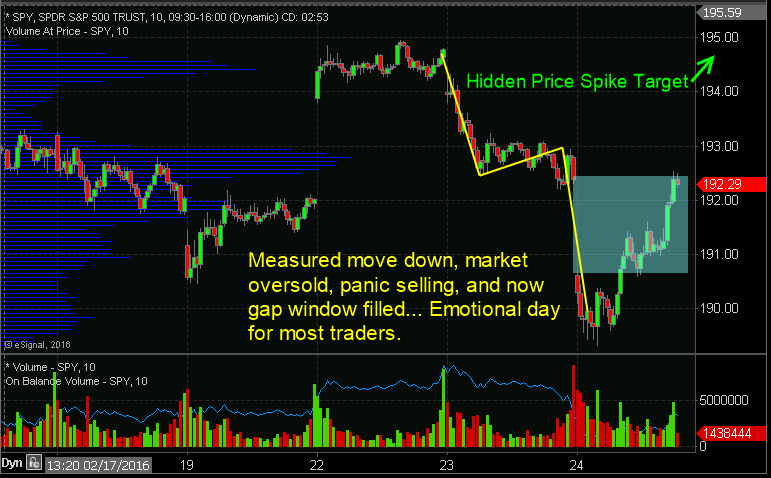
I just wanted to touch base with regards to the SPY price spikes on the recent setup this week and the new setup that I signaled last night to everyone.
It’s best if you read this really short post and most importantly see the three charts. The focus should be on the last chart as it shows last nights price spike warning.
Once you review this then the below paragraphs will make sense and you will understand what has just happened and likely learn something 95% of traders don’t understand:
Price Spikes, let me touch on these. In most cases if we see a price spike on the SPY the stock market seems move and reach that level within 24-48 hours. But I do also notice that when we see a price spike we typically get a better opportunity to enter the trade the day after as the “market” tries to shake the rest of the market participants off the boat before they allow the move to take place.
For example, yesterday we saw the spike in price pointing to a strong move up in stocks. While the market tipped its hand so we could see what they were planning to do, today’s big gap down is triggering fear and panic. Those who got long are under pressure today and likely going to bail on the trade idea. Ans those who have no idea about these price spikes but are long are simply selling today in fear of a crash. The “Market” is cleansing itself for the next move up. Well, that is what I feel is happening… nothing is 100% certain.
As pointed out last week and this week, there are several different time cycles topping and bottoming at the same time and it will continue for another week. So this market will remain choppy. Locking in profits if you nail a move within a day or two is wise thing.
I hope this helps shed some light on trading and price spikes…?
Chris Vermeulen – US & Canadian ETF Swing Trading and Long Term Investing Signals www.TheGoldAndOilGuy.com
https://thegoldandoilguy.com/wp-content/uploads/2016/02/download.jpg163309adminhttp://www.thegoldandoilguy.com/wp-content/uploads/2014/11/tgaoglogo.pngadmin2016-02-24 20:06:392016-02-24 20:06:39How to Trade Price Spikes Part 1
When the next great financial crisis strikes, millions will be blindsided by what is coming and will be shocked by a “New Great Depression of The 21st Century”. This does not have to happen to you. It is empowering to know what is coming and to understand why it is coming. It is important to get prepared in advance for turbulent times. It is also imperative to have a plan for the years ahead. I will do my best to prepare you in advance for any eventuality.
This global financial drama is also part of the “incubation” effect of as part of the 2008-2015 time frame. There is a much larger financial crisis on the horizon. Decisions were made that seemed to resolve that crisis, but in actuality, probably only delayed it. The world is not in less debt due to the decisions of central bankers during that 7-year period. To the contrary, the nations of the world are in more debt and require a rise in inflation to help bring them out of this crisis. But will they be able to ignite the forces of inflation? The answer so far has been NO!
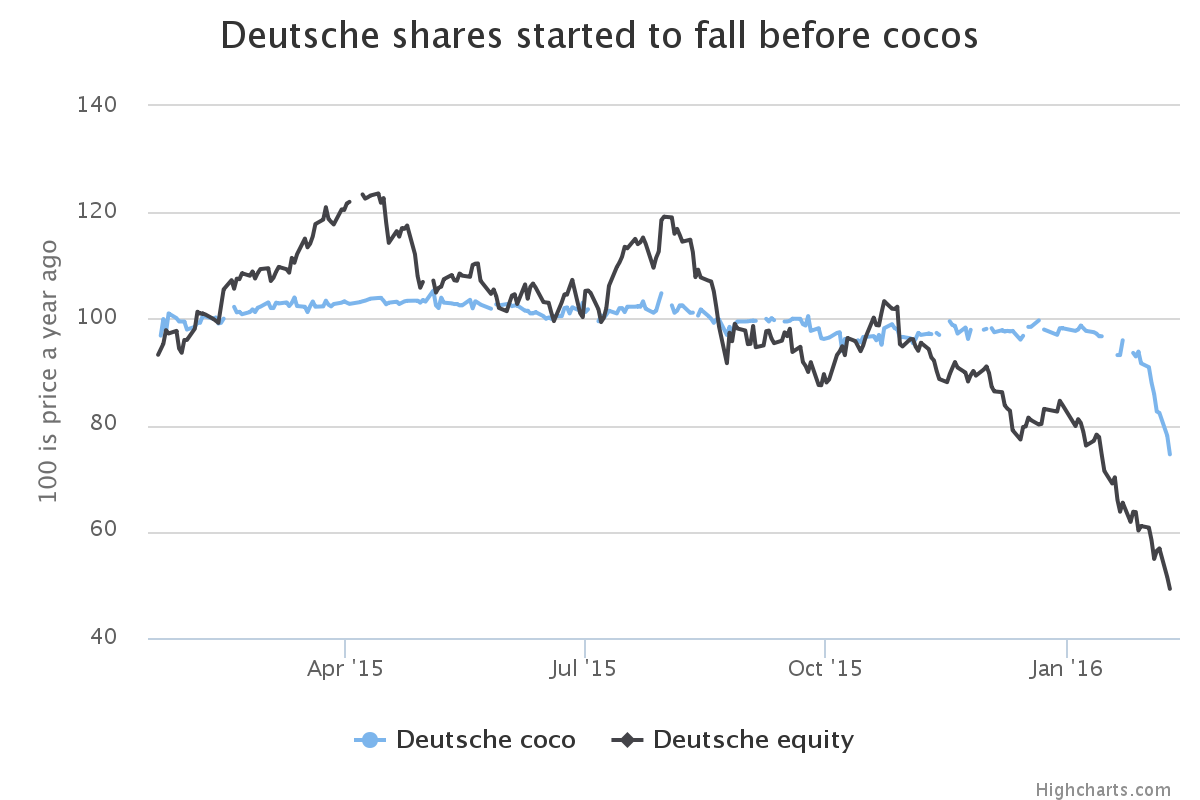
Considering the market condition, this could come at any time but, until it does, more patience is required. While the 7-year cycle is the principal force that is causing the market to build a top in this time frame, negative events are usually associated with large cyclical tops. One of these, which would be reported as a news item, will probably become the trigger which will activate selling. Could such an event be about Deutsche Bank, the new Lehman Brother’s crisis of 2016?
Deutsche Shares Compared to Cocos
There has been another new “financial toy” invented that rival’s derivatives. They are called “Contingent Convertible Bonds”, better known as ‘CoCos’. They were invented to help banks shore up their capital bases. They are bonds that are sold to investors as debt, but with a twist; if the bank gets into financial hot water, they can cancel interest payments, convert the bonds into equity or even write off the debts altogether. This could avoid problems associated with regular bonds leading to lawsuits and bailouts and maybe even a catastrophic collapse. With these banks holding all the cards I can inform you that CoCos investors will take it on the chin in this next financial meltdown before the bank becomes unviable.
The success of ‘CoCos’ hinges on the credibility of the banks’ assessment and reporting of their capital positions. Instead of bailing out the banks if they fail, coco investors will “bail in” the institutions that start to struggle, by allowing their holdings to lapse or transform into equity. These investors are encouraged to act as the banks’ safety net with higher interest payments.
In the UK, the Financial Conduct Authority has banned banks from selling these complex hybrid instruments to mass-market investors. The FCA has said the products are still too risky for most retail customers to stomach. “Issuers can have unusually broad discretion in relation to coupon payments”, making it extremely difficult for investors to assess, understand and price ‘CoCos’,
Confusion abounds in these markets. The cost of insuring against a Deutsche bond default, using products known as credit default swaps, has soared even though cocos are designed to prevent the credit default event that would trigger payment on this insurance.
‘CoCos’ issued by other European lenders have also plunged in value.
The Decline of Europe’s Bank Stocks
Deutsche Bank, whose ‘CoCos’ are now in the spotlight, had €2.87bn-worth of convertible bonds by the end of 2014. Some of its cocos are now trading at 77% of their face value.
It’s hard to know a bank’s true balance sheet, because most banks don’t disclose them. I know Deutsche Bank, which has been in the headlines recently, has a $2 trillion balance sheet. However, they have net tangible equity of $66 billion. That’s only 3.3% of their balance sheet. So they’re levered 30:1 in terms of net tangible equity.
No one knows what’s whirling around in that $2 trillion balance sheet. The bad assets the big banks had on their books haven’t simply disappeared. They’ve been unloaded into mutual funds and exchange-traded funds (ETFs). They’re also in nonbank financial institutions, like the new companies you see making auto loans by selling junk bonds as a form of capital.
Deutsche Bank headquarters in Frankfurt
This shiny, sexy building with the Deutsche logo just may become an old rust bucket…
Concluding Thoughts:
There are some huge events starting to unravel globally within the financial market place. While all these things do have a very negative and scary tone to them, if you understand what is taking place and position yourself to either avoid them or better yet profit from them then all of these issues are really not that bad for you.
Follow me as I explain these events as they unfold and how I will profit from them through my ETF trading newsletter.
https://thegoldandoilguy.com/wp-content/uploads/2015/11/det.png130185adminhttp://www.thegoldandoilguy.com/wp-content/uploads/2014/11/tgaoglogo.pngadmin2016-02-24 14:47:452016-02-24 14:47:45Next Banking Crisis Is Already Here – Opportunity!