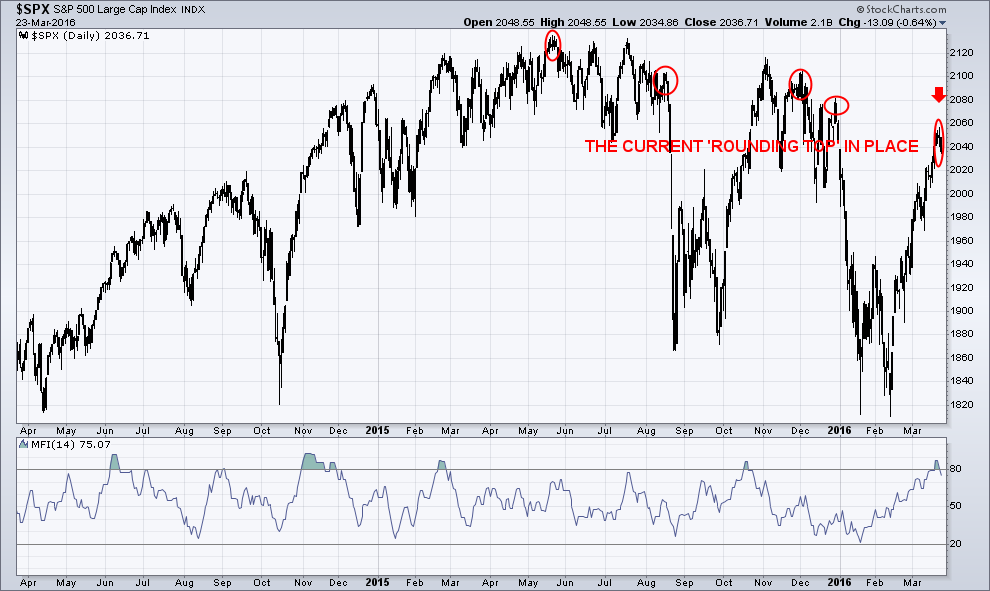
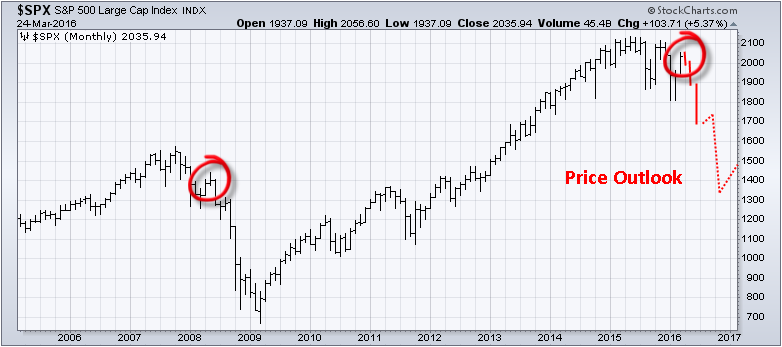
The SPX at the 2050 level looks like a great place for a ‘pullback’ to begin as indicated in the chart below. There is a potential “distribution topping phase” in which the SPX may pull back to 2000. I see a potential target at 1890.
The price has made a series of lower swing highs and lower swing lows since topping in 2015. There was a big August 2015 sell-off, followed by a rally to a lower high in November 2015, then a sell-off to a lower low in January 2016. The rally currently is still at a lower high than the November 2015 high.
Based on data, provided by Investor Intelligence, the bulls are up to 47.4% and the bears are down to 27.8%. This data has been collected from a survey of newsletter writers and investor advisors. This sentiment has changed very quickly and now points to an ‘exhaustion inflection point’ in the SPX. This is a rare and excess ‘swing’ of sentiment within a very brief period of time. It is reflecting that this move upwards is ‘unsustainable’!
A topping phase has now started, but know we could see slightly higher highs during this choppy process.
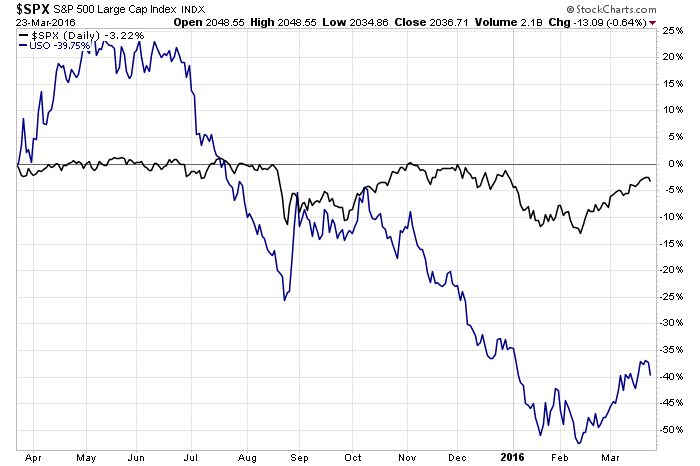
Crude Oil and SPX Comparison Chart:
As long as the WTI Oil does not rally, the SPX will continue its’ decline.
SPX and Oil Trading Conclusion:
I feel oil will hold up and bounce for a couple more weeks and help support the stock market. But once stocks lose their upward momentum and oil starts to fall again – look out below!
Find out when to buy and sell the key indexes, sectors and commodities with my ETF trade alert newsletter: www.TheGoldAndOilGuy.com
Chris Vermeulen
https://thegoldandoilguy.com/wp-content/uploads/2013/04/growthslidemain31.jpg4271130adminhttp://www.thegoldandoilguy.com/wp-content/uploads/2014/11/tgaoglogo.pngadmin2016-03-25 12:24:352016-03-25 12:24:35SPX & Oil at Critical Juncture
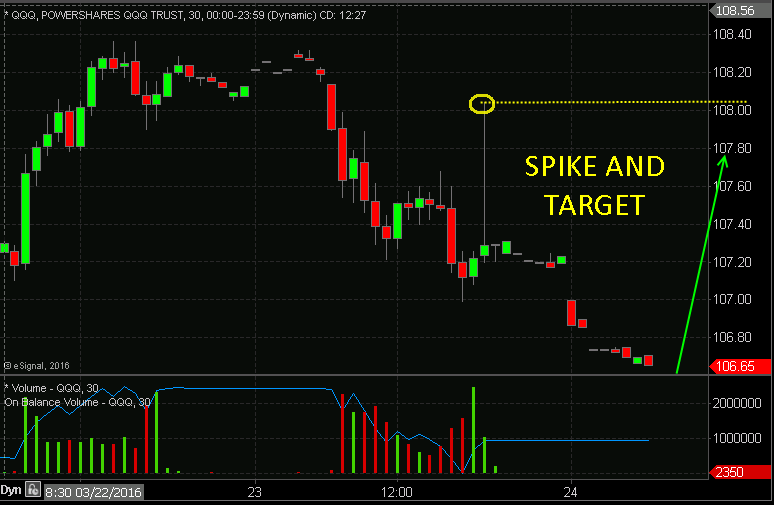
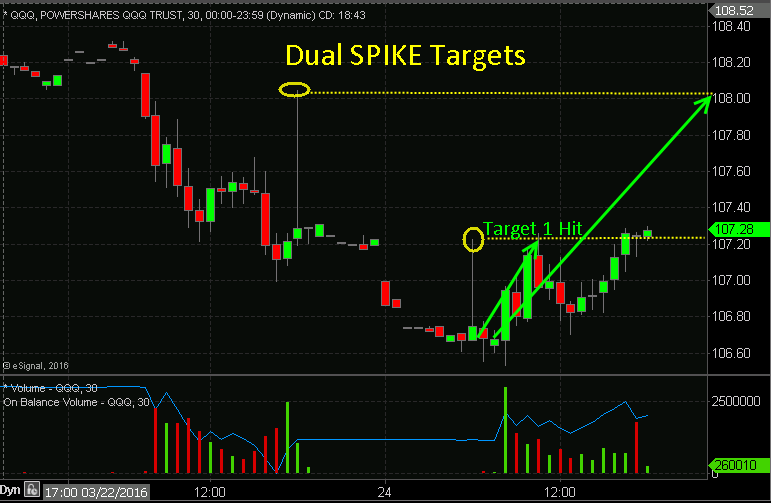
Today’s Price Spike and Target was Reached but there is still more upside potential!
Price Spikes are a very short-term trade setup that typically reach their targets withing 48 hours and in most cases within 24 hours. I have covered these on great detail a few weeks ago when we had a wave of these trade setups take place. If there is any price spike in QQQ, SPY, DIA or IWM we can expect all markets to move in that direction. So trade the index you are most comfortable with. You can learn more about price spikes: Click Here
Wednesday, March 23rd Post Market Spike and Target
Thursday, March 24th Pre-Market Spike & Target 1 Hit
https://thegoldandoilguy.com/wp-content/uploads/2016/02/spikemetal.jpg350350adminhttp://www.thegoldandoilguy.com/wp-content/uploads/2014/11/tgaoglogo.pngadmin2016-03-24 17:01:512016-03-24 17:07:22QQQ and SPY Price Spikes and Targets
GET THIS VIDEO FORECAST EVERY MORNING BEFORE THE MARKET OPENS – CLICK HERE
https://thegoldandoilguy.com/wp-content/uploads/2016/03/video-comuter.png258224adminhttp://www.thegoldandoilguy.com/wp-content/uploads/2014/11/tgaoglogo.pngadmin2016-03-24 05:24:412016-03-24 05:24:41Market Forecast Video You Must See
We have been experiencing an exceptionally strong ‘counter trend” rally in the stock market. This recent bullish upward move is not what everyone is thinking, in fact its the beginning of a new…
Global Central Banks have run out of ‘ammunition’. Since March 2008, Central Banks have cut interest rates 637 times and have purchased a staggering $12.3 trillion dollars’ worth of assets. There is not much more that they can do, and currently, the next ‘great crisis’ is upon us.
The global economy and the global financial system will continue to weaken before our very own eyes.
If we do experience a major “black swan event” that takes place, it will cause the bottom of the stock markets around the world to fall out, and this could happen at any given moment.
Chinese exports have seen their sharpest drop in almost seven years, adding to concerns over the health of the worlds’ second largest economy. Exports havedropped sharply by 25.4% from the previous year, while imports fell 13.8%. This weak data comes on the heels of Beijing registering their ‘ slowest economic growth in 25 years’.
The February 2016 trade figures reflected, are likely to raise new fears over China’s struggles to maintain economic growth, while implementing reforms and trying to shift towards more services and domestic spending. China was considered ‘the engine of global growth’.
The FED has been looking at the ‘illusion of recovery’, but not the real deal. If this were real, we would not have 100 million adult Americans without jobs. There are currently 46 million citizens on foods stamps as compared to 18 million that were in 2000. Thirty-five percent of the population is receiving some form of public assistance. For so many years, Global Central Banks have been manipulating the financial marketplace with their ‘monetary voodoo’. They have convinced investors, around the world, to invest trillions of dollars into equities; artificially inflating the ‘equity asset class’. By creating money out of ‘thin air’ and pumping it into the financial system it devalues currencies and creates an artificial sense of a true economic recovery which so far has not been realized.
A shock to the financial system and ‘contracting economic growth’ from abroad will force the FED to delay further short interest rate increases and furthermore, reverse their course. These ‘academic pinheads’ are so blinded by their tinker toy “Keynesians Macro-Model” that they cannot see the flashing red light warnings that are in front of them. Keynesian fiscal policies, which postulate that spending more of taxpayer money, that it would “stimulate” an ‘economic rebound’. IT FAILED!
Last week, Chairwoman Dr. Yellen, was forced to wave ‘a white flag’. The FED overestimated the strength of the global markets and consequently, will not be able to go ahead with its planned four short term interest rate hikes, in 2016.
This growing situation is going to result in the FED resuming ‘monetarizing public debt’. Dr. Yellen is now beginning to listen to the advice of, her predecessor, Dr. Bernanke, and is now potentially embracing negative interest rates.
Central Bankers Do Not Understand ‘Booms and Busts’:
Central Banks still do not understand the ‘boom and bust cycles’. Falling stock prices will shortly be in the news. Central Bankers still do not understand ‘deflation’, whether they are ‘Keynesians’ or some other variant, thereof.
The next ‘bubble’ that is yet to burst
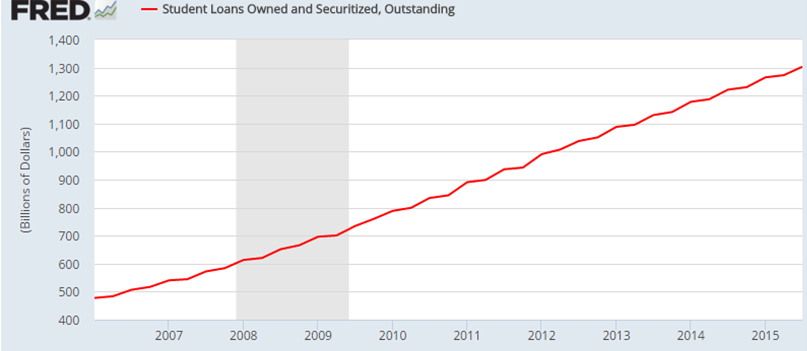
Student financial debt is out of control. Over $1.3 trillion in student debt is floating around in the current economic system. The majority of this debt is a burden to younger Americans, who are entering into a job market with incredibly low wages. Student financial loan delinquencies are rising dramatically. Student debt is now the worst performing sector of loans in our economy. This is yet another ‘bubble’ that is yet to burst. Momentum will catch up and the delinquencies will be the first cracks in the dam.
We now must embrace our own prosperity, our financial freedom and peace of mind in our daily lives. I accurately warned my past clients of the housing bust, the credit crisis and the ‘Great Recession’ more than one and a half years in advance.
It is now time to prepare for the inevitable. Gold has been used as money for more than 3,500 years while it doubles as a currency and a store of value. It has also proven to be a good hedge since the experiments with unbacked fiat money which began in Europe and the USA, in the 18th century have failed to store one’s value or wealth.
Gold is the purest form of ‘money’ and the oldest and most durable. The Gold Aurum Coin was already legal tender and the first coin to be ever used. The oldest gold coins are derived from the seventh century BC.
Investors use gold as a ‘store of value’ in their IRA or simply by holding physical bullion, which is explained in this gold investing guide. Gold metal offers the appearance of capital appreciation compared to devaluing currencies. Gold has always had favorable liquidity throughout history and will become more liquid in the coming years are more of the world turn to gold as a store of value, hedge on inflation, and insurance policy incase the financial systems does actually implode one day.
While I talk about gold in this article, it is not the only place to not only maintain your wealth and buying power. In fact, there are a couple of other assets and trades which I think can make more money in far less time for us traders and active investors. In the last two weeks subscribers and myself closed 4 ETF trades for a total of 19.1% in profits.
https://thegoldandoilguy.com/wp-content/uploads/2016/03/ADream.jpg457800adminhttp://www.thegoldandoilguy.com/wp-content/uploads/2014/11/tgaoglogo.pngadmin2016-03-22 10:44:172016-03-22 11:07:18The ‘Crisis’ Has Just Begun; Is The American Dream Is Over?
Recently, Light Crude has seen a dramatic 35%+ increase in value. As the current price continue to flirt with $40 per barrel, the likelihood of a further price rise is on everyone’s mind. With recent lows near $26 per barrel, what is the possibility that oil will form a base above $30 and attempt a rally?
Historically, the 2009 low price for oil was $33.20. This level should be viewed as a key level of support for current price action. The recent price rotation below this level is a sign that oil prices are under extreme pressure in the current economic environment with a supply glut and slower than expected demand.
It is my opinion that the price of oil will continue to reflect the supply/demand aspects of the global markets in relation to global economic activity. Thus, my analysis is that Oil will likely attempt to retest support, near $30 or below, in the immediate future in direct relation to continued supply production in conjunction with slower global demand.
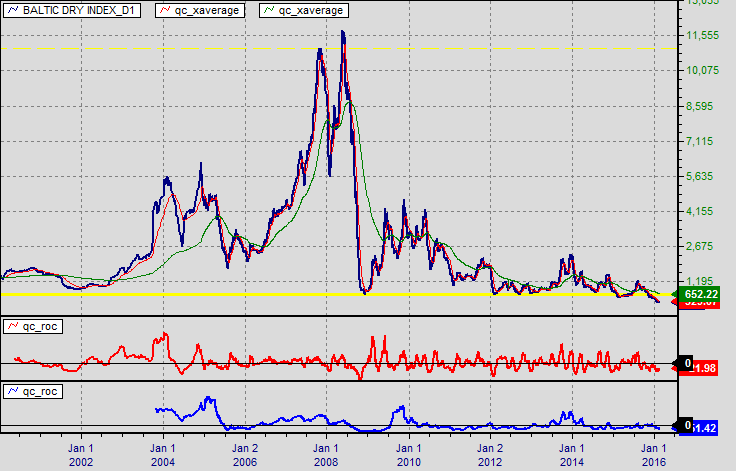
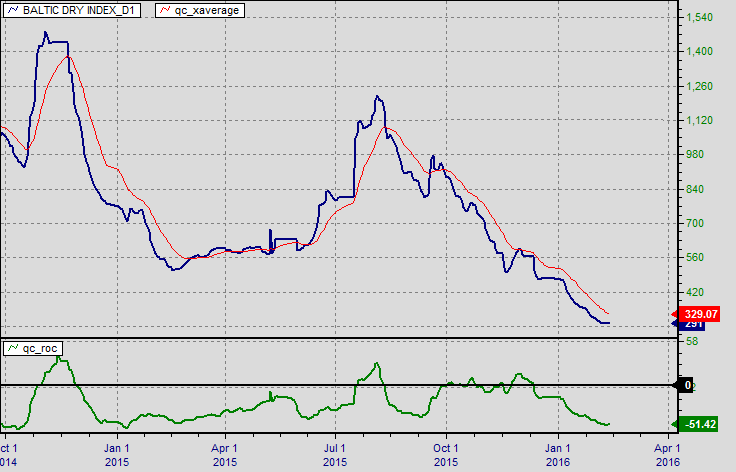
(Baltic Dry Index Chart – LongTerm)
The BDI Index continues to attempt to push to new lows. This is a strong indication that global exports and international demand from consumers and business is continuing to diminish.
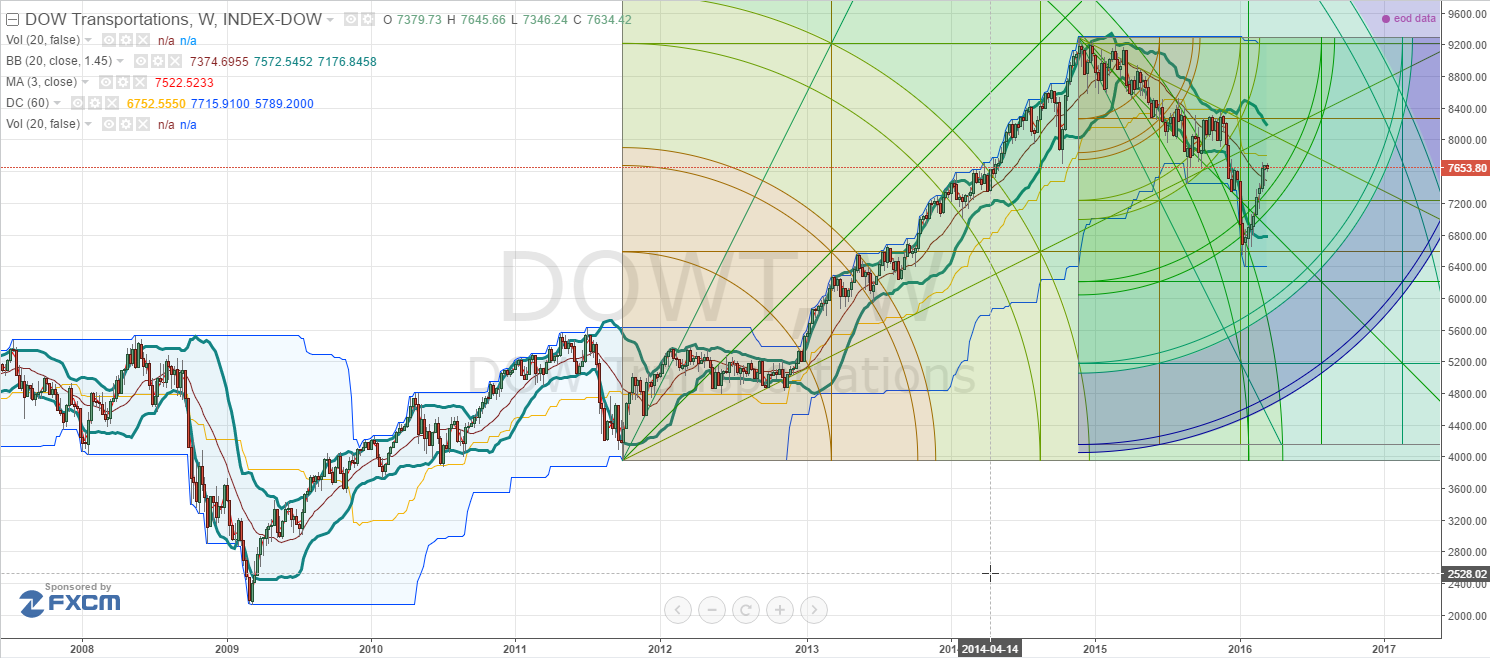
(DOWT – Transportation Chart)
Even though the DOW Transportation Index has risen recently, the current direction is decisively bearish in indicates the next level of support is near 6265 – clearly 1400 points below current levels.
(Baltic Dry Index Recent)
The longer the BDI continues to push to new lows, the more likely we are to see continued contraction in demand for commodities and global exports. Thus, with the continued supply production throughout the globe and continued global contraction, one could expect that Oil prices will continue to be under pressure globally.
The simple mechanics of the equation are that certain ME and foreign countries require continued income from oil production/sales. As the continued decline in Oil prices creates economic pressure, these countries have little alternative but to continue producing and selling as any price to feed their need for dollars. This creates a mechanism that propels a vicious cycle or over production and sales in an attempt to generate dollars that are desperately needs to fund a relatively mature economy.
As all things are in a constant state of flux, it become important to understand that price rotation in the Oil market will likely continue between $28 and $42 for a period of time. This is really a traders market in the sense that a nearly rotation level this large, in percentage relation, is available for all traders. Be cautious of rallies as they may be short-lived. I expect a number of weeks of rotation near $36 ppb followed by a lower price rotation back to near $25 ppb between April 5th and May 5th.
After that price rotation lower, then I expect one of two targets to be tested, $21 ppb or $37 ppb. It all depends on how the global markets are performing in a month or two.
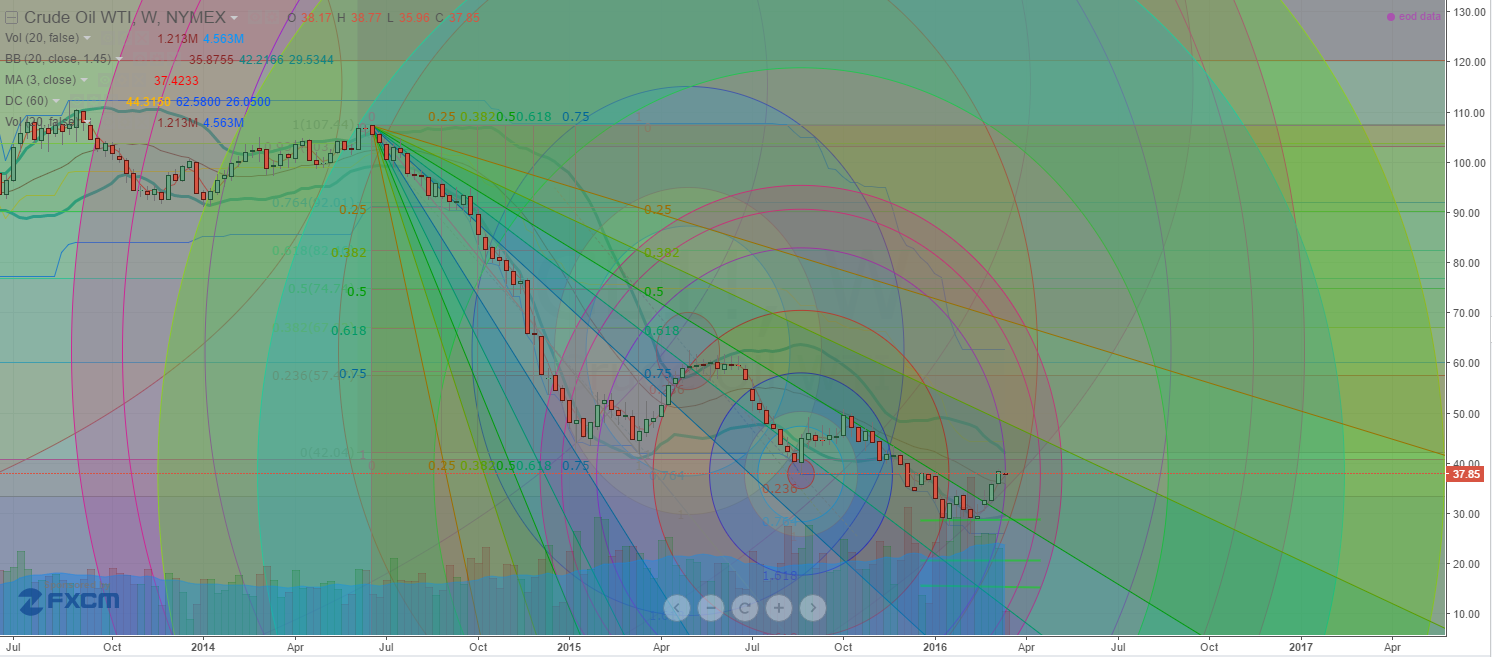
(CL Chart)
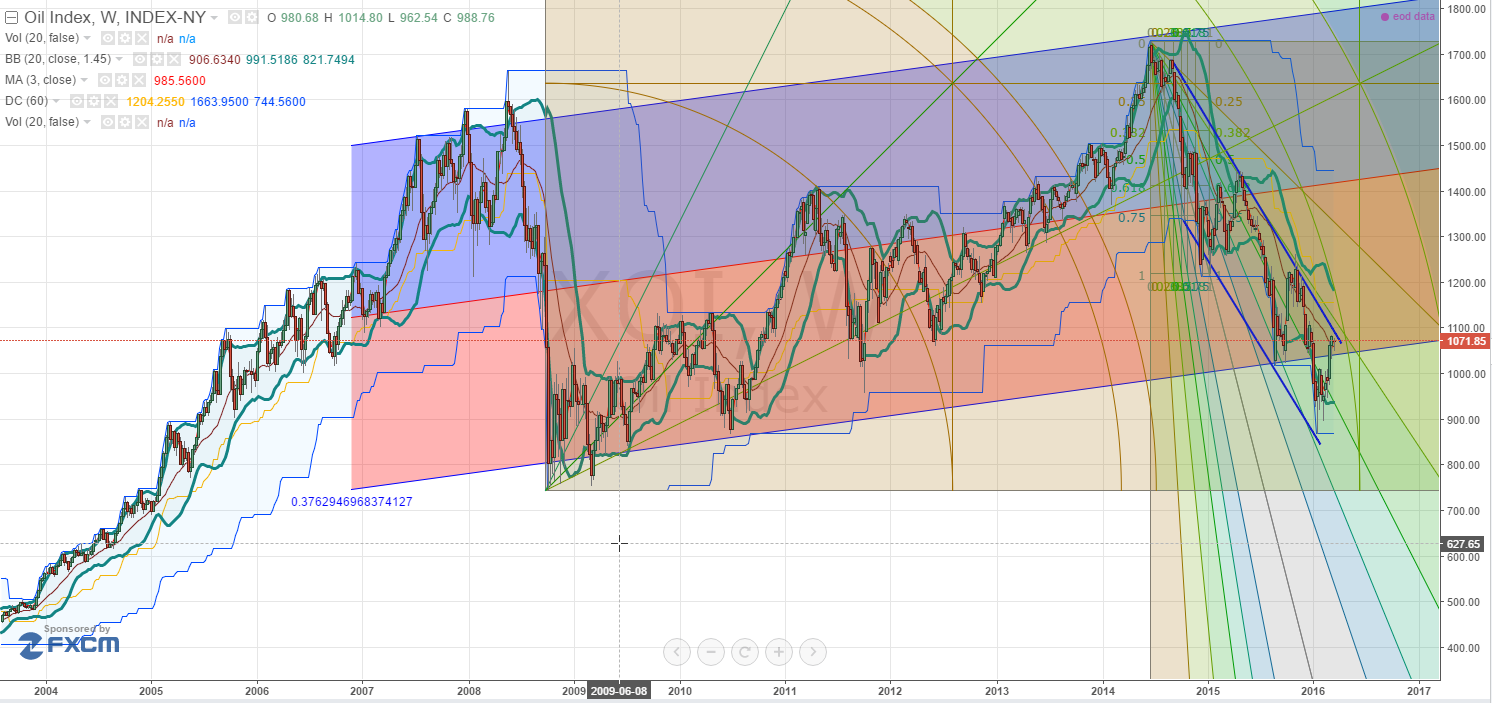
(XOI Chart)
Right now, expect continued price rotation between $42 ppb and $28 ppb till shortly after April 5th. Then expect much larger price rotation till after May 5th. At that point, we’ll have to see how the global economic factors are playing out to make further price expectations.
I expect there to be some big trades around crude oil for both short term swing trades and long term trend trades but the market just is not yet here.
The European Central Bank and the Bank of Japan have run out of “bullets” in their arsenal! They will continue to cut interest rates further ‘below zero’, but that is not taming the ‘Beast of ‘Deflation’. To the global community, it is evident that this is not continuing to prop up the stock markets any longer. How can they be expected to be trusted, anymore?
Take a look at the Bank of Japan which started QE in 2001…
https://thegoldandoilguy.com/wp-content/uploads/2016/03/eu.jpg99158adminhttp://www.thegoldandoilguy.com/wp-content/uploads/2014/11/tgaoglogo.pngadmin2016-03-19 13:01:452016-03-19 13:01:45Central Banks Are Attempting To Ward Off The Stock Market Crashes
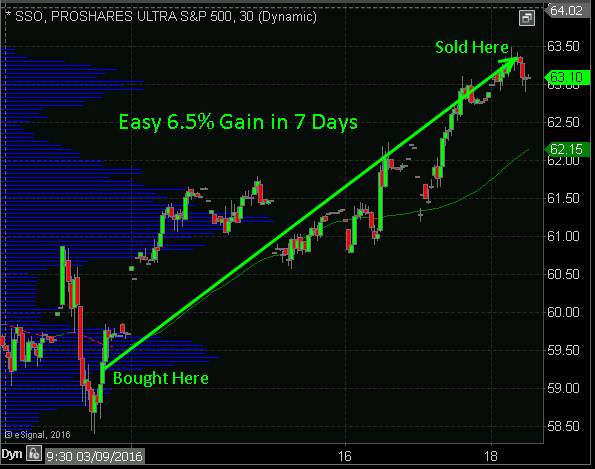
This week was one of those Set-It-And-Forget-It kind of time. If you recall the winning trades we closed, and the new SSO position we took on last week as seen and explained here, then you know we have been long SSO for the entire run up in price.
This Weeks Results:
Well, today (Friday March 18th) members and I closed
our SSO (Long S&P 500) position for an EASY 6.5% PROFIT THIS WEEK.
Last Weeks Results:
If you want to know with a high degree of accuracy where the market is headed each day, week and over the next month… and be able to spot extreme overbought and oversold levels to enter, short, take profits and tighten protective stops then I urge you to join my video newsletter and ETF trade alert service at www.TheGoldAndOilGuy.com
Have a great weekend everyone and thanks for all the great feedback!
That is what inspires me to keep pushing and sharing content!
Chris Vermeulen
https://thegoldandoilguy.com/wp-content/uploads/2016/03/winningtrade.jpg276429adminhttp://www.thegoldandoilguy.com/wp-content/uploads/2014/11/tgaoglogo.pngadmin2016-03-18 14:14:062016-03-18 14:14:06Another Profitable Week 6.5% Gain w/ One Trade
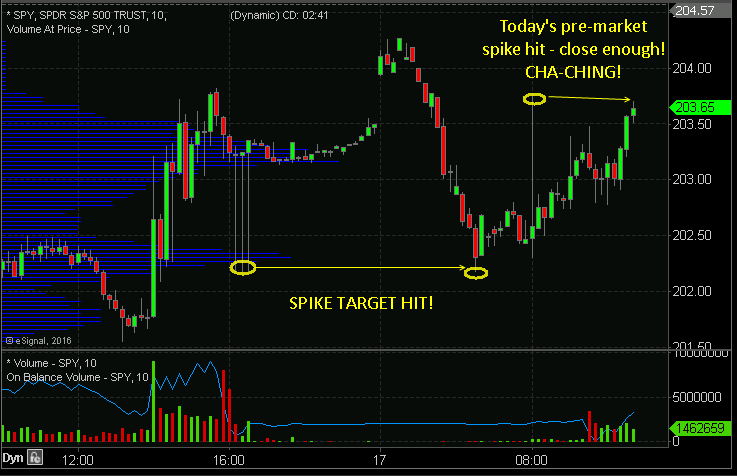
Subscribers last night after the close were shown the triple price spike down which was filled this morning… This is the SPY but this signal works for ANYTHING S&P 500 related…. ETFs, Futures, Options, Spread Betting, CFD’s…
Also, this morning member’s were alerted to the spike up today and that spike has filled more that 80% so another winner for those who actively trade these setups I provide within hours…
If You Want These Delivered To You Inbox Every Day Automatically SUBSCRIBE HERE
https://thegoldandoilguy.com/wp-content/uploads/2014/06/etf-trading-newsletter-alert.jpg121144adminhttp://www.thegoldandoilguy.com/wp-content/uploads/2014/11/tgaoglogo.pngadmin2016-03-17 10:55:262016-03-17 11:37:33These Just Dont Stop Making Money – Pure Awesomeness!
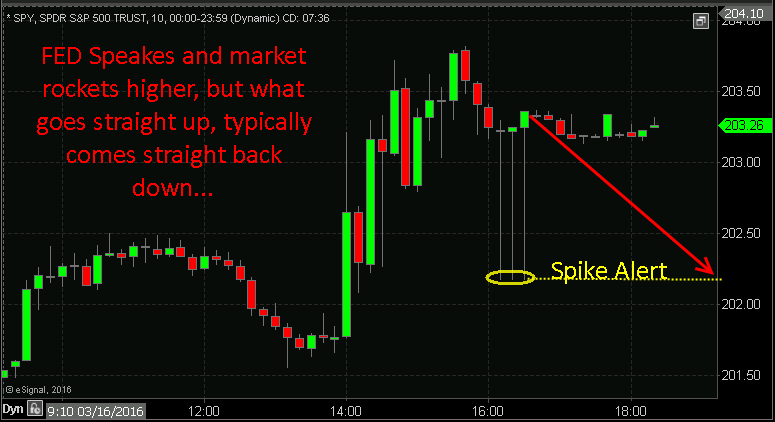
Fed spoke today and that triggered a feeding frenzy in the market sending everything higher – stocks, commodities, and bonds. Well almost everything, the US Dollar index took it on the chin and collapsed 1.08%.
See Spike & Target which should be expected to be filled within 48 hours.
SPX, Gold, and Oil Market Cycle Forecast
GET THIS DAILY FORECAST EVERY DAY BEFORE THE MARKET OPENS
https://thegoldandoilguy.com/wp-content/uploads/2015/11/global-trade-crash.jpg707943adminhttp://www.thegoldandoilguy.com/wp-content/uploads/2014/11/tgaoglogo.pngadmin2016-03-16 18:29:572016-03-16 22:17:02Price Spike In Post Market – Triple Whammy!