Once the majority of Americans have made up their mind and voted it will be almost impossible to change the direction of the outcome and change their minds. Unfortunately, the majority has voted and are in agreement with the next major event that will catch most people off guard. While this may sound bad and negative, I feel it is an opportunity of a lifetime.

You may be thinking I’m talking about who will be the next president but that is not it. Although the same theory applies to that as well.

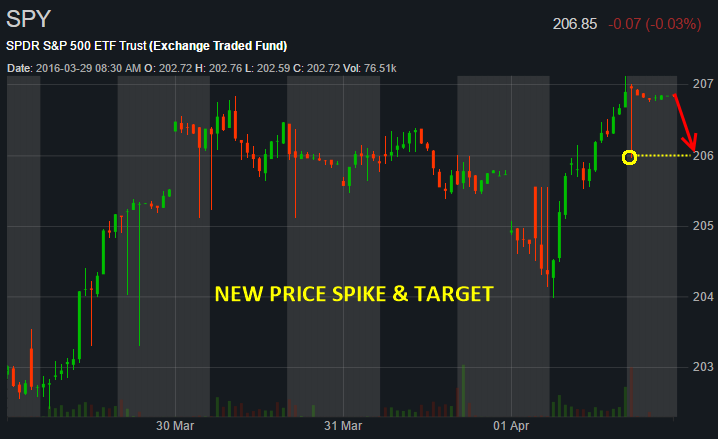
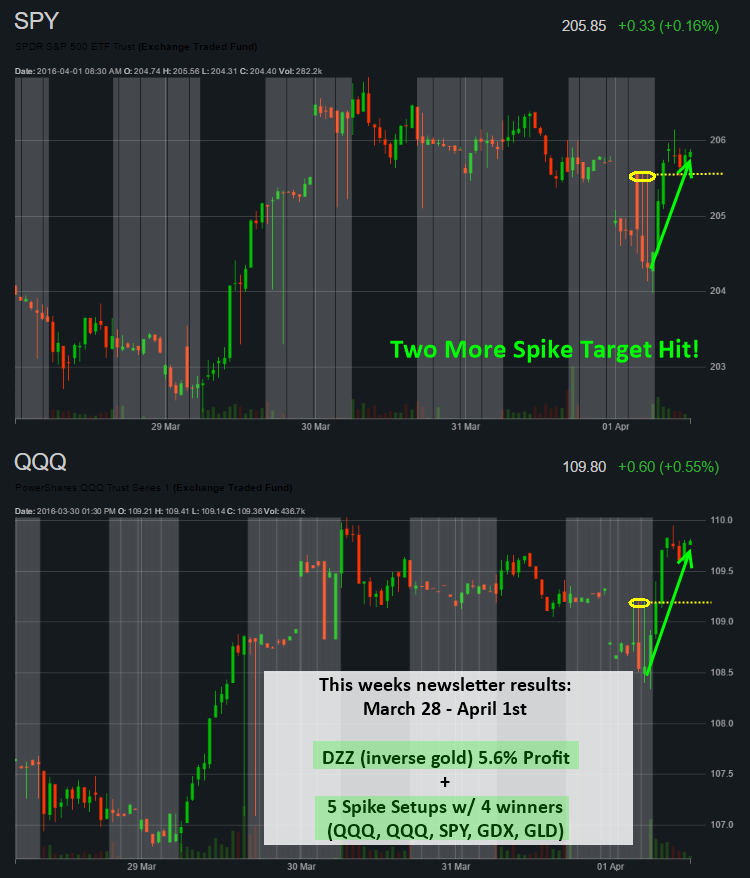
Hear me out because this is equally important in terms of your financial future. This video is a great example of how you can benefit from this next major event unfolding – Bear Market in US Stocks, continue reading to fully understand my reasoning.

How do you read these data points?
Everyone reads data very differently than each other and I think that is one of the reasons why I can navigate the market so well. I look at data and try to figure out who are the individual generating the data within the information presented. For example in this article, I want to show you how I perceive Google trends and what it’s telling us.

Typically traders look at mass market sentiment leaning in one direction to be a contrarian indicator. Meaning if everyone is bearish on the market then we are likely to see a new bull market start sooner than later. While I do agree with this theory/strategy you must take into account what type of data you are using in order to come to that conclusion.

To me, there is a big difference between the average investor being bearish on the market which we typically see right at the end of a bear market when trillions have been lost because of falling stock prices. But, compared to those who are searching the keyword phrase in Google “bear market” at any given time I look at it as a leading indicator.

You see, I think people searching on Google for specific topics specifically ”bear market” are not the average Joe investor who does nothing but ride the emotional and account value roller coaster as markets fluctuate and don’t even know what a bear market is or even think to search it.

Instead, I feel those searching Google are the educated and active investors and trader who are the ones who create market trends and significant turning points in the market. These are people being proactive learning and adjusting their portfolios to avoid losing money and/or to profit generously during market downturns just as I do.


Stocks Are In A Bull Market When Google Tend Looks Like This:

The graph below shows different shades of blue. The lighter blue colors mean fewer searches for the term “bear market”. This is when the educated traders are bullish on the market and continually buying more shares, thus supporting the market trend. The dark shaded states are where specific regions of people are more bearish than the rest of the states. When the chart looks like this (light blue) we expect higher prices in the stock market.
trends1


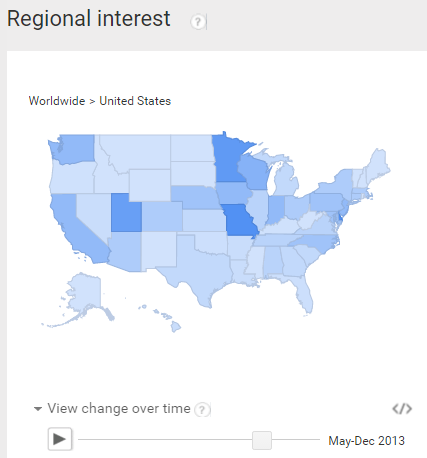
Stocks ENTERING A NEW BEAR MARKET If Google Tend Looks Like This:

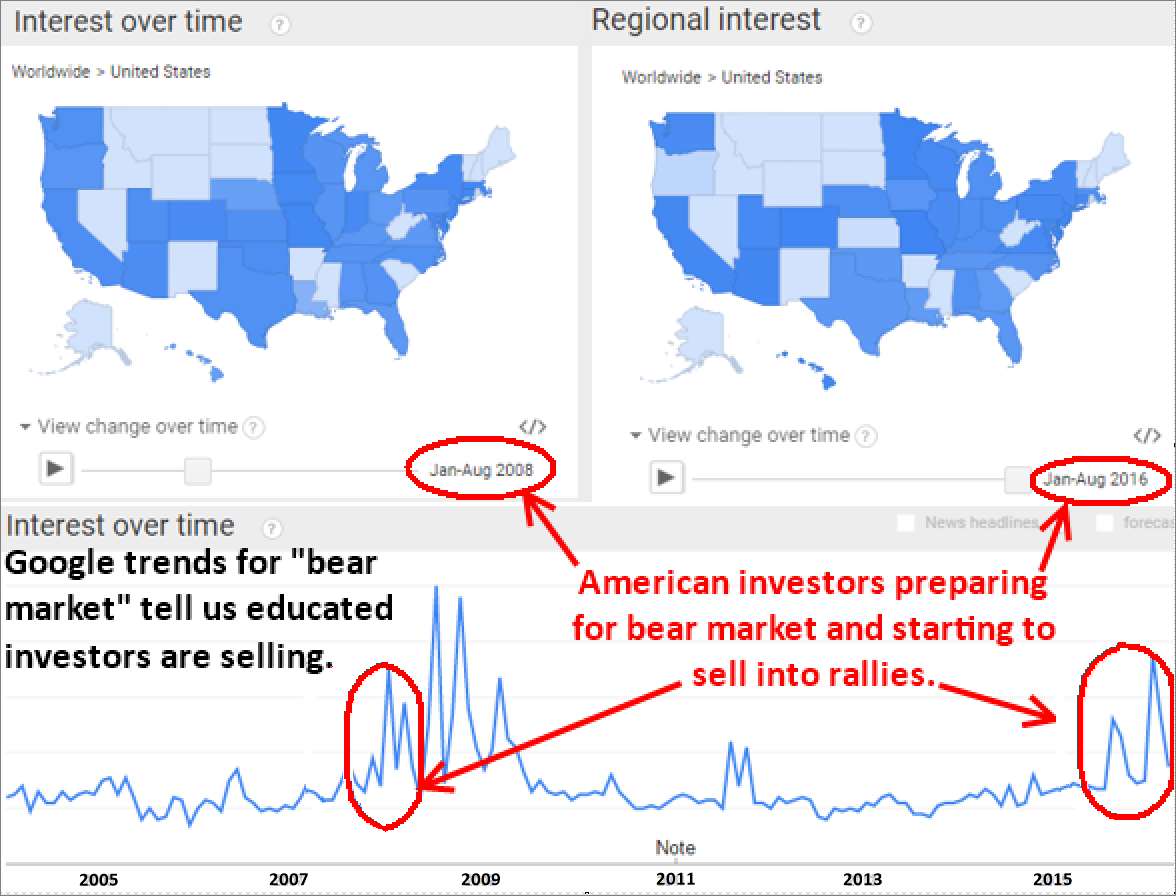
Take a look at the two charts and graphs below. Both of these look very similar to each other. The one on the left shows us what the educated investor was thinking and doing with their money just before the bear market of 2008 and the final washout low in 2009.

Now, if you look at today’s Google trend which is the image of the US on the right-hand side you will see both look very similar to each other. To add more depth to this analysis if we were to compare the market breadth and internals for the US stock market they are also very similar in nature. Both of these types of analysis combined paint a clear bearish picture for stocks looking forward 6 to 12 months from now.

Just look how much darker blue both of these charts are compared to that during a bull market when investors are putting new money into stocks, which is the first graph explained above.

Now let’s look at the bottom of this image where you see the interest over time line chart for the number of searches on “bear market ”in the USA. From what this data is telling us, we are days or weeks away from a significant market top in stocks and the start of something that will wipe-out most individuals life savings once again… This will be my third time experiencing this type of event as a trader – 2001 tech crash, 2008 financial crisis, and now the 2016 economic crash.

 google-trends2


Concluding Thoughts:

In short, I feel the US stock market specifically the large-cap stocks are going to provide a huge opportunity for investors who understand what is happening and how to take advantage of it.

Google has provided us with some excellent information to help identify and time major market turning points for long-term investors and short-term active traders like you and me.

In 2008, we had a very similar situation set up in the market and I was able to generate life-changing returns from these moves, I should note there are two major plays here, not just one.

These incredible trade setups are a once in a decade opportunity and more money can be made during some of the roughest times in the stock market and economy if you know which simple trades to place and when to buy and sell.

Learn more at my ETF Trading Newsletter Website

Chris Vermeulen

On Friday, April 2nd right after the stock market closed the charts flashed us another set of trade signals – SPIKE ALERTS

If you have been following my analysis the past month or two then you are well aware of just how accurate and profitable these simple Spike Trades can be within 12 – 48 hours.

Last week the market gave us 4 spike targets with three of them being winners in less than 36 hours. Also, we took advantage of gold shorting it just after the FED induced rally. We pocketed a quick 5.6% gain in just two days with that play also.

Anyways, below are the two spike trade setup for Monday showing where price is likely to move. This type of trade setup is perfect for day traders and momentum trader looking to squeeze a little more out of the market each week. I am working to automate these spike signals and potentially an automated trading system to execute them for us also.

spyspike

gdxpike

If you want to know where the market is headed each day and week, well in advance then be sure to join my Pre-Market Video Forecasting service which is: www.TheGoldAndOilGuy.com

Chris Vermeulen

The rise of the ‘dollar store business model’ caters to a disappearing ‘middle class’ who are incurring shrinking incomes. This has made ‘dollar stores’ prosper, in the last decade. Dollar stores, for most Americans, have carried an odd sort of stigma.  In the past, these stores were seen as shopping for the poor, only.  We are all now aware that many people who were in the once strong American ‘middle class’ were thrown off of the prosperity path and into ‘lower income’ brackets from business layoffs, downsizing, and salary reduction.  While regular product companies struggle the expanding ‘dollar stores’ have found a niche in this economic climate.  The shrinking ‘middle class’ means more customers for ‘dollar stores’.

 A big part of the ‘new recovery’ is lining up at midnight at Wal-Mart stores in order to purchase food. There are families not able to feed their families by the end of the month. They are literally lining up at midnight at Wal-Mart stores, waiting to buy food along with their Electronic Benefit Transfer (EBT) Cards when their funds are deposited into their accounts.

EBT cards are an electronic system that allows state welfare departments to issue benefits via magnetically encoded payment cards, used in the United States. The average monthly EBT payout is $125.00 per person!

Common benefits provided (in the United States) via EBT, are typically of two general categories: food and cash benefits. Food benefits are federally authorized benefits that can be used only to purchase food and non-alcoholic beverages. Food benefits are distributed through the Supplemental Nutrition Assistance Program (SNAP), formerly the Food Stamp Program. Cash benefits include state general assistance, Temporary Assistance for Needy Families (TANF) benefits, and refugee benefits.

 There appears to be a ‘growing great divide’ within the current U.S. economy.  The financial sector is swimming in their ‘bailout-induced profits’. Within their elite circles, it appears as if the ‘recession’ is over.

However, within the average American family, they are not experiencing available access to new credit cards, equity in their homes is vanishing and they do not have a store of available capital they can access like a ‘stock portfolio’.

The table below clearly shows the middle class making less money year after year while the wealthy earn more each year. The money is slowly shifting from everyone to just the one-percenters – YIKES

middleclass


Conclusion:

In short, the average American is slowly earning less and becoming financially stressed about their future outlook.

If you are one of these hard working individuals experiencing a decline in business/income its best you do some research and change what you are doing because things will likely get much worse before they get better.

Mainly because of Trump thousands of Americans are looking to leave the country with the search term “How to Move to Canada” up over 1000% last month. While I love Canada, myself being a Canadian and all, there are many other great places to live and a very full life at a fraction the cost of Canada/USA.

Couple years ago I went to the DR (Dominican Republic) to see if it would work for my family in the winters to escape the cold and be surrounded in palm trees, ocean and kitesurfing. It was an awesome experience with a huge amount of development, tons of Canadians, retirees, and elegant vacation properties available at Holden Sotheby’s.

There are many ways to preserve capital and also ways to grow it substantially no matter what the economy does and I share this information in the video on the home page of my Trading Newsletter Website.

See how we made money in the last 5 days trading – Click Here

Chris Vermeulen

Good afternoon,

I just wanted to touch base before the week comes to an end.

Overall I think it was a fantastic week in terms of providing real-time analysis that unfolded exactly as out analysis predicted a with Fed news and employment numbers. This was an extremely difficult week to trade and was coasted through it and made money without breaking a sweat – well those tho watch my videos that is…

The cycle analysis I share with you is something I have learned and been working on for over 15 years and I’m still trying to improve on it. As you can see it got our money positioned perfectly in the SP500 a few weeks back, and more recently this gold trade. We got positioned, the market moved and we locked in money within the first 48 hours. I know, based on all the emails I get and how everyone words them that most traders shorted gold, bought dust weeks ago and just kept holding onto the positions praying for the market to drop. That was a wild ride both for your capital P/L statement and your emotions. All that can be avoided (in most cases) if you understand cycles or know where the market is in terms of these key cycles that I provide you with.

The less time your money is in the market the better. I would much rather make a 5.6% profit in 48 hours than hold onto an ETF for 2+ weeks to make that same amount.

Here is a quick summary this week’s performance and this morning Spike targets being hit yet again!

goldt1
spikeswrapup

Anyways, thank you all for the kind words and for everyone cutting back on sending me emails.

Chris Vermeulen

Here are my charts of GDX and GLD during pre-market trading today (Thursday, March 31st). I sent this chart to my followers alerting them of today’s market bias and intraday trade setup.

If you don’t know what spike alerts are, let me explain briefly. In short, the market gives of these rogue price spikes which only some data feeds catch and share. On top of that, some data feeds filter their data depending on the chart timeframe you are loading and will only use the AVERAGE price and not every tick to create the price bar on the chart.

Meaning, even if your charting platform and data feeds don’t filter our these rogue price spikes (which most do filter these out), then you may only see these price spike with specific chart time frames like the 30-minute or a 10-minute chart. It varies from day to day and when the rogue spike happens.

Bottom line, if you see these spikes, 80% of the time we see the price spike target reached within 36-48 hours.

TODAYS PRE-MARKET SPIKE ALERT:

This shows you the spike and gap windows on the chart. Typically Gaps get filled so when a spike matched that gap I fall in love with the setup that much more 🙂

spikengap


END OF DAY TRADING RESULTS – TAKE A LOOK

spikedual


TRADING CONCLUSION:

In short, while today’s moves were no huge by any means total about 60 cents per share, in many cased these spikes provide $1-$3 per share profit and if you are active trader with 500 or 1000 share lots making some decent spending money 🙂

The last thing, I will be adding an update feature to the members area where these price spikes for SPY, QQQ, GDX, and GLD are tracked and members will receive email alerts for pre and post market hours when they occur which is going to be awesome! I excited as it will save me all the chart surfing and jumping time frames to find these trade.

Cheers and happy trading!

Chris Vermeulen – www.TheGoldAndOilGuy.com

I envision reasons to be ‘extremely’ cautious within the short-term (approximately, 5 to 15 days). Gold is now close to its’ resistance, which will make further ‘upside’ progress very difficult to achieve, at this point.  It is now registering its’ sixth week in ‘overbought territory’.  Finally, coming from an ‘overbought’ area, any ‘rolling over’ to the downside may prove to be significant.

READ FULL ARTICLE & GOLD FORECAST: CLICK HERE

Tonight as I was going over my charts and running my end of analysis the charts jumped out at me with a trade setup and wanted to share my cycle chart for gold with you.

The price chart of gold below is exactly what my cycle analysis told us to look for last week WELL ahead of the today’s news and its things play out I as I feel they will then we stand to make some pretty good money as gold falls in value during the month of April.

If you have been following my work for any length of time then you know big price movements in the market like today (Tuesday, March 29th) based around the FED news ARE NOT and SHOULD NOT be of any surprise.

In fact, this charts told use about today’s pop 2 weeks ago and we have been waiting for it ever since. The news is simply the best way to get the masses on board with market moves and gets them on the wrong side of the market before it makes a big move in the other direction, most times… not always, though.

Take a look at this chart below. You’ll see two cycle indicators, one pink and one blue. The pink cycle line is a cluster of various cycles blended together which allows us to view the overall market trend of biased looking forward 5 – 30 days.

The blue cycle line is a cluster of much shorter time frame cycles in this tells us when we should expect strong moves in the same direction of the pink cycles or countertrend pullbacks within the trend.

One quick point to note with cycle trading is that the height and depth of the cycle does not mean the price will rise or fall to those levels, it simply tells us if the market has an upward or downward bias.

The current cycle analysis for gold along with the current price is telling us that today the short term cycle topped which is the blue line and our main trend cycle is already heading lower. The odds favor gold should roll over and make new multi-month Lows in August.

gold-collapse


Gold Trading Conclusion:

In short, we have been waiting for gold to have a technical breakdown and to retrace back up into a short-term overbought condition. Today Tuesday, March 29 it looks as though we finally have the setup.

Over the next 5 to 15 days I expect gold to drop along with silver and gold stocks. There are many ways to play this through inverse exchange traded funds or short selling gold, silver or gold stocks.

This year and 2017 I believe are going to be incredible years for both traders and investors. If treated correctly, it can be a life-changing experience financially for some individuals.

Join my pre-market video newsletter and start your day with a hot cup of coffee and my market forecast video: www.TheGoldAndOilGuy.com  

Chris Vermeulen

Stock markets rebounded solidly from their lows of February 11th, 2016, making new multi-month highs, earlier last week. The SPX rescinded 0.7% by the end of last week. These market gains can be attributed to the very bullish decisions of the European Central Bank (ECB) and the FED Central Banks.  On March 10th, 2016, the ECB surprised the financial world by announcing a much stronger than expected stimulus package. One week later, the FED announced that it would not raise its’ short-term interest rates. It was only three months earlier, back in December of 2015, that they suggested that they would raise rates four times in 2016. It is now my belief, that they will not raise short- term interest ‘materially’ in 2016.

Most broad-based indexes are now trading flat thus far in 2016, as range-bound conditions persist.  FED members will be speaking during the course of this week, including FED Chairwoman Dr. Yellen who will speak, tomorrow morning, Tuesday, March 29th, 2016, to discuss the next move of this unprecedented intervention.

The change of attitude is due to the fact that the global economy is so weak that Central Bankers fear a ‘market crash’. Obviously, they want economic growth. They want inflation, but, so far that has not materialized. They have had the power and independence, in these past seven years to do so, but we are still spiraling towards ‘deflation’.  What they have achieved was ‘Asset Inflation’ and ‘Earning Inflation’. We will see and feel the effect of such ‘excessive monetary stimulus’ induced by the Central Banks, very shortly.

The charts of stock markets are still long- term bearish (refer to the charts below) and are currently approaching a critical juncture!  This is a location that we could see a very short -term bounce, but I am not interested in taking any long positions. The markets could still push a bit higher. In April 2016, global stocks will enter their annual period of negative seasonality along with its’ bearish technical internals. I am waiting for confirmation of the top being in place, in order to finally recommend Inverse ETFs.

Overall, this is just the beginning of the major SPX turn.  We are currently at an ‘ideal resistance’ area. The SPX is currently in a downward channel. The momentum oscillators are extremely overbought and are now trending downwards. They need to cycle back down. Volume is declining with higher prices and that is a sign of weakness.  I will keep monitoring this new major event which continues to slowly unfold.

The U.S Dollar has moved up in the past few days. This is placing pressure on gold, silver and crude oil.  The retracement of gold and silver is now in the process, as I have been discussing over the past few weeks. We are heading even lower for a fantastic long term entry.

sp[x28a

spx28b


Stock Market & Crude Oil Relationship

The recent month long rally in stocks which started early in February was given a lot of upside momentum from the rising price in crude oil. But when oil stalls, tops and starts another decline expect the stock market to fall fast and hard.

oilspx28


Market Tops: S&P 500 and Crude Oil Conclusion:

In short, the stock market and crude oil prices have posted some serious gains in the past month. But both are not showing signs of weakness in terms of price action, buying volume, and cycle analysis.

We may see stocks and oil hold up and possibly make minor new highs over the next five to ten sessions but it’s going to be a struggle (choppy market) before we likely see the next market selloff.

Time The Market Using Inverse and Leveraged ETF’s: www.TheGoldAndOilGuy.com

Chris Vermeulen


China’s stock market ‘bubble’ was fueled by “speculative mania” which has proven to have had grave implications of the global stock markets. The collapse of this “speculative mania” will have far-reaching ramifications on…

READ FULL ARTICLE HERE