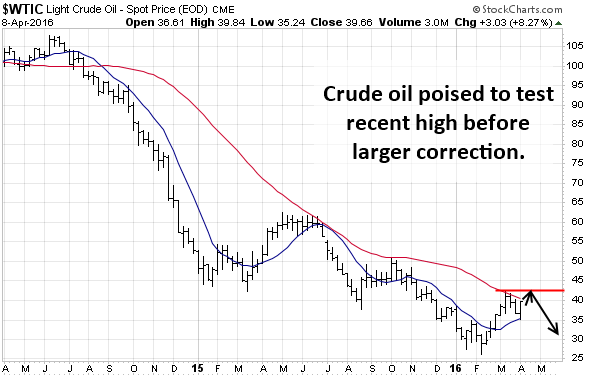
Over the past few week, we have seen the price of crude oil pullback from its recent high of $42 per barrel level. Last week April 4-8th the price of crude oil pulled back to a technical support zone and then posted a strong gain closing the weekly chart at the high.
Based on short-term technical indicators, along with the current momentum which crude oil has, I feel we will see the recent highs of $42 a barrel tested once again.
So what does this mean for energy stocks in the stock market as a whole? Well, if things unfold this week as I expect they will then we should see oil rise along with, energy stocks, and the S&P 500 index.
Take a look at the chart of crude oil below:
This weekly chart of oil shows what I expect will happen over the next one to three weeks, a bounce in price.
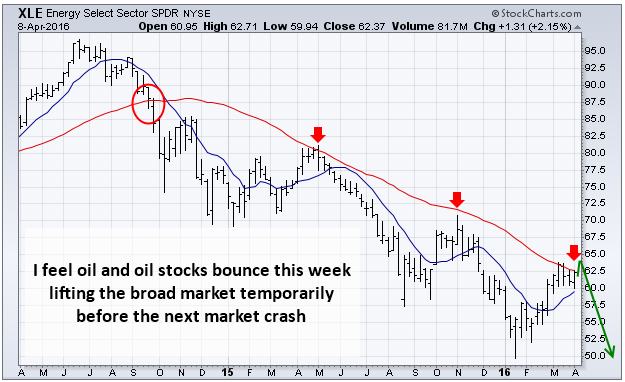
XLE Energy Sector Index Fund:
Energy stocks of had a strong rally since the lows earlier this year. But as you can see from the chart and basic technical analysis the price is now running into resistance at the moving average.
The moving average has acted as resistance for price and price is currently struggling at that level once again. I wouldn’t be surprised though to see the XLE fund push higher one last time testing the recent highs from last month before it tops and starting another large correction.
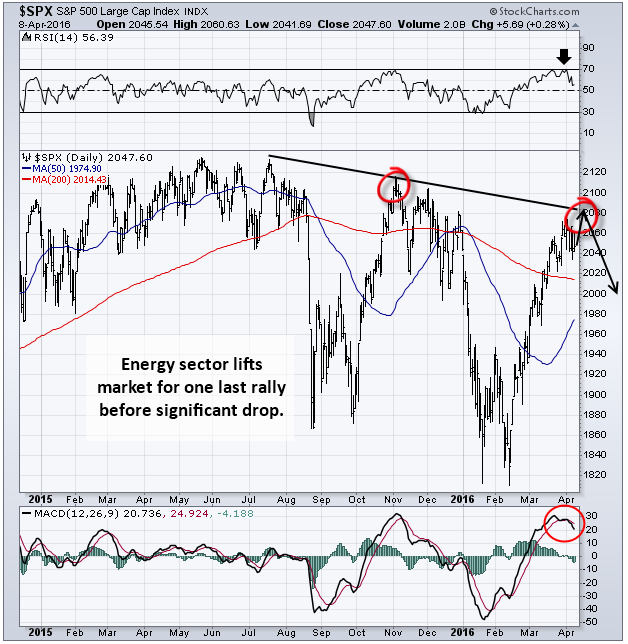
The US stock market:
While the US stock market has posted strong gains since the January low, I feel this rally is going to come to an abrupt stop this month or in May.
If oil and energy stocks continue to move higher than we should see the stock market follow suit and for the S&P 500 to rally one last time up into a resistance zone before the next big wave of sellers step back into the market.
Energy & Stock Market Conclusion:
In short, I feel the US large-cap stocks are setting up for an epic drop in price. My technical analysis and cycle analysis are lining up very similar to what I saw during the 2000-2001 market top and the 2007 – 2008 market top. Investors should expect a 35% to 50% market correction over the next 12+ months.
With that said, the next few weeks will become very difficult to trade simply because the market is starting to get choppy with wild intraday price swings. This is because the average market participants are becoming more bullish than ever on stocks again while the large institutions are starting to distribute huge amounts of shares to these undereducated investors who don’t know technical analysis and stock market cycles.
My current mindset has been to go into the markets for as little as 48 hours and then exit with a nice handsome profit using a strategy known as Price Spikes. This has worked out very well this year capturing very quick profits from these special “price spikes’. It’s a simple “Get-In & Get-Out” strategy for highly volatile markets.
Good times are coming for us active traders and investors so buckle up!
If you would like to know when to buy and sell as a short-term trader or long-term investor using ETF’s and join me at www.TheGoldAndOilGuy.com
Chris Vermeulen
https://thegoldandoilguy.com/wp-content/uploads/2013/04/oilslide23.png4341128adminhttp://www.thegoldandoilguy.com/wp-content/uploads/2014/11/tgaoglogo.pngadmin2016-04-11 12:46:182016-04-11 12:46:18Energy Sector Set To Save the Stock Market
The current amount The U.S. Government owes is over $19 trillion and therefore it is mathematically impossible to pay back. They will never be able to pay this back. Central bankers are in uncharted waters. They do not know how to create economic growth and fight deflation in some areas of the market. They do not know how to even return to a time of “normal” monetary policy. Their pretense of knowledge, of being able to effectively control currencies used by billions of people, is coming to an end.
The amount of debt only continues to grow and people think that somehow, governments are beyond the laws of mathematics. Things are fine until they are not. This is not an issue that will just go away or disappear, but rather continue to build until it reaches a breaking point.
Labor Force Participation:
We have close to 10’s of millions of Americans that are flat out not part of the labor force (not including children). The argument that this is only being made up of recent retirees is not true. First, many cannot retire because they need to work until they die. Another point is the rate is going up much faster than the number of people hitting old age.
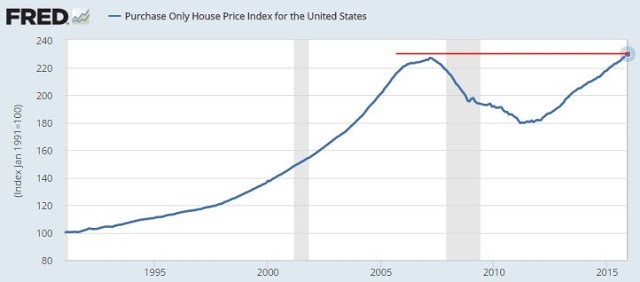
Homeownership:
The homeownership rate has fully collapsed. Since the Great Recession hit, a large part of buying came from Wall Street and institutional investors. They bought homes to convert into rentals since this was how they used their bailout savior money. The money kept them afloat and what do they do? Buy up homes in a tight market and drive prices higher when working Americans already have declining incomes. The net result is that fewer people/families own their property and owning your home has always been traditionally viewed as the American dream. This has been the one vehicle where most Americans build wealth and equity and it’s not happening at nearly the same rate as it one was.
The problem is that people do not have $20,000 or $30,000 to make a down payment. I see a smaller number of Americans making their home the ultimate financial goal which is a good thing. It forces saving via having equity in their home. Let’s face it, you don’t hear all the retired and wealthy people saying they made their big money in a retirement account. In almost every case they earned their wealth through real estate investments in their own home and/or rental properties over time.
There are currently signs of another new housing bubble emerging. The current home price data shows that across the country we have now surpassed the last bubble peak. Incomes are not keeping up with wild movements in home prices. The end result is that the work force incomes are decreasing so creative financing is necessary to buy more expensive homes.
Homes homeownership rate has collapsed because of the higher priced housing market. How can prices go up with fewer families buying homes? Easy, since the bailout funds allowed banks, hedge funds, and investors to pick up foreclosed homes from families and then turned them into rental income properties. Today, we have many more people living in rental apartment and rental homes accumulating no equity and barely scraping by. Yet somehow housing prices soaring, college tuition at crazy levels, all while we have lower incomes. The current model of the American Dream involves no homeownership for the already shrinking middle class.
The upper-income, educated, married with children class are still not buying!
A strong middle class has been at the core of what has been promoted as the American Dream. How would America look like if the middle class simply vanished? We may not need to wait too long at the current rate since we are quickly siphoning people off the middle class and throwing them into lower Income brackets. The vast majority of Americans do not buy into the propaganda promoted on the mainstream media.
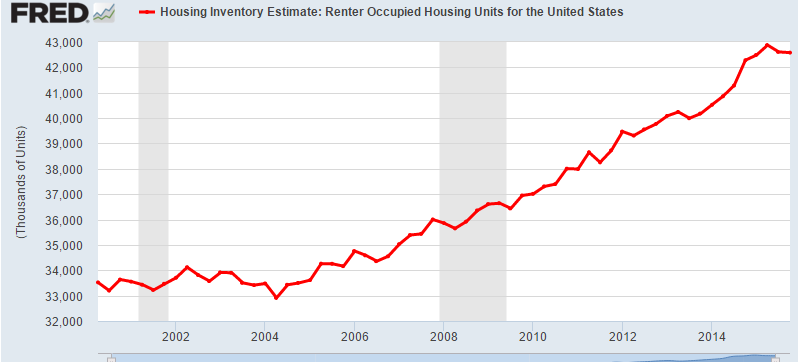
Housing prices have now reached an all-time peak. This is worth noting because the last peak was clearly at a point where we were massively overpriced, as seen in the chart below, and the entire world economy came close to experiencing the next Great Depression. There is nothing remotely “normal” about the current housing bubble’s rise and we can anticipate that its deflation could be equally abnormal and abrupt if the financial markets start to implode.
Homes were being bought by large investors to convert into rentals because money is almost FREE with rates so low, and the return on capital with rental properties is more than you will get anywhere else, plus you have a real asset, not paper money. This is where the bulk of the price increase occurred. This is why while net household’s information for owners is neutral, the country added 10,000,000 more reenter since 2004:
In short, real estate continues to provide the best return on investment. I recently purchased a large property, demolished the house, and am in the process of building a multi-family high-end retirement four-plex. I believe my area which is the www.CollingwoodRealEstate.net market will generate the best return on investment (cost of one property paying 4 rental income).
With low-interest rate it can make a business venture like this very profitable and is a solid long term strategy. The key with real estate though is to not get over extended with borrowed money. Own properties well within your financing capabilities factoring some worst case scenarios.
Eventually, certain areas of the financial system will crumble while others become favorable from stocks, bonds, currencies, to real estate. Each of these provide great opportunities to profit from through various investment vehicles like Exchange Traded Funds.
Follow my lead as I navigate the financial market and profit using ETF’s at TheGoldAndOilGuy newsletter.
Chris Vermeulen
https://thegoldandoilguy.com/wp-content/uploads/2016/04/Collingwood-Real-Estate-Market.jpg15272290adminhttp://www.thegoldandoilguy.com/wp-content/uploads/2014/11/tgaoglogo.pngadmin2016-04-09 13:18:582016-04-10 13:02:56The FED, Labor Force, & Real Estate
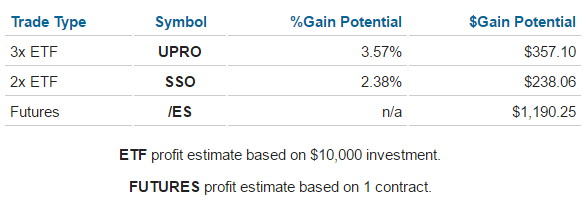
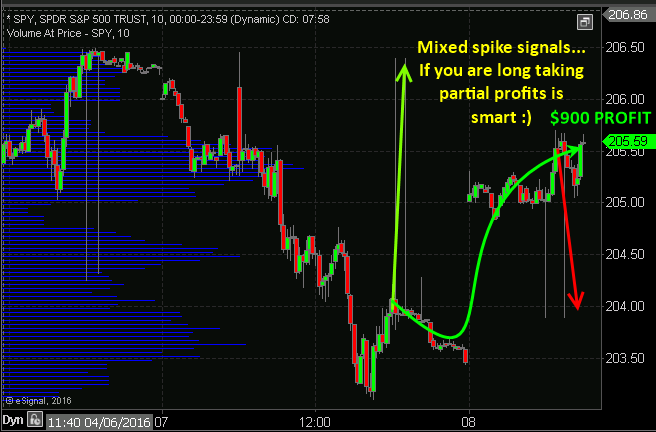
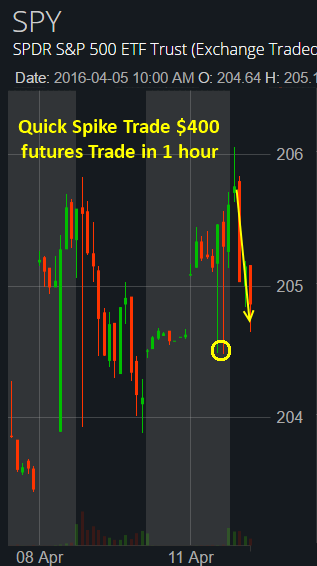
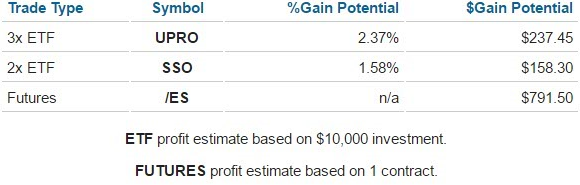
Last night Thursday Night I sent follower an email with the Spike Trade Setup and Profit Potential Table you see below. Today (Friday) the market moves sharply in our favor yet again for a quick $900 profit by 10am this morning.
How? you could have bought one ES mini futures contract, minimum required trading account size $5000, Bam… $900 morning or 18% ROI.
You could have traded with the ETF’s listed in the table also, but in order to do that, you will need a brokerage account that allows you to buy and sell ETFs during pre and post market hours like I do. If you cannot do this, then I highly recommend you use the broker I use because they ROCK!
Best execution fills, trade anything from one account (stocks, ETFs, Options, Futures, Forex) and super low commissions.
Friday’s Morning Trade Setup & Profit Taking!
APRIL 11th – Quick $400 Profit From Todays Spike Trade:
Start Trading With Me Today – Learn, Profit, and Prosper!
The article and charts display why silver is a neglected asset. Since the beginning of the year, gold has returned handsome gains for its investors. However, during this same period of time, the returns from silver have been lackluster, as indicated and why you need to know why…
I have to trade and invest in the markets that I have before me and not the ones that I desire! Therefore, I must be able to approach the market place from a completely ‘unbiased’ perspective. I do not care if the markets doubles in price, or if it is cut in half. I take advantage of moves in both directions by using my ‘short term spikes’ which I have shown you, over the past couple of weeks, in order to lock in profits in as short a period as 48 hours.
I implement my longer term cycle analysis to take advantage of moves in both directions which last several weeks or months.
Today, there are two ‘psychological’ situations that lead to big events within the markets. They represent ‘mirror images’ of one another.
The first issue is ‘overconfidence’. Whether this is ‘overconfidence’ in a market, a strategy of oneself, ‘overconfidence’ leads to carrying the largest position at the most inopportune time.
The second issue is ‘indecision’. There are times, when a market approaches critical levels and yet the trading population appears ‘uninterested’ or even ‘frightened’ to respond. In either case, ‘indecision’ leads to fewer participants, while ‘overconfidence’ leads to too many.
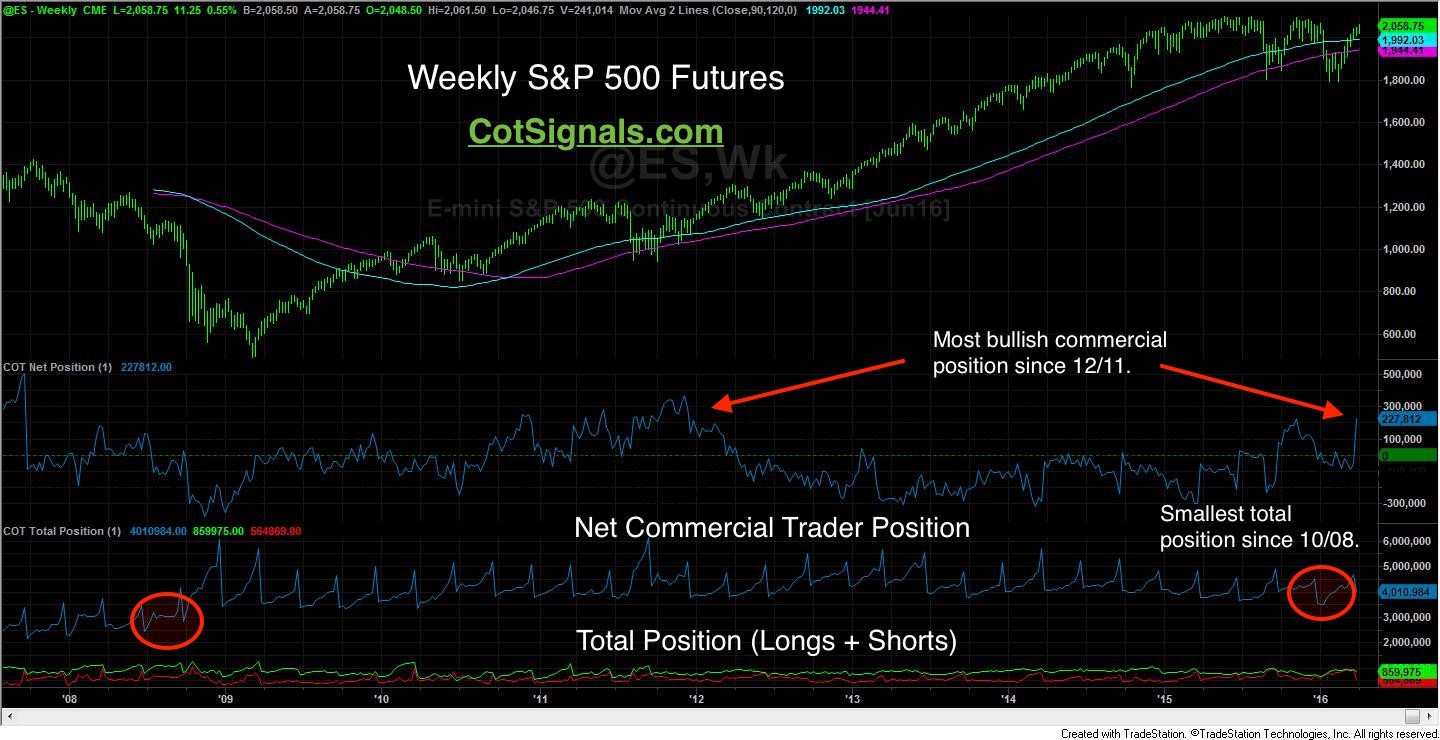
Currently, my focus is the examination of a ‘very bullish’ net commercial trader position in the face of the lowest commercial participation rate since the economic collapse of 2008/2009.
I may frequently reference the ‘net commercial trader’ position and ‘commercial trader momentum’, in my analysis. The total position is really only meaningful at its’ ‘extremes’. The most important factor to keep in mind, while reviewing the following charts, is the mathematical relationship between the ‘total and net positions’.
The ‘net commercial trader position’ is measured by subtracting the reported short positions from the reported long positions, of the given traders. Long contracts minus short contracts equal the ‘net position’.
This measure of sentiment is generated by the ‘consensuses of the commercial trader population.
This ‘net position’ predicts the degree of bullish or bearish sentiment. The total position measures the overall level of interest in a market, at any given point in time. This is one of those times when total interest must be used in conjunction with the net position in order to avoid trading while under a false set of assumptions. Therefore, while the current sentiment is positive, most of the ‘collective smart money’ is sitting on the sidelines, ‘uninterested’.
Fear is the primary reason for ‘smart money’ to be sitting on the ‘sidelines’ as the Dow Jones and SPX futures near their all- time highs. Commercial traders would most typically be the sellers of this rally.
Their ‘indecision’ is again noted by their exceptionally low participation rate, as the current global economic environment continues to waiver back and forth, from one economic announcement to the next, as I refer to as ‘news driven events’.
U.S. growth versus global stagnation appears to be the order of the day as the FED attempts to commence withdrawing a decades’ worth of stimulus. ‘Commercial traders’ are typically the most well-informed group of market participants and usually leads the markets’ next move. Their uncertainty is, significant, at this point in time.
The SPX futures represent an interesting situation! The ‘commercial trader’ participation rate is at the lowest point that it been since 2008, yet the ‘net commercial position’ is close to a multi-year high. This means that the ‘commercial traders’ currently in the market are exceptionally bullish, despite it being only a few of them.
The question to ask today is… ‘Are they still right?’ My opinion is that they may be right, for a while. My expectation is that we will see the broad stock market continue to rally into ‘nominal new highs’ over the next week still.
However, I also believe that this ‘nominal new high’ could coincide with the ‘peak’. This will present itself with weaker underpinnings and momentum divergence, or new ‘net commercial selling pressure’, informing us of the first confirmation of a ‘top’.
The Nasdaq 100 futures’ recent new high was not confirmed by the ‘commercial trader’. In fact, they are completely disinterested.
The Nasdaq 100 futures chart is beginning to display what a top may look like. ‘Commercial buyers’ of the September decline were rewarded with new highs, less than a month later. They were quick to rush into this years’ decline and their current ‘net position’ nearly matches the total from the last run-up.
However, note the large decline in the total commercial position since the October 2015 highs. Their participation rate is the lowest since 2008.
Hence, the ‘commercial participation rate’ has been trending lower since March of 2014, at which time the Nasdaq made its high around 3680. This is just below the August 2015 and February 2016 lows, in the Nasdaq. The Nasdaq appears to be the leader of the group and has begun most of the recent moves.
Therefore, my outlook is that the Nasdaq may not breach its’ recent high around of 4725. It will be very interesting to see if the ‘commercial traders’ will confirm this rally by returning to the market place. Until, and if they do, sentiment should remain ‘bearish’.
The Dow Jones futures recent rally is showing all the classic signals of a rally out of breath via divergences in price and momentum between price and commercial trader action, while guarded under the umbrella of declining volume and open interest.
I have illustrated a similar pattern to the Nasdaq on the Dow Jones’ futures chart. As you can see, ‘commercial traders’ set a ‘bullish net position’ record on the late summer decline of 2015. Much deeper analysis reveals that the new ‘net long record’ came on the heels of the smallest total commercial position in years. While it still created a fantastic trading opportunity, that I was able to capture on a short-term basis. I believe the broader pattern is ‘indicative’ of a ‘bearishly divergent’ top based on ‘commercial trader behavior’ patterns and activity.
The table below should provide a perspective on the commercial traders ‘lack of interest’ during this economic and geopolitical climate.
‘Fear’ is the primary cause for the declining commercial participation rate. The ‘commercial traders’ are among the most well-informed group amongst market participants. Their unwillingness to participate, at these prices, reveals two main key factors;
The current prices are distorted enough so as not to draw them into the market, on either side.
The current banking and political environment is far too ambiguous for them to place any long-term bets before the U.S. Presidential elections take place.
CONCLUDING THOUGHTS:
There are many moving parts and influences that create major market trends and one of the most powerful forces is that of the Commercial Positions. When large financial institutions and funds are buying so should we.
The US stock market is at a critical juncture. Times like these are tough to gauge, time and trade but as long as we understand this we can tread lightly until we have confirmation of a new major trend.
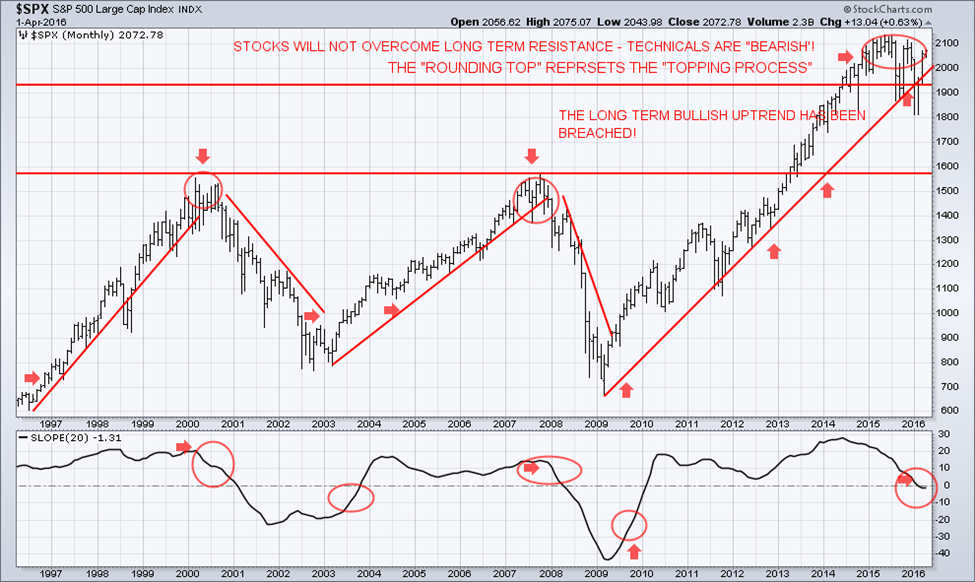
The writing is on the wall and has been for over a year. Stock market tops are process and take a long time to mature before breaking down and starting a new bear market. I feel we are in the final days of the large cap topping stage and will see substantially lower prices this time next year.
https://thegoldandoilguy.com/wp-content/uploads/2016/04/cotdada.png620900adminhttp://www.thegoldandoilguy.com/wp-content/uploads/2014/11/tgaoglogo.pngadmin2016-04-07 09:59:412016-04-04 17:07:33US Bulls Are the Most Complacent Since 2008!
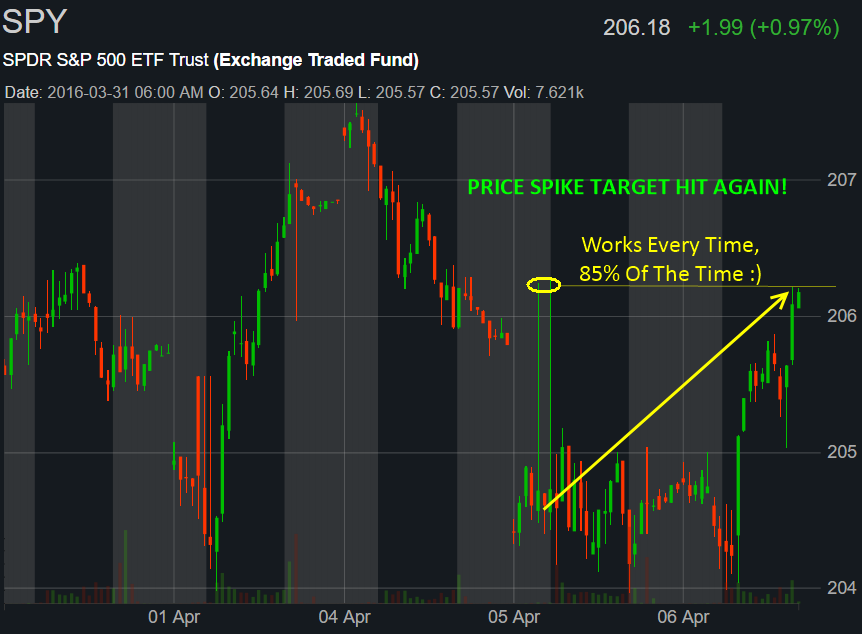
Everyone is going nuts over the spike trade setups I keep sharing, why? because they work almost every time and the money I’m seeing some of my followers making is crazy exciting to watch and experience with them.
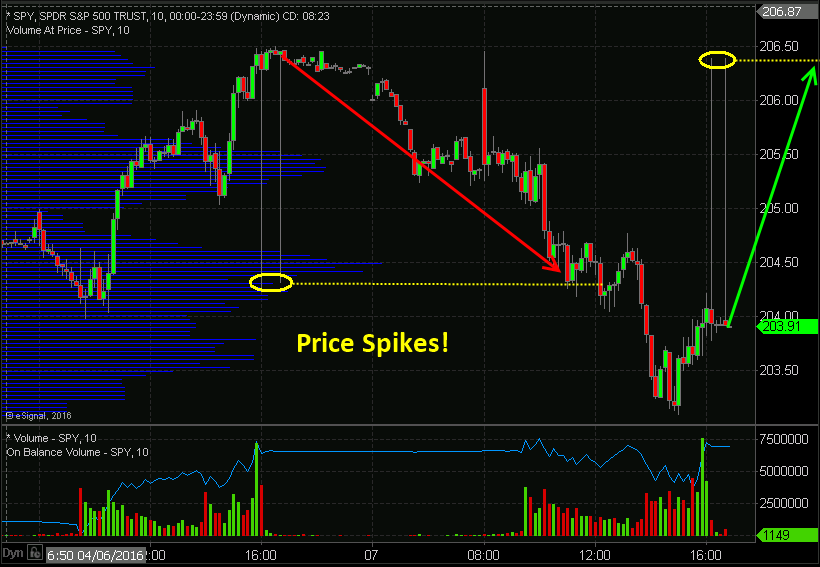
Below is a spike alert I shared yesterday for the SPY (ES mini, or anything related to broad market).
About an hour ago this target was hit ! Another winner!
I have something really exciting to share with you soon that will change the way we trade each week…
https://thegoldandoilguy.com/wp-content/uploads/2016/04/everytime.jpg7201280adminhttp://www.thegoldandoilguy.com/wp-content/uploads/2014/11/tgaoglogo.pngadmin2016-04-06 15:49:422016-04-06 16:18:09This Happens Every Time, 85% Of The Time!
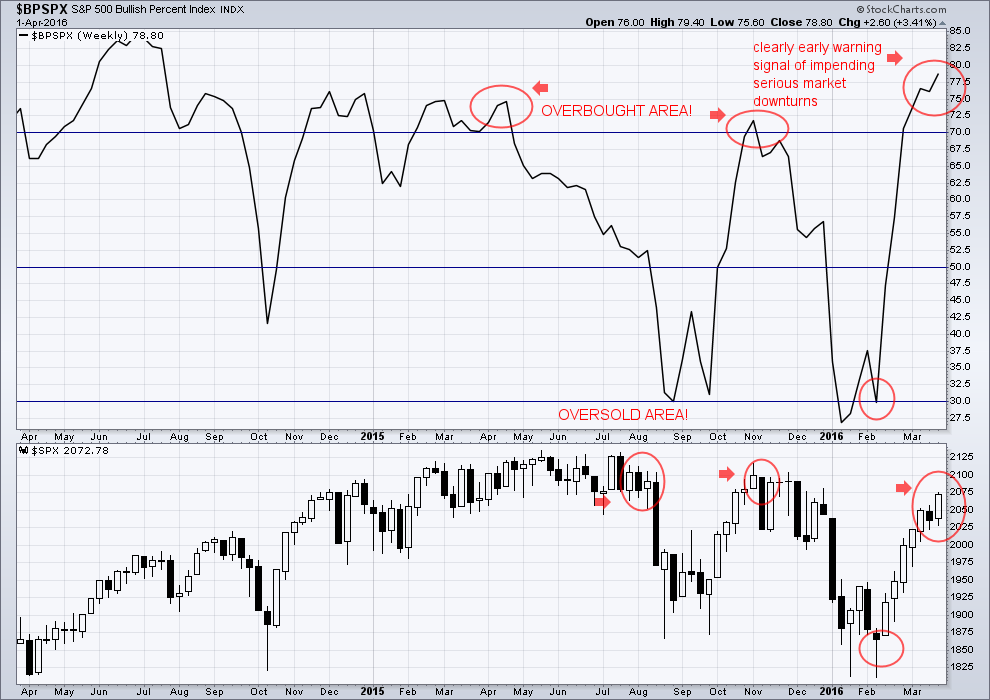
Currently, we are experiencing the SPX topping formation. Again, it is dangerously overextended. The SPX staged a strong rally due to the repeated actions of Central Bankers, during the month of February 2016.
Presently. we are truly living, investing and trading in ‘unprecedented’ times. Another push higher is not out of the question, at this time, into ‘nominal’ new highs as we experienced this past Friday, April 1st, 2016 and then within a week or two it should start cycling back down.
There are strong ‘headwinds’ straight ahead for any attempted rallies that may take place. There is ‘bearish’ divergence within several momentum oscillators. This is signaling major warning signs! There are no bullish or favorable long setups in the marketplace environment. I would look towards ‘unexpected’ choppy price movements across the board.
Investor sentiment has reading levels associated with ‘peaks’ in the equity market advances. Courtesy of ivewmakets.com
It is dangerous when the markets have nothing of substance sustaining them, other than their dependence on the FED’s announcements regarding its’ monetary support. It is extremely dangerous when the FED tailors its’ remarks so as to support financial asset levels. This is not the mandate of the FED, however, we are all waiting with anticipation, to hear their future announcement!
When Dr. Janet Yellen can make a couple of phone calls and implement an equities rally into new highs in 2016, of the equity markets, as of last Friday, April 1st, 2016, then we become the ‘fools’ who believe and buy into it!
Interventions by Central Banks, cannot change the long term trend from ‘bearish’ to ‘bullish’ I don’t think anymore. They are merely delaying the inevitable and just creating a ‘slow roasting bear market’ (as I have previously mentioned for several months is starting to unfold in the US large cap stocks). While these actions of the Central Bankers are now behind us, we are currently entering the earning season, which is most likely to disappoint Wall Street analysts.
The U.S. is currently experiencing the worst financial and economic recovery during the history of the countries’ worst financial crisis’ and ‘recession’, since the Great Depression. Most people don’t realize what is happening and thus don’t see or feel much of this recession, but it’s there building momentum in the background and it will be a rude awakening for most once the breaking point is reached.
Concluding Thoughts:
In short, the US stock market is at the topping point. Odd favor a major market downturn that will last before the next bounce, and then continue yet again even lower.
This will be a big surprise to most but my followers and I have been watching this unfold for months and are stocking the market to time the next BIG SHORT to make our killing.
British citizens will vote to decide if the United Kingdom should continue to remain in the European Union, or leave it, in a referendum which is to be held on June 23rd, 2016. The European Union is a political and economic partnership between 28 countries.
https://thegoldandoilguy.com/wp-content/uploads/2016/04/Brexit-700x439.jpg439700adminhttp://www.thegoldandoilguy.com/wp-content/uploads/2014/11/tgaoglogo.pngadmin2016-04-05 10:14:202016-04-05 10:14:20Will ‘Brexit’ signal the end of the Euro?
Learning to generate profits with trading systems is important, but it is what you add to your net worth that will make a lasting difference in your lifestyle and future. It is difficult to explain the difference that having a substantial net worth can make in your attitude. When you feel truly wealthy, the things and the experiences that your money can buy are secondary to the prosperity of the mindset that you develop. T. Ecker is fond of saying “The rich really are different and that it is their mindset, not just their bank accounts”.
https://thegoldandoilguy.com/wp-content/uploads/2016/04/Investing-700x491.jpg491700adminhttp://www.thegoldandoilguy.com/wp-content/uploads/2014/11/tgaoglogo.pngadmin2016-04-04 14:58:572016-04-04 14:58:57Do You Treat Your Trading As A Business?
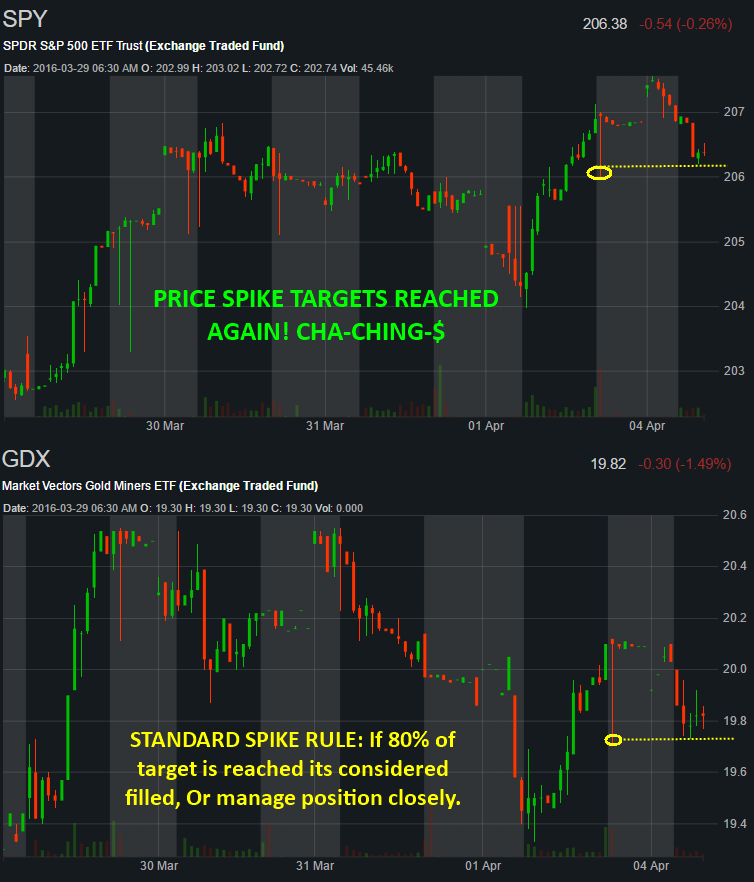
Over the weekend I shared two Spike Trade setups with ETFs: SPY and GDX.
Today April 4th we have seen them both get filled.
The SPY spike filled about 80% of the way and the rule we follow with these trade setups is that if 80% of a spike target is reached we aggressively take profits and manage the position. I will be creating a mini course/trading guide on how I trade the Price Spike trades so those of you who trade them or want to learn how to trade them can with incredible accuracy. Having a firm grasp of what to expect with each trade and how to manage each position is critical if you want to make a lot of money with these.
Having a firm grasp of what to expect with each trade and how to manage positions is critical if you want to make a lot of money with these. You must know the basics like knowing the intraday times of day to be looking to locking in profits or tightening stops.
Like today for example with SPY: Target was about 80% filled today right at 11am ET. Members of my newsletter know (if they watched my short educational video on this in the members area) that 11am is the reversal time of the day. If markets are falling we should expect a bounce. Knowing this allows us to lock in gains on SPY right at the 80% fill level moments before the market bounce.
All SIMPLE STUFF but you if you don’t know these things trading will be a struggle for as long as you trade I can assure you that.
IMPORTANT NOTE: Price spike trades are not the types of trades are extremely valuable and an added bonus for subscribers of my newsletter. But the OFFICIAL REAL trades are swing trades and long term investing signals for paid subscribers. Most swing trades can be entered 1-3 days after a trade alert at the same or better price than that of the alert, this is not fast paced trading.
https://thegoldandoilguy.com/wp-content/uploads/2014/06/etf-trading-newsletter-alert.jpg121144adminhttp://www.thegoldandoilguy.com/wp-content/uploads/2014/11/tgaoglogo.pngadmin2016-04-04 12:38:452016-04-04 12:39:23Spike Targets Being Filled – Money in the bank!