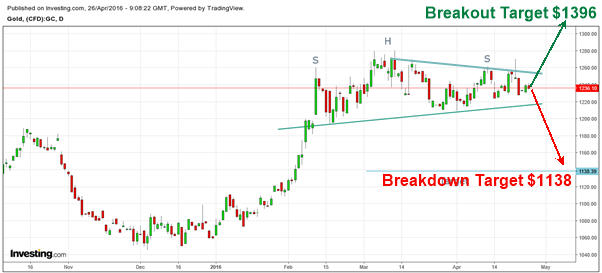
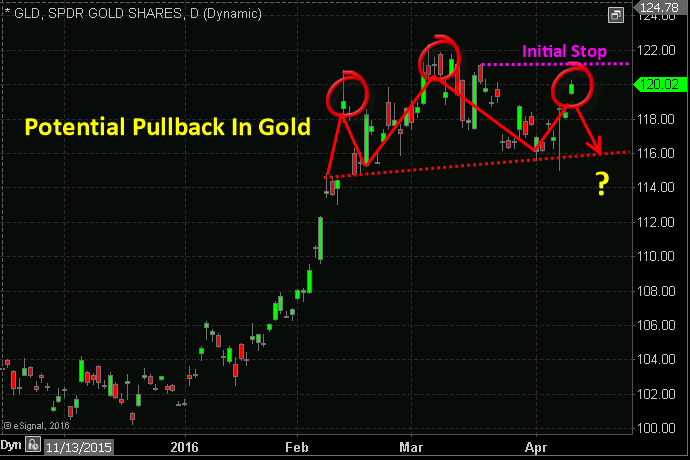
I have pointed out earlier, gold is forming a possible short-term top. It is on the verge of completing a bearish ‘Head and Shoulder’ pattern. The pattern is confirmed if gold closes below $1220/oz. The downside pattern target for this setup is $1138/oz.
If gold starts to rally and breaks out to the upside, then we should see the $1396 level be reached based on technical analysis.
I will open a new long gold position when the time feels right. With technical analysis strongly suggesting gold and silver have bottomed, New breakouts to the upside in metals and mining stocks can be bought.
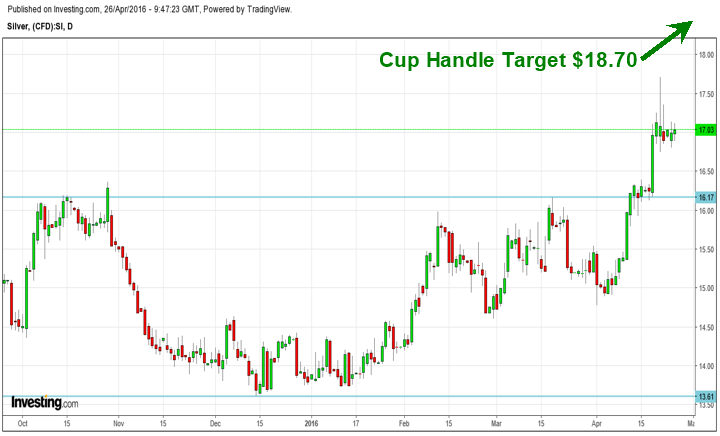
On the other hand, silver has formed an almost perfect cup and handle pattern and has broken out of it. It has reached its first target objective; chances are that silver will either consolidate or pullback after having met its target or move up to $18.70/oz. levels, which is the pattern target of the ‘Cup and Handle’ pattern formation. However, new buying is not advised at current levels due to a poor risk-reward ratio.
If you have not read the post about what the Silver COT data is warning us about be sure to read this short post: Click Here
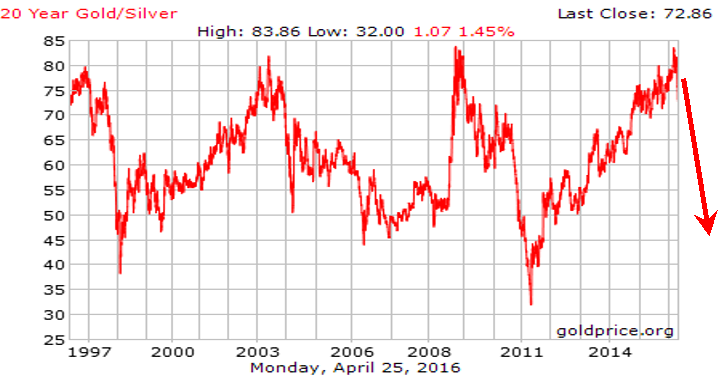
If we take a look and monitor the gold/silver ratio closely, recently, the ratio had touched its resistance of the past 20 years. Every time the ratio has returned from the resistance, the minimum it has retraced is to the levels of 45.
There are no reasons to believe that it will be any different this time around. Hypothetically, if gold were to remain at $1236/oz. and if the ratio corrects to 45, silver will reach $27.5/oz., which is a 62% increase from current levels.
Hence, it is prudent to stay with silver for a better return compared to gold once price has a pause to regroup before the next rally.
How to Trade Gold & Silver Conclusion:
Buying gold and silver offer different rate of returns to the investors. If an investor is able to time both the precious metals, then the total returns will be ‘astronomically high’ in the future.
My timing ‘cycles’ provide signals both for the short-term and the long-term. The price action of both gold and silver along with my cycles have been showing VERY strong “Cycle Skew”, which I explain in detail in my book “Technical Trading Mastery”. This cycle skew is telling us that precious metals are now in a strong uptrend and is another confirming indicator that support much higher prices long term.
During the first half of a bull market trading price patterns and upside breakouts tend to work very well. Because interest in the sector is growing and more buyers continue to enter that market, price pattern breakouts are the last chance to get a position before price has its next rally higher.
I will continue to inform my subscribers of new swing trades, and even more importantly the long-term investing Set-It-And-Forget-It ETF trades to ride out the new bull and bear markets for massive profits.
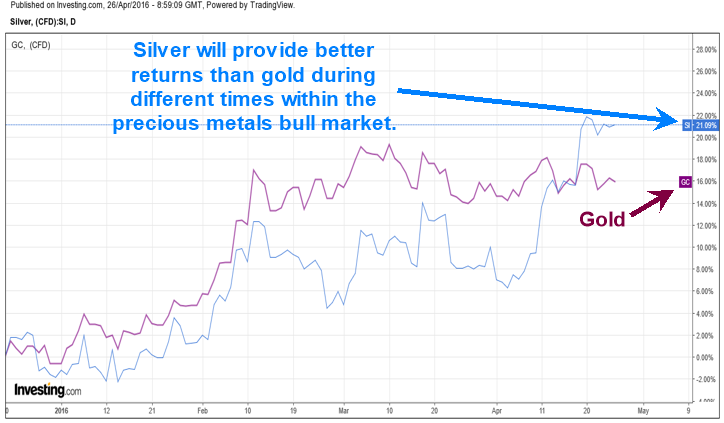
Last week, the beginning of April 18th, 2016, silver was on fire, rising sharply and forcing ‘Wall Street’ to take note of its move, though, many investors believe that gold and silver are one and the same, one can hold either in your portfolio and earn the same returns? the truth is far from that!
In reality, though both silver and gold are considered precious metals and over the long-term, they have a high degree of ‘correlation’ in their movements, but in the short-term, for the active investor, both offer opportunities at different times.
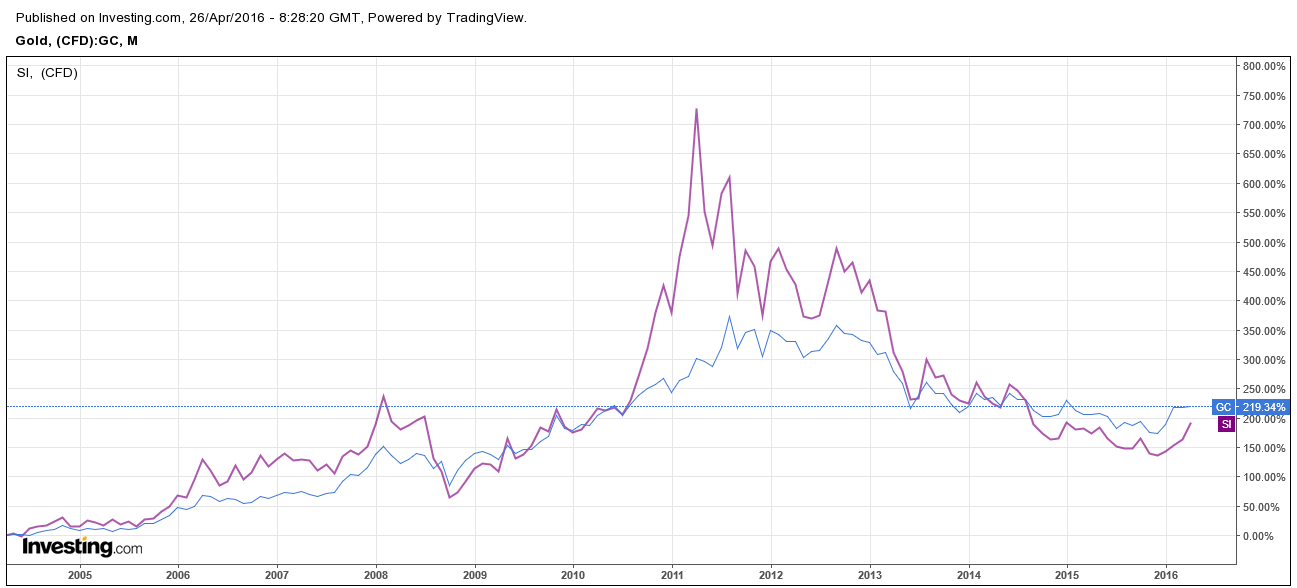
From the chart below, it is clear that once the bull market starts in precious metals, silver beats gold hands down. From 2005 to the highs in 2011, gold returned an impressive 350% returns, whereas, for the same period, silver recorded an astounding 700% return.
My subscribers are aware that we are extremely bullish on the precious metals over the next few years when the global economies enter ‘The Great Financial Reset’. Gold will be in a sustained bull market for years to come and will reach levels which now seem unbelievable.
History suggests that if gold witnesses a resounding bull market, silver will outperform it.
However, occasionally, investors will benefit if they trade in and out of both these markets. At times, holding silver is more profitable than gold and at other times, it is the other way around.
Consider this, if one would have bought gold, during the start of this year of 2016, one would have made an impressive 16% returns in the first two months’ as shown in the chart below. However, silver would have returned a 12% return for the same two-month period.
Since then, I raised a ‘red flag’ regarding a short-term top developing in gold and gold prices have been range-bound with a downward bias.
On the other hand, silver has taken off, on April 18th, 2016, netting an investor a 16% gain in this month, which beats most other asset classes, including gold. Today, ‘Commercial Traders’, as determined by their large position, which we have not been this bearish on silver since 2008. This is when silver traded from $21 per ounce all the way down to $8 just before silver had a multi-year rally topping in 2011. They set a new record short position last week!
Concluding Thoughts:
In a couple days, I will be posting the second half of this article here on this website to show you what exactly is likely to happen and when for both gold and silver. Trading and investing is not as simple a most think it is. Just because you or someone you follow is bullish on an investment does not mean it is a good buy or should be bought. Timing is everything in the markets and knowing when and where to buy and sell is the key to long-term success.
The big question you should be asking yourself is if precious metals are headed lower? This I will share with you in a couple days, stay tuned.
https://thegoldandoilguy.com/wp-content/uploads/2016/01/goldsilver.png178269adminhttp://www.thegoldandoilguy.com/wp-content/uploads/2014/11/tgaoglogo.pngadmin2016-04-29 10:33:362016-04-29 10:33:36Is silver a better bet than gold in the near future?
The ‘Great Recession’ of 2008 was brought about by reckless lending. The aftermath left the credit market in an extreme tight squeeze whereby corporations were frightened and hesitant to spend. Cost cutting led to massive layoffs leaving people with no money, therefore, ‘aggregate demand’ dropped! Economists, led by the then FED Chairman Ben Bernanke, believed that the solution to this problem lay in generating demand by using the ‘easy monetary policy’ as propagated by the ‘Keynesian Theory’.
https://thegoldandoilguy.com/wp-content/uploads/2016/04/keynes.jpg294378adminhttp://www.thegoldandoilguy.com/wp-content/uploads/2014/11/tgaoglogo.pngadmin2016-04-26 08:04:522016-04-26 08:04:52Did “Keynesian Economic Theory” fail in the post-crisis years of 2008?
Gold and silver have more or less confirmed they have bottomed and are ready for a multi-year rally. Their trend has not fully ‘reversed’ to the upside yet but the market breadth and internals for the precious metals sector are very bullish. My subscribers know that I am ‘bullish’ on precious metals and believe that they will be the best performing ‘asset class’ within the next three to five years for those who can only buy long (profit from rising prices). There are a few more big opportunities unfolding in other assets also but that is not what this article focuses on.
There are more than enough signs which indicate that a looming ‘financial crisis’ is impending and will last longer than the Great Financial Crisis (2008-2009) did and will test the values of our society.
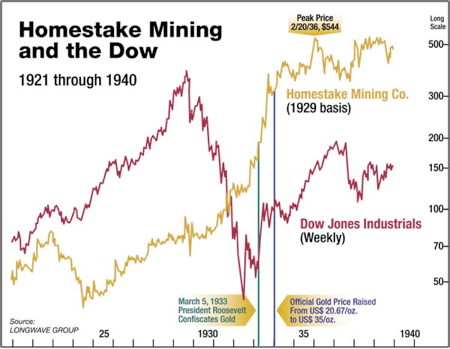
During the ‘Great Depression’, although gold was not traded freely, the gold mining stocks made a ‘killing’ while the rest of the stocks were plummeting into a bottomless pit.
During the ‘Great Depression’, Homestake Mining, which was the largest US gold miner, at that time, outperformed the Dow Jones Index by a huge margin; the chart shown below clearly illustrates that while the other investors were monitoring their stocks which plummeted at close to zero valuations, the investors of the leading gold miner, Homestake Mining, incredulously multiplied their investment!
During the period that the Dow Jones Index crashed, Homestake mining returned more than 1100% profits to its’ investors.
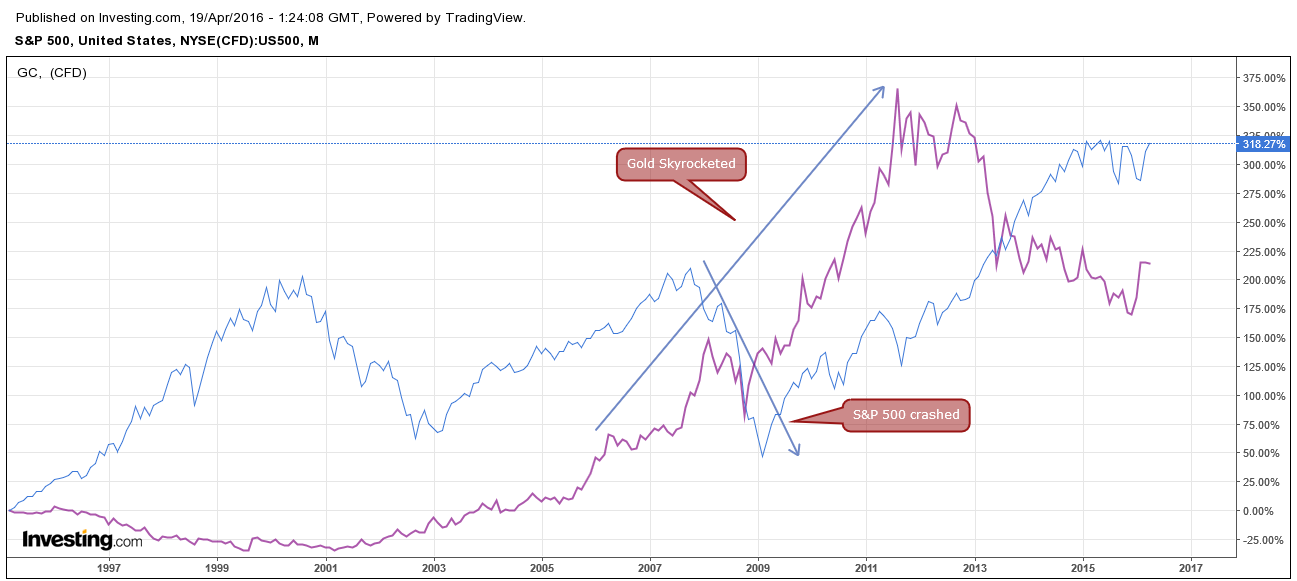
Fast forward to the ‘Great Financial Crisis’ of 2007- 2008, when the stock markets and commodities plunged, however, gold and silver entered into a strong ‘bullish’ trend as seen in the chart below.
The historical references indicate that during a financial crisis traders tend to flock towards gold which outperforms the markets by a huge margin!
Gold has lost its’ luster, in the past five years, after topping out in 2011 when the FED and other Central Banks embarked on a money printing spree. However, for the first time in six years, gold returned with a massive 17% rally in 2016.
Despite announcements of further QE made by the ECB as well as negative interest rates which were announced by the BOJ, gold has ‘held its’ own’. This indicates that the traders are not buying the current upward move in the SPX, but rather, are accumulating gold at every dip.
The ‘smart money’ enters the ‘asset class’ at an early stage of the new bullish trend, hence, it is important to follow the ‘smart money’ so as to verify if they too believe in my hypothesis that we are about to witness a ‘massive financial crisis’ unfold!
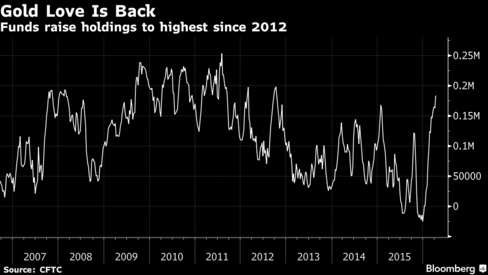
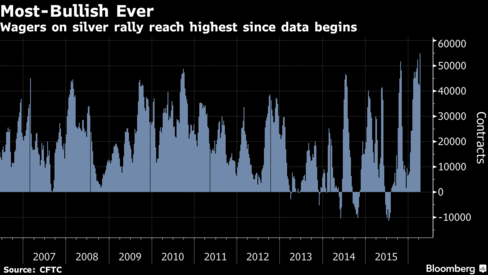
Chart Shows the Number of Contracts Owned by Large Investors
The ‘smart money’ continue to invest in gold. They have increased their holdings to 184,218 contracts (according to the latest Commodity Futures Trading Commission data) which represents double their holdings of two months earlier. This is also the highest holdings since 2012.
Is the ‘smart money’ favoring only gold? No, they are also loading up on silver. Professionals have increased their net-long positions by 54,885 contracts which is a 30% increase; the highest percent reached since 2006, according to CFTC data.
The data (in the chart below) clearly points to the investment preferences of the Money Managers. They are utilizing the current dips in order to add to their positions in gold and silver.
I have talked about how gold and silver will be the ‘asset class’ to invest in, for the future for many years, but we have been waiting for them to bottom first before getting positioned. The current accumulation in both suggests that gold and silver have put in their long-term bottoms. This will be an uptrend for several years if my analysis is correct.
Due to monetary policies, enacted by the FED and the other central banks, I expect that the SPX is now completing its’ ‘topping formation’. The retail traders and others may dump their gold and silver because they believe that the stock market is starting a new ‘bullish’ trend.
I expect that there will be an exceptional opportunity to buy soon in metals. I want to maximize the gains of each and every dollar that is invested, therefore, I will advise my subscribers when it is the most optimum entry point.
Continue to follow my analysis and trades so you will know when the optimum time to enter into gold and silver is and then watch your investments grow exponentially.
https://thegoldandoilguy.com/wp-content/uploads/2014/07/gold-forecast.jpg369553adminhttp://www.thegoldandoilguy.com/wp-content/uploads/2014/11/tgaoglogo.pngadmin2016-04-21 11:03:422016-04-21 11:03:42Gold and Silver are on the Cusp of a Massive Rally!
https://thegoldandoilguy.com/wp-content/uploads/2015/05/silver.jpg225224adminhttp://www.thegoldandoilguy.com/wp-content/uploads/2014/11/tgaoglogo.pngadmin2016-04-15 10:02:502016-04-26 20:58:34Silver Could Pass Gold as Hot Investment
IMPORTANT VIDEO NOTE: Remember these cycles evolve and change over time. What you see here is likely not what is expected to happen now, and members and I are trading differently. Analysis Updated Daily!
https://thegoldandoilguy.com/wp-content/uploads/2016/03/video-comuter.png258224adminhttp://www.thegoldandoilguy.com/wp-content/uploads/2014/11/tgaoglogo.pngadmin2016-04-12 09:36:372016-04-12 11:27:11Gold, Gold Stocks, Oil and Stock Market Prediction – April & May
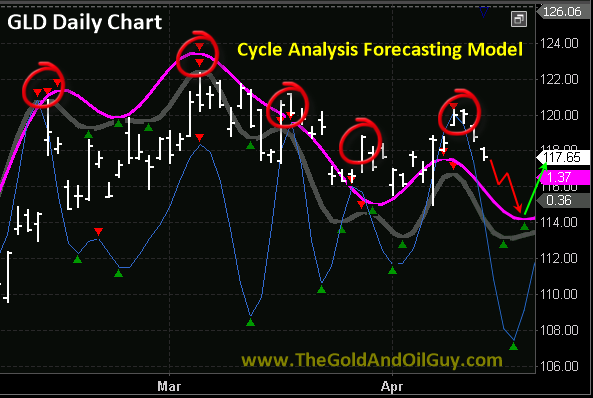
Metals and mining stocks continue to rock higher decoupling from our cycle analysis to create a strong impulse wave higher. This is what I feared last week and talked about happening and is the reason we had our protective stop for our short gold trade so we would keep that trade as a winner. Also, my gut was warning that this cycle break and emotional rally was trying to happen, and that is why we did not re-enter a short position in this sector.
The last two weeks this sector has been moving fairly sporadically and out of sync. Because of this, I have not covered it in much detail. Yesterday Obama announced an unexpected and expedited closed door meeting with the FED for today. I think this may have everyone worried and buying metals today.
Today’s massive gap and rally actually have me very interested in a short trade for gold. With the chart forming a balance head and shoulders pattern, price trading at resistance, a news/fear based rally, along with a short-term cycle topping today, this could be a great low-risk trade and price may fade back down over the next 1-3 days.
See chart below or login to view:
Couple things to touch on here:
First, I would like to mention and be clear that while I share some spike alert setups here and there with you, those trades are not the main focus of this newsletter and my trading. This year the way the markets have been gyrating spike trades have definitely filled the void for a lack of swing trades and long-term investment positions.
We will sooner than later start building some new long term positions and have swing trades. But it is difficult because so many markets are all trying to change directions and chopping around. I don’t want us holding onto trades that will be all over the place for several weeks before moving in our favor. We don’t need that stress. Rather, I’m trying to hold off as long as I can before getting positioned. Don’t worry, they are coming!
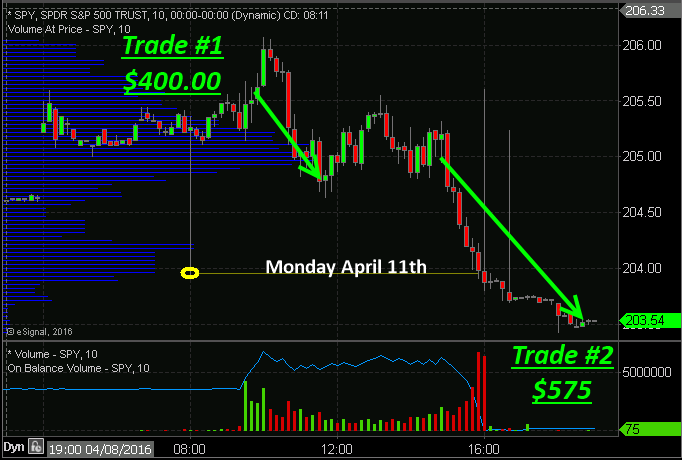
Second, I know many of you love the price spikes as they provide a steady stream of winning trades each week. Friday morning was a quick $900 profit, and this morning in the video I shared with you the SPY price spike that took place in pre-market today. I traded it also for a quick day trade pocketing $400.00 in less than 1 hour to kick start the week.
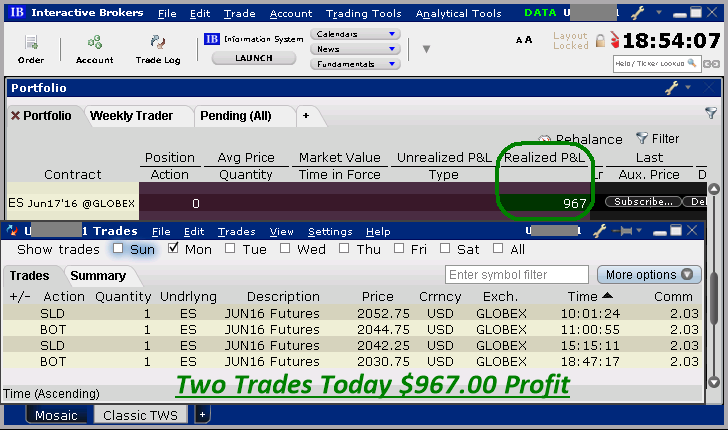
You can see my trade today with my Interactive Brokers account. I waited to enter this trade until I felt the market shook out the short positions and got everyone bullish for the day. Then I sold short 1 the ES mini futures contract at 10:01am.
I have explained the market shakeout move before. How we see a price spike and the market, but the price will first move in the opposite direction to get everyone on the wrong side of the trade before it makes its move to reach the spike target.
Then 59 minutes later at 11:00am I bought back my short position and locked in 8 points ($50 per point x 8 = $400). Then another short position in the afternoon as the market started to breakdown again to fill the morning spike for another 11.5 points ($50 per point x $11.5 = $575).
Just these three trades you were able to pocket $1,8670.00 which is more than enough to cover 4 years of me sharing analysis and trades with you… not too shabby!
I will be creating a mini course/guide on how to trade Spike Alerts soon because there is an art to doing it well. Plus, I am working on a solution so those of you who want to keep rocking with the price spikes can do so without me bombarding every member with all this day trading/momentum analysis and updates.
I totally understand and feel for those who just want long term and swing trades and not intraday updates all the time. So, I’m working to satisfy both groups.
Chris Vermeulen
https://thegoldandoilguy.com/wp-content/uploads/2016/04/problem-solution-620x2851.gif285620adminhttp://www.thegoldandoilguy.com/wp-content/uploads/2014/11/tgaoglogo.pngadmin2016-04-11 15:37:192016-04-11 19:06:36Massive Surge in Precious Metals & Spike Alert