I could go on in detail about why and what price spikes provide us short term trades with, and I will in a future article and video. Keeping things short and simple we will let the charts to the speaking for now because they paint a very clear picture of what they do and how quickly we should expect our profit targets to be reached.

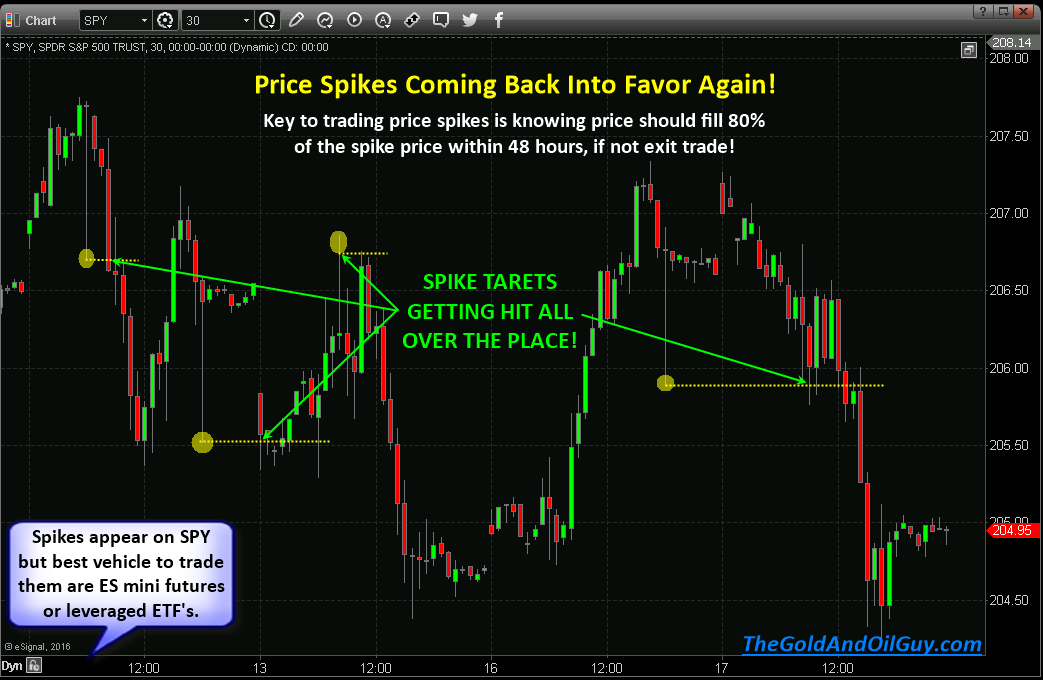
The chart below shows the recent price spikes in the SPY. These spikes come and go, meaning some months we may only see a couple, and other months we see 10-20 of these incredible momentum trading opportunities.

As you can see below this is a 30 minute chart going back 4 trading sessions and we saw 4 price spikes with each reaching their price targets within 24 hours of the spike alert.

spikes-r-back


Types of Price Spikes I Focus On

I only focus on price spikes that take place outside of regular trading hours, so before 9:30am ET, and spike after 4:00pm ET.

And, the spike must be a minimum of 0.23% away from the current market price. Why 0.23%? Simple really. We need enough of a move to make the trade and risk worth our while to trade.

You may be saying to yourself that 0.23% is not much of a move… well you are correct, but that is why I focus on trading these moves with a high degree lf leverage. I use the ES mini futures contract.


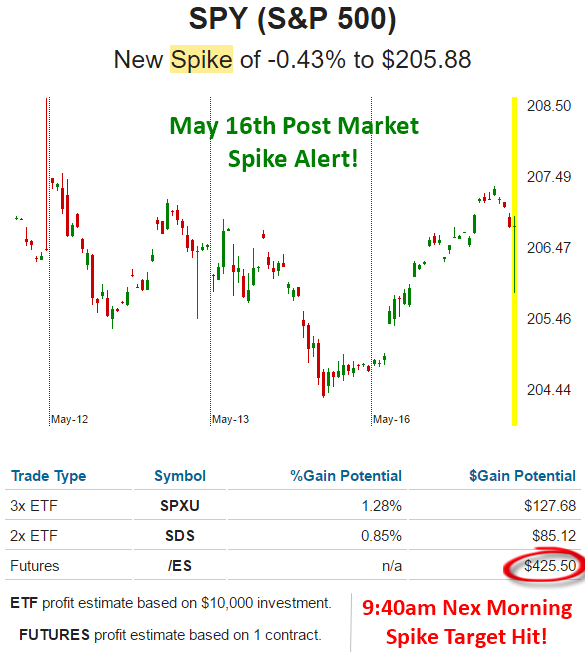
Recent Sample Spike Alert Trade Setup

See the sample Spike Alert that took place a couple days ago. It was small only 0.43%, but amplifying the leverage can turn a small move into big profits. In this case, the spike alert generated a quick $425.50 profit within 24 hours, which is a 7.5% ROI base on one ES mini futures contract. Here is another live example with my broker statement.

easymoney


CONCLUDING THOUGHTS:

In short, spike alerts not only provide a steady stream of quick winning trades each month, but they also tell what the market bias/trend will likely be for that trading session.

If you day trade, then spike alerts are the ultimate tool for knowing which direction you should focus on trading that day, or at least until that price spike level has been reached.

Learn More At: www.TheGoldAndOilGuy.com

Chris Vermeulen

Currently, a ‘sharp fall’ is now anticipated within the equity markets! This decline will be accompanied with ‘new volatility’.  There is a great deal of ‘uncertainty ‘within the U.S. markets. Currently, we are viewing a ‘textbook’ ‘head and shoulders pattern’ in the SPX and is going to be a big inflection point we look back on months from now.

There are less and less stocks that are participating in the recent move upwards which suggest a technical breakdown is likely to happen.

tide3

The ‘cycles’ of the SPX have recently confirmed that we have now witnessed the ‘highs’. The ‘top’ is currently in place and I expect that the ‘negative trend’ will continue to persist.

See my live analysis charts and forecast click here

The ‘smart money’ has been exiting the equity markets during the last few weeks with strong waves of selling volume taking place on a consistent basis.

Yesterday morning, Monday, May 16th, 2016, I alerted my subscribers to two new positions to enter into so as to take advantage of during this next significant market move and change in volatility.

Consequently, consumers have already started to slow down in their spending.  They will change their past behavior, and, as a result, will begin to save (whatever funds that they may still have) as stocks start to fall in value along with the average investors retirement accounts. The present day spending behavior will come to a grinding halt in due time!

Before “The Great Credit Crisis of 2007 -2008”, the ‘smart money’ exited the equity markets in November of 2006. And it appears that the NDX-100 and the Russel 2000 are leading the ‘charge’ downward once again for the pending market correction.

We are, once again, repeating this same technical pattern, now!

tide2

Concluding Thoughts:

In short, the first chart I showed in this article paints a very clear picture of where stock prices are headed – Lower.

Large cap stocks over the past year have been making lower lows and lower highs. The most novice of traders knows what that means… It means, we are in a down trend.

There are many ways to take advantage of what is about to unfold next and subscribes and I are already in position for the first big and quick trade, but there are many more just around the corner!

I share a few ways I am taking advantage of this with followers of my newsletter at: www.TheGoldAndOilGuy.com

Chris Vermeulen

Central Bankers are continuing to use ‘old discredited’ models.  In these models, the ‘interest rate’ is the key policy tool, which are being used to be ‘dialed’, up and down, so as to ensure good economic performance.

If a positive interest rate does not suffice, then a negative interest rate should do the trick, right???

READ FULL ARTICLE HERE: Click Here

This week will very likely be one we look back on as a big inflection point.  We will see that the bears are coming back.

It appears the market is forming a head and shoulders topping pattern. Thre are a couple different ways to trade this pattern depending on the level of skill and aggressiveness.

One can wait for a closing bar below the ‘neckline’ on the time-frame in which you have identified the pattern.  By operating on a closing bar basis you significantly reduce the risk of entering on a ‘false’ breakout. Entering prior to the close of the bar increases the risk of becoming part of the wick of a reversal candlestick should it close back above ‘neckline’ support.

Another way is to try and time the right shoulder and short into the bounce or pause just before you think a neckline break is about to occur.

Both, have then pro’s and con’s, which is better, that all depends on the overall market conditions and that of the trader making the trade.

Take a look a couple charts below so you can see where I feel the stock market is within this pattern.


iViewMarkts.com Bullish Sentiment Indicator: This shows active traders have been very bullish and are just now starting to become bearish. As more short term traders start to sell their long positions and build up short positions this will put downward pressure on stocks and likely start the new trend down.

marketsentiment1

SP500 Bullish Percent Index:  This chart is telling us more stocks are starting to form bearish price patterns after being overbought the last couple months.

NEWBEARISHSPXCONFIRMED


Head & Shoulders Pattern: This is the pattern I speak of showing where most traders enter positions for this price pattern. There is always a possibility that the market does not do a Kiss goodbye (retest of breakdown). The strongest moves to the downside will not retest the breakdown in most cases so playing the breakdown I think is vital.

H_S-dual-entry


SP500 Head & Shoulders Pattern:

SPXHEADSHOULDERMAY15

That is a quick snapshot of the market and where it stands…

Get My Trade Alerts In Real-Time: www.TheGoldAndOilGuy.com

Chris Vermeulen


Traders who follow the price of gold and silver, should keep an eye out on the U.S. dollar index. The dollar has been within a trading range for more than a year. During December of 2015, the dollar rose to test the highs at 100, however, since February of 2016, the dollar has been in a downtrend, as shown in the chart below.

The FED has reduced the expectations of a rate hike in 2016 from one full percentage point, in the beginning of the year, to a half percent and perhaps to none at all. However, my expectation is that the FED may have to start rolling back this increase before the end of 2016.

The bullishness in the dollar was sparked by expectations of a change in the monetary policy of the FED. Market participants believed that the Zero Interest Rate Policy, NIRP, would end and that the rates were on an upward trajectory.  However, world economic conditions have deteriorated since the beginning of 2016 and the ECB and BOJ both responded with Negative Interest Rates, NIRP and more QE. Consequently, the FED was forced to delay their rate hikes.

Last week’s shot term breakdown of the dollar, below the critical support of 93, was a bearish sign which can bring the dollar further down to the 86 levels. But the dollar posted a solid rally by the end of the week to regain that critical support level for the time being.

price of gold dollars

Although gold is a commodity, it is used as a hedge against ‘uncertainties’ and ‘crisis points’ which gives it a different edge. Gold, also behaves differently because of its’ usage as money, as ‘a store of value’, for many centuries for both individuals and countries.

Due to the ‘meaningless’ monetary policies of the various global Central Banks, gold will follow its’ unique behaviour. I have explained this earlier and my models have been very timely in forecasting the turning points.

Gold will have a one-way move higher with many corrective phases on its’ impulsive new uptrend, therefore, I always keep my subscribers immediately informed so as they know when to make the next profitable trades of both gold and silver. The next trade I feel is just around the corner.

Follow My ETF Trading Alerts and Analysis: www.TheGoldAndOilGuy.com

Chris Vermeulen


Price of Gold: The activities of the ‘commercial traders’ in the COT data is closely watched by the market participants, as they are believed to be the smartest of the lot.  They take deliveries on their bets, unlike the speculators, who have no interest in taking a delivery.

If you have followed the ‘commercial traders’, without paying attention to my proprietary predictive trend and cycle analysis for the price of gold and silver, you would be sitting on large losses, due to their ‘short positions’ which mean they expect price to move lower.

The ‘commercial traders’ ‘short positions’ are currently at record levels which are more than twice of that as compared to last years’ readings. Since the beginning of the second half of February of 2016, the ‘commercials’ have been increasing their short positions during the time that gold was closer to $1220/oz.

Price Of Gold
Daily Price of Gold Chart and Analysis:

However, if you have followed my recommendation, you would have maintained that once the price of gold crossed the $1190/oz. levels, it was destined to go higher.

However, the head and shoulder formation which developed after gold broke above the $1190 resistance trend line I did feel it would correct for a few weeks.

Instead, the price of gold did not correct, rather it consolidated with this what looked to be a head and shoulders pattern then broke out to the upside and rallied. Once a bearish pattern fails, it becomes very bullish which is what has happened in this case. I was quick to alert my subscribers to buy as soon as the pattern was broken and turned bullish.

However, the current price of gold at $1300/ oz. could offer some resistance, but the resolution of the trend in due time is going to be very strong. The pattern target of the current move is $1350/oz.

priceofgold

What about the ‘poor man’s gold’, Silver? 

The chart indicates that in the last three weeks of April of 2016, the ‘commercial traders’ have added to their short positions continuously, however, they have been proven wrong once again with the breakout in silver returning 20% during the month of April of 2016.

Price Of Silver


Although we take note of the ‘commercial positions’, I strongly believe in my analytic models which have provided excellent returns, over many years.

Once above the $16/oz. levels, I have had no doubt that silver was ready for a sharp run-up. Therefore, I will be advising my private subscribers as to when to purchase silver, against the bias of the ‘commercial traders’ and I am confident that my subscribers will reap a windfall when the time is right.

 priceofsilver

Conclusion – Current Investment Strategy of the Mega-Rich


Do you really want to follow the ‘smart money’? Then follow the billionaires and the big banks as I have been doing.  Ray Dalio, the founder of Bridgewater Associates, manages the largest hedge fund, in the world. His fund manages over $160 billion in assets.  Today, his fund is bullish on gold.  He recently stated “if you don’t own gold there is no sensible reason other than you don’t know history or you don’t know the economics of it”.

Stanley Druckenmiller has been purchasing a large long-term position in gold.  He made an average of 30% of an annual return in his fund since 1986. So, what is he buying now?

He has an $880 million position in gold, right now. Do you think you should now be following the ‘really smart money’, today?

Follow the ‘smart money’! Gold is for the long-term investor, well looking forward 3-5 years at least.

Get My Daily Live Price of Gold Market Analysis, Forecast & Trade Alerts: www.TheGoldAndOilGuy.com

Chris Vermeulen

Last Friday, April 29th, 2016, the U.S. Indexes were very bearish as price clearly broke below the 20 day moving average then rebounded back up to test that level and was rejected and sold into.

The chart below shows the market bullish and bearish momentum and price action. The momentum of these markets has now shifted away from being ‘bullish’. It is currently struggling to find support and hold up.  Do not expect new highs on the SPX and I feel its beginning its ‘bearish reversal’ (topping phase) before making a new leg down.

idealbounce

This ‘counter trend rally’ is now completing!

It is important to realize that all bear markets have strong rallies within them. In fact, some of the more powerful market rallies happen during bear markets, so what we have experienced this year is very normal.

With being that said, this bear market counter trend rally is running out of steam and is on the verge of a very strong wave of selling which will catch the majority of market participants off guard. Why? Because these super strong counter trend rallies actually convince the average investor that stocks are the place to be and will continue higher. These counter trend rallied get investors to buy up stocks at the ultimate worst possible time, just before prices collapse. We have seen this happen time and time again and this time is no different.

counterchart

Where Do We Put Our Money Then?

Gold prices have surged this year. Silver has lagged far behind but has recently rallied to make up for its underperformance this year. Silver, known as ‘poor man’s gold” and I feel will do exceptionally well in the coming year as it enters a new bull market.

I would expect sideways consolidation at this point for gold and silver before they continue up again, but they are definitely moving much higher the rest of this year.  Subscribers and I are long gold through an ETF and if this trade pans out in the coming weeks it could end up being a multi-year investment.

These ‘monetary metals’ are now ‘confirmed’ to keep rising as a safe haven and currency play by both investors and countries in my opinion.

The U.S. dollar has broken support in the last few days.  This is a primary driver causing gold and silver to begin these big moves up in the past week.

US Dollar Index Weekly Chart Below:

As you can see below, the dollar broke support early in the week, but has recovered nicely to get back above support for the time being.  I feel it’s just a matter of time before the dollar breaks down and collapses 10 – 15 cents. If this/when this happens precious metals should sky rocket!

usd-bounce

Market Trading Conclusion:

In short, the US large cap stock are in the very final stage of topping before share prices collapse and start a 8-16 month bear market. There will likely be some big event that triggers the selloff, the question is what and when?

There are going to be some great short term trades that could generate 50%, 100% or more within the next month which I have been following closely with subscribers of my ETF trading newsletter which you can be a part of. Join at: http://www.thegoldandoilguy.com/etf-trading-newsletter/

Chris Vermeulen

This past Friday, April 29th, 2016, GOLD entered its “first phase” of its new long-term bull market. This has created a whole new world of opportunity, for my subscribers. The global Central Banks opened the floodgates encouraging us to go on a gold buying spree.

The Government Is Like an Unethical Banker Playing Monopoly

What the government has been doing and continue to do is such a joke. In Laymen’s terms, it’s like all of us playing the game Monopoly. We all start off with some money, slowly accumulate properties, rental income and build wealth, while closely managing our money and making sure we have enough cash on hand to buy more properties and/or pay rent and other fees as we move around the board. We are honest players paying our debts as required and expected.

Then there is the banker, who helps with the transactions of paying fees, rents, properties etc.

Unfortunately, the banker is also a player at the table (banker = Government). This banker always happens to be the worst/dumbest/unethical player one could ever be forced to play with.