The European markets, the British pound, and Euro had rallied for six days prior to its’ meeting based on political polls. These polls were showing that the vote was too close to call. The market incorrectly interpreted this as meaning that the “Remain” side would prevail. The British pound hit a new a year-to-date high last Thursday, June 23rd, 2016, the day of the election. Banks had done especially well in the rally, some being up by almost double digits during their best days. After the Brexit vote, they experienced a massive ‘selloff’.
I prepared my readers in advance of “BREXIT”
Right now, everything is still rebalancing from the “Brexit” vote. The “mass media” will talk about how it will affect the Eurozone and its’ impact on the world for the remainder of this week. The experts will blame “BREXIT” for this decline, but that is only ‘the symptom’.
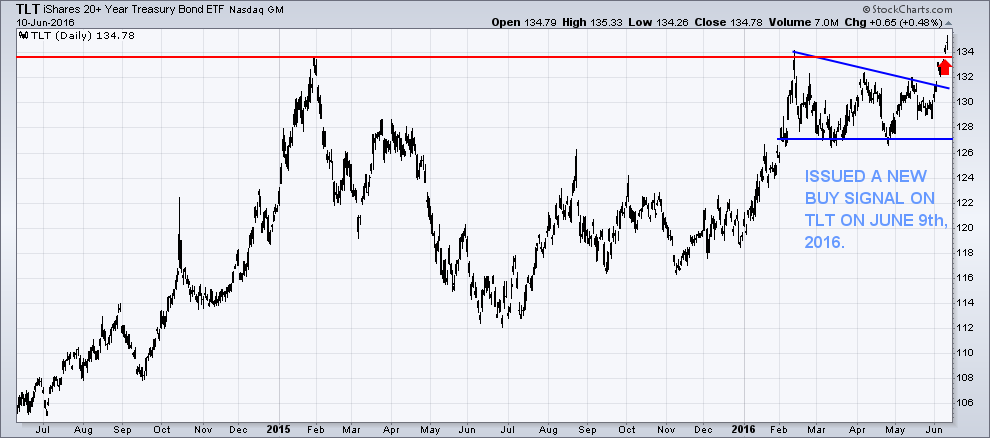
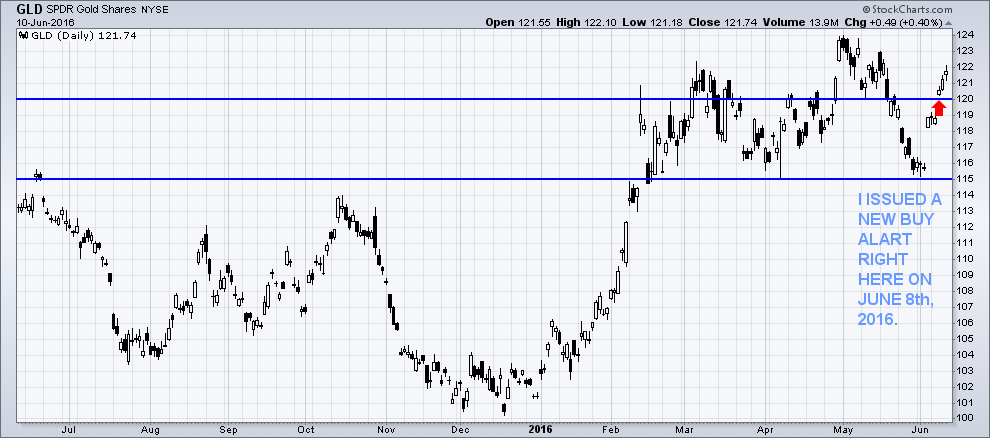
I sent a ‘trade alert’ to my subscribers on June 8th, 2016 to enter the long position of gold, using the most liquid and most traded ETF, “GLD”, and on “Black Friday” our position was up 5%. Another ‘flash alert’ was sent out on June 9th, 2016 to enter the long position of U.S. twenty year bonds, using the most liquid and most traded ETF for U.S. Bonds, “TLT”, and our position is deep in profits also.
Most hedge funds and money managers experienced heavy losses because they tend to be much more heavily weighted in equities.
As small traders and investors we can be much nimbler and are not forced to hold various positions in equities like most funds. Knowing that we have an added ‘edge’ and if you follow my lead ETF alerts my strategies can help keep you on the right side of all the markets.
Over the next 3 to 5 years, I will present very ‘unique’ opportunities to not only protect your wealth, but to grow your trading account handsomely using my “Cycle Analysis” and my “Predictive Analytics Models”
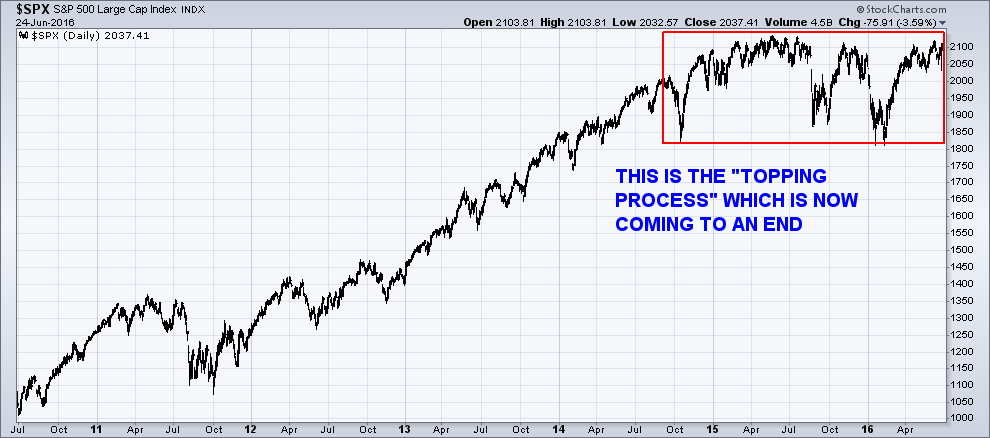
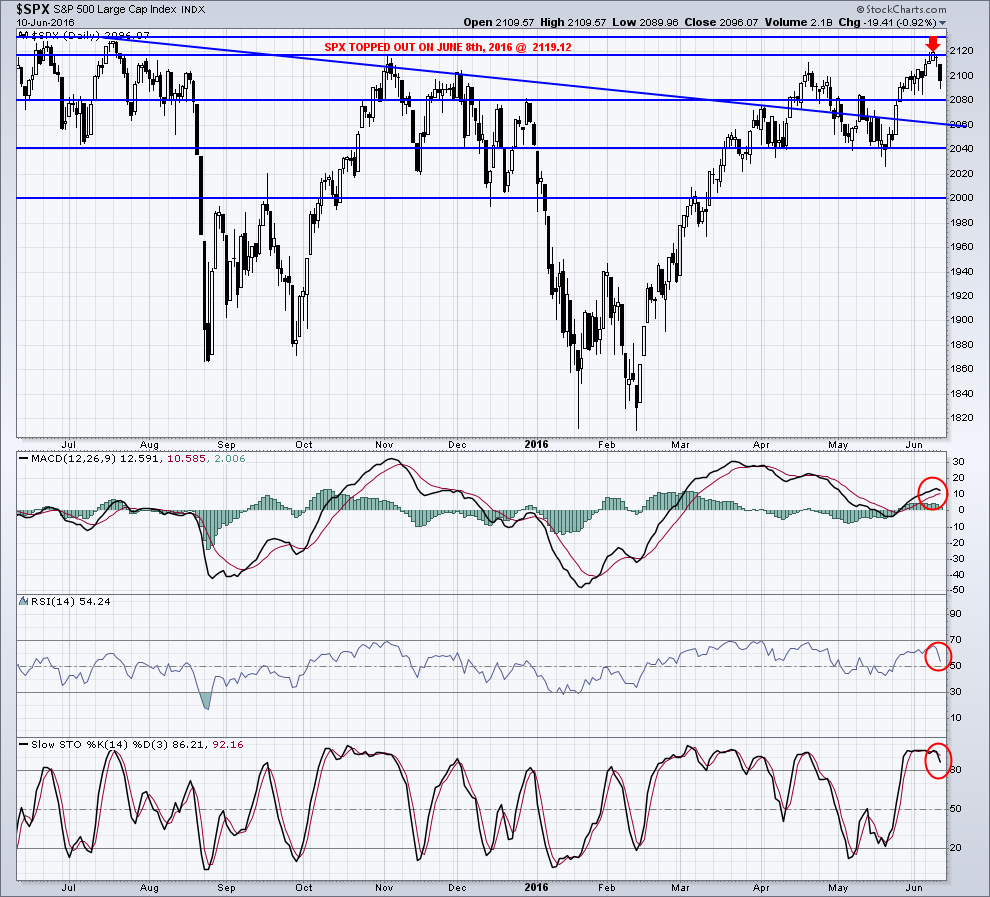
The SPX could not break out of its’ resistance ‘zone’. It has not been able to get through for over a year and a half and this is typical of a ‘long-term topping pattern’.
This week stocks have rallied huge. Why? It could be for many reasons like: end of month window dressing by the institutions, pre-holiday rally, the market was oversold earlier in the week so a bounce should be expected.
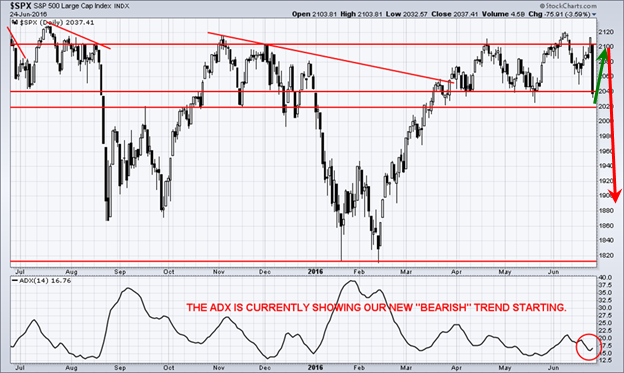
A new Sell Signal is on the rise for stocks. If this is the outcome, then it should continue to sell off down to 1830 level over the next 30 days.
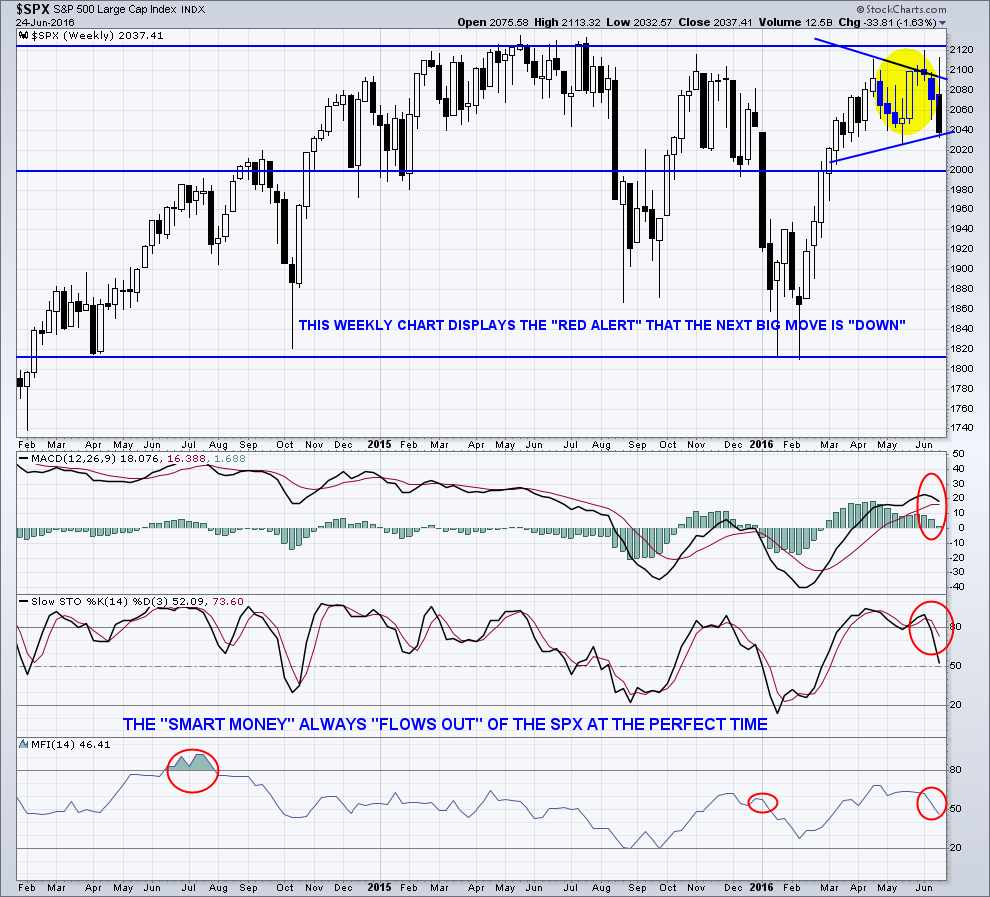
This should look very similar to the ‘sell off’ that occurred back in August 2015. The selling pressure drove the SPX to previous support. In this area, it is a reasonable location for support to now show up. The SPX has not broken out of the established channel over the last few months. On the weekly chart of the SPX there is also channel starting at 2000 up to 2100. Momentum oscillators on the weekly chart suggest the beginning of the channel rollover.
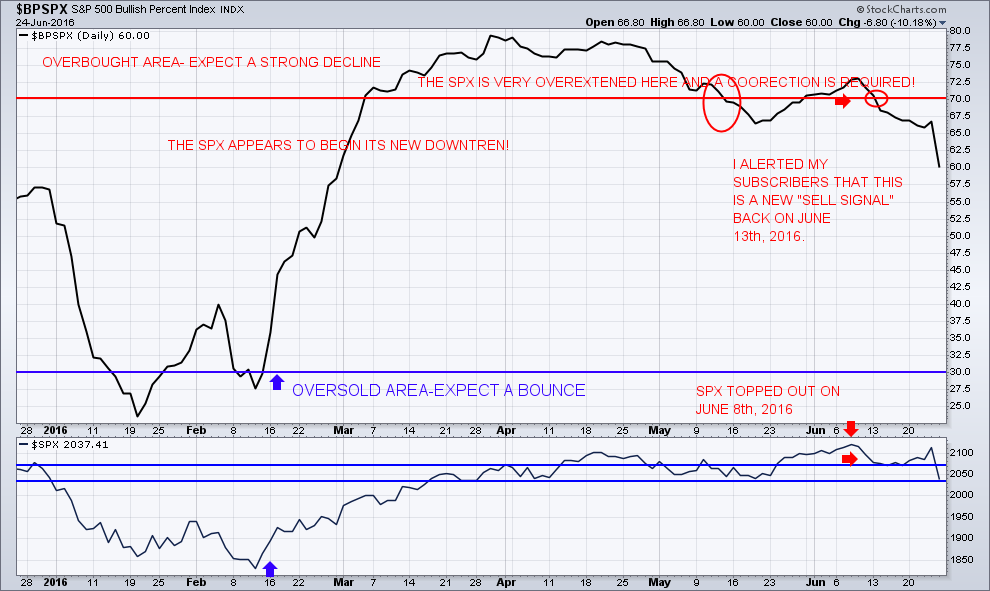
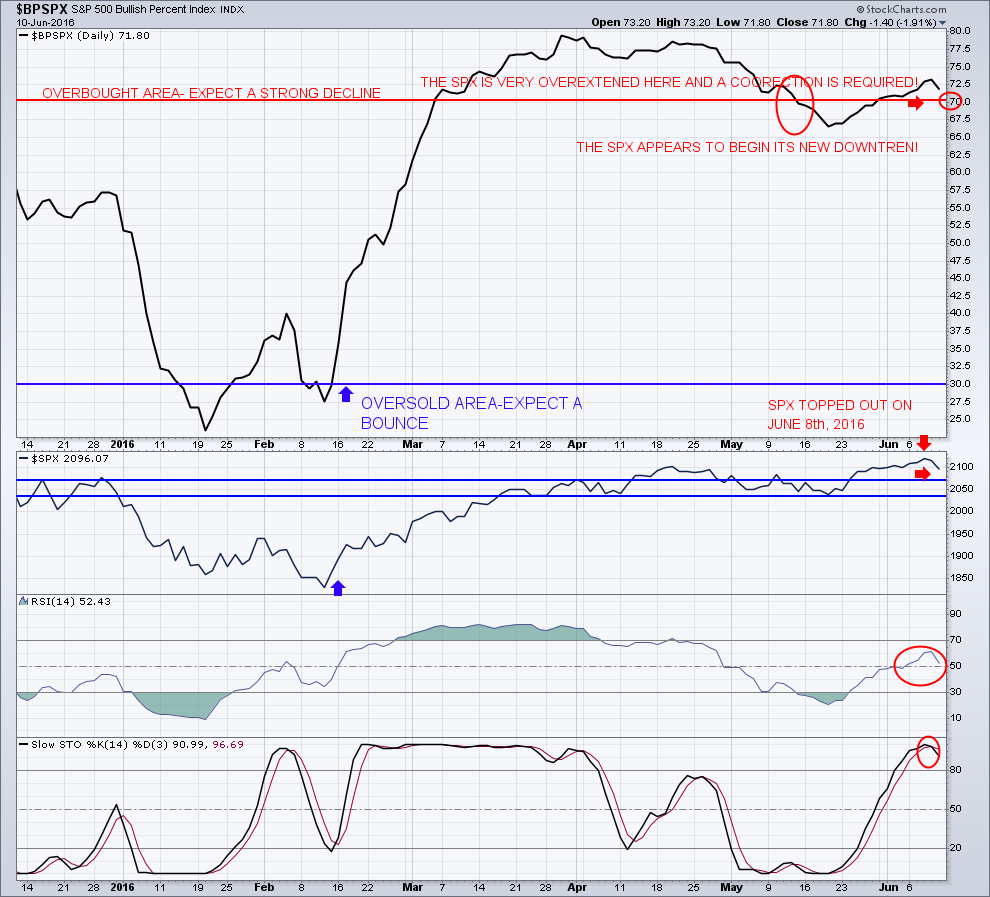
The Only Chart You Needed to See:
The Bullish Percent Index (BPI) is a breadth indicator based on the number of stocks on Point & Figure buy/sell signals within an index. The index is either on a P&F buy or sell signal, there is no ambiguity when it comes to this chart reading. This makes The Bullish Percent Index (BPI) fluctuates between 0% and 100%.
Bear Alert: BPI is above 70% and then declines below 70%.
Concluding Thoughts:
Expect greater volatility because of uncertainty regarding the “bearish sentiment” along with lower prices starting early next week.
https://thegoldandoilguy.com/wp-content/uploads/2016/06/wrong.png373960adminhttp://www.thegoldandoilguy.com/wp-content/uploads/2014/11/tgaoglogo.pngadmin2016-06-30 16:00:102016-06-30 16:11:34The market is reading it wrong!
Find out what to expect from the markets this summer for stocks, oil, gold and more importantly gold miners…
https://thegoldandoilguy.com/wp-content/uploads/2016/02/Radio.jpg473560adminhttp://www.thegoldandoilguy.com/wp-content/uploads/2014/11/tgaoglogo.pngadmin2016-06-29 11:23:032016-06-29 11:23:03US Dollar & Gold Attractive with Jumpy Markets
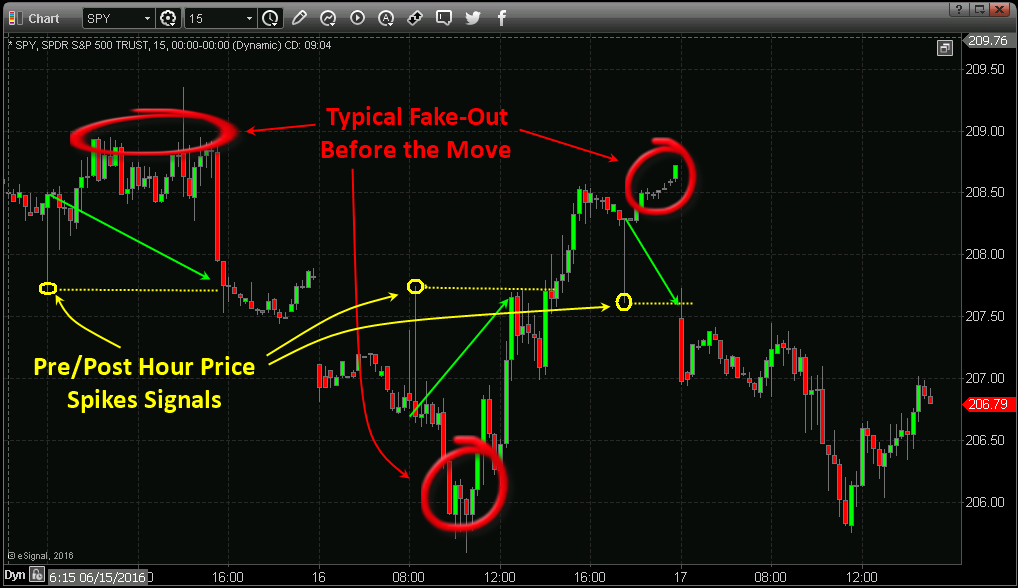
The last few days the volatility index has jumped dramatically and so have the market-makers secret price spikes during pre and post market hours telling us where they are trying to move the market to within the next 24 hours.
Below is a chart showing this weeks spikes which I plan to start covering in more detail along with a training video on how to find, read and trade them.
The key with these small yet highly accurate trade setups is leverage. While they may not look like huge moves, when you apply leverage like using the ES mini futures contract these moves can generate $250 – $1000 within hours several times a week.
These are short term momentum and day trades, and the spike signals tell us the market direction/bias for the next 24 hours which is incredible insight.
If you want to know the big picture analysis you can see my economic and stock market cycles HERE, or listen to my recent radio interview HERE.
Stay tuned for more exciting trade ideas and setups!
Chris Vermeulen
https://thegoldandoilguy.com/wp-content/uploads/2016/02/spikemetal.jpg350350adminhttp://www.thegoldandoilguy.com/wp-content/uploads/2014/11/tgaoglogo.pngadmin2016-06-17 15:27:492016-06-17 15:28:47Price Spikes Are Back With Vengeance
https://thegoldandoilguy.com/wp-content/uploads/2014/04/golf-forecast-video.jpg225225adminhttp://www.thegoldandoilguy.com/wp-content/uploads/2014/11/tgaoglogo.pngadmin2016-06-15 07:08:232016-06-15 07:09:03Don’t Be Surprised by a Summer Doldrums Crash
This “distortion” between “risk” and “return” has created a “bubble” effect in all global equity classes. I informed my subscribers to exit the SPX on November 25th, 2014 and to enter cash. Their equity risk exposure was reduced to zero. Momentum oscillators are now extremely overbought and are very clearly trending bearish. I wait for confirmation before entering any new long SDS and long VXX positions.
This week (Tuesday) there is another FOMC meeting. The news of this monetary policy will be released on Wednesday, June 16th, 2016. Expect choppier price going into the meeting and shortly thereafter.
The Only Chart You Need to Read!
The U.S. markets failed to break out!
Daily Chart Of Bonds
The bond rally set a record high in the rush to a new “safe haven”. We are now experiencing a global rally in government bonds’ which broke out last Friday, June 10th, 2016, while equities declined. We entered this new long term trade on for bonds.
Daily Chart Of Gold
Nothing will stop this new bull market in gold and silver. We entered this new long term trade on June 8th, 2016. Now there is a stampede into this much talked about “asset class”. Just take a look as the chart of gold below.
In short, the major trends of all asset classes which have been in place for several years are coming to an end. The majority of investors have no idea what is starting to take place and will do what the masses do every time a new bear market takes place. They will hold their positions, watch the value of their nest egg get cut 30-60% in size, and then give up and exit equities near the bear market lows 6-18 months from now. It is unfortunate, but technically we need the masses to do what they always in order for things to unfold in a controlled fashion. In a recent post, I showed where the financial markets and sectors are within this major economic cycle.
There are some new trades I will be taking very soon with my money and subscribers. If you want to be in tune with the markets and profit during chaos, then you should think about joining my morning daily video newsletter and ETF trade alerts service: www.TheGoldAndOilGuy.com
Chris Vermeulen
https://thegoldandoilguy.com/wp-content/uploads/2016/06/selloff.jpg485840adminhttp://www.thegoldandoilguy.com/wp-content/uploads/2014/11/tgaoglogo.pngadmin2016-06-14 09:50:272016-06-14 09:50:27Sell Off Coming!
Gold has a clear presence to play out in this new world, which is now dominated by global economic uncertainty. Gold’s importance in today’s environment was clearly visible during the massive rally at the beginning of the year, when all other asset classes were tanking.
What does this mean for gold going into 2017 and beyond?
https://thegoldandoilguy.com/wp-content/uploads/2016/06/gergold.jpg93151adminhttp://www.thegoldandoilguy.com/wp-content/uploads/2014/11/tgaoglogo.pngadmin2016-06-13 16:42:382016-06-13 16:42:38Gold Shines In A World Of Negative Interest Rates
This past Friday, June 3rd, 2016, The Bureau of Labor Statistics released their most recent report regarding new employment data and nonfarm payroll employment which indicates that during May of 2016, it was the smallest increase seen in 28 months.
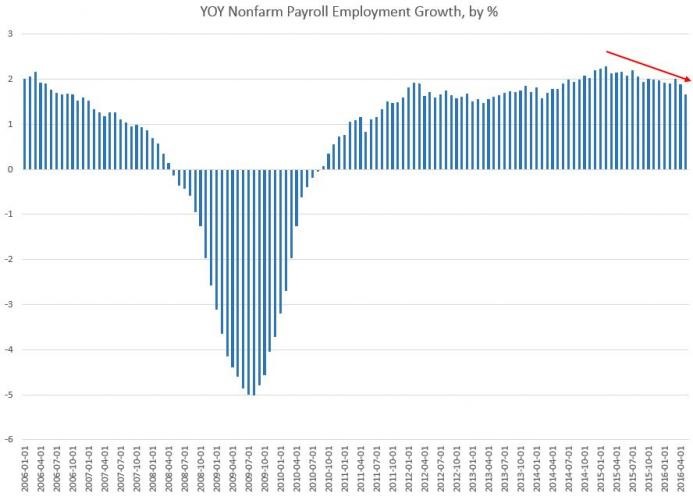
During May of 2016, there were 144,592,000 payroll jobs within the US, which was up by 1.6 percent, or equivalent to 2.3 million jobs, from May of 2015 (These are all not-seasonally-adjusted numbers).
That represents the smallest year-over-year increase that has been reported since February of 2014, at which time payroll jobs increased by 1.57 percent. The largest year-over-year increase, in recent years, was reported during July of 2015, when it was up by 2.18 percent:
Since July of 2015, the general trend in growth has been down. This 1.6 percent remains well below where growth was during most of the 1990’s.
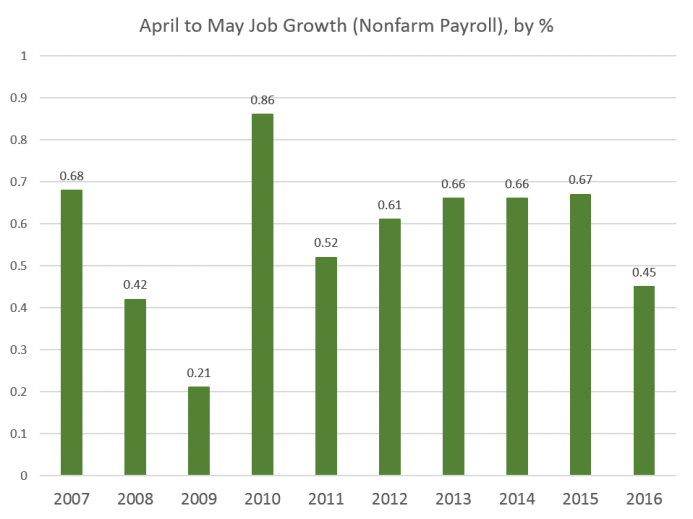
I am not fond of using the seasonally adjusted numbers, since they add an additional layer of ‘needless manipulation’. I do prefer to compare job growth, from the same time of year, over several years.
When I do this, I find that the job growth from April to May of 2016, was the lowest April-May growth total since 2009:
From April to May of 2016, there were 651,000 new jobs added, which is a significant drop from that same period of time, last year when 947,000 jobs had been added. Over the past decade, this current year of 2016, in this measure, beats out only 2008 and 2009, both of which were years of ‘economic decline’. Therefore, May of 2016 was the weakest May on record, for job growth, in eight years.
The Secretary of Labor, Tom Perez attempted to blame everything on the Verizon strike. That is a nice “spin”, however, the strike does not explain the obvious ‘decline’ in the year-over-year numbers! The strike might explain why the May numbers dropped off as much as they did, however, it cannot explain the ‘trend’. It is a bit of a stretch to blame this drop from April-May of 2015 to April-May of 2016 on the Verizon strike.
Mr. Perez, however, attempted some other, even less convincing, claims as well, stating that the U.S.’s insufficient mandates on paid family leave means that fewer women are entering the work force, and therefore pushing down the jobs totals. Is this IMPORTANT? The answer is NO! These bad numbers merely reflect our current poor economic situation, today!
In any case, the overall trend should not be a big surprise, as it has always has been weak. It has been dependent on the FED and their low interest rates. In recent quarters, the FED has finally been backed into a corner and has become hawkish. Realizing that more rate cuts are unlikely to occur any time soon, the economy is not receiving the usual FED-manufactured stimulus which investors and companies have both become accustomed to. With the FED talking about the need to raise ‘rates’, who can be surprised that the “recovery” is nonexistent?
The financial news, of the past few weeks, had its cadre of regional FED Presidents attempting to sway markets into believing that the Central Bank was sure to ‘hike’ interest rates during this current month of June 2016.
The jobs report sent ‘shock waves’ throughout the entire financial system. The report printed a jobs number of just 38,000 new employees, which is the lowest single month since the height of the “Great Recession”.
What is even more ludicrous than this, is the fact that the unemployment rate fell to 4.7 percent seeing as 664,000 workers are no longer being counted and included, by the government, within the labor force.
The FED relies heavily on these ‘manipulated’ government jobs numbers, the idea of “data dependency” being used to determine when to ‘hike’ or ‘drop’ interest rates shows the incompetency of a body that supposedly employs hundreds of economists who are dedicated to discover the true state of the economy and of its’ economic data. This in turn, should provide Americans with the reality that not only does the Central Bank have any idea what they are doing, but, more often than not their policy decisions are based on ‘incorrect’ and ‘outdated’ models which have only served to make matters worse, since the “Credit Crisis of 2008”.
The majority of jobs created were either part-time or low-wage service sector oriented. You can bank on the fact that the FED is now more likely to lower ‘rates’ than they are to raise them, going forward!
Today, it is both unlikely and irrational for the FED to raise interest rates either now or in the near future, despite the Central Banks’ recent “moral suasion” on mass media, of a potential rate ‘hike’ occurring as early as this month or possibly next month. The FED continues to create policies in an attempt to protect the economy and stock markets through November of 2016 so as to “spin” the election in favor of Hillary Clinton. This is due to the uncertainty from the presumptive Republican candidate, Donald Trump, who may force the Central Bank into ending its’ mission to fuel ‘stock and housing bubbles’. I, myself, as well as many economists, are seeing the ‘Summer of 2016’ as a dangerous period of time where and when a financial, economic, or monetary ‘collapse’ could take place from any number of ‘flashpoints’. The actions that are now taking place, in the equity markets, are an indication that these ‘fears’ may very well be arriving much sooner than most analysts expect.
The economy is still performing ‘significantly’ below its’ potential:
The problem is that the FED, including other Central Banks, have waited too long and gone too far in their ‘zero interest rate’ policies and ‘quantitative easing’ programs. With all of this nonsensical talk coming from the FED, the debt default levels, especially for credit default swaps on the 10-year Treasury are NOW at their highest level since the FED raised rates by a quarter of a point, back in December of 2015.
The probability of a U.S. default of its’ debt has hit its’ highest point since the FED has hiked rates in December of 2015. This is indicated by the recent dynamics in credit-default swap (CDS) agreements. The expectations that the Central Bank may raise borrowing costs still further, in the coming months, will set off this ‘time bomb’. Since the FED has turned increasingly hawkish of their policy outlook since late April 2016, market volatility has increased, with stocks swinging between gains and losses and U.S. Treasuries sliding along slide with the dollar. “Systemic risks” stemming from the CDS transactions are rising amidst the unfavorable global financial environment. This is not only true in the U.S., but its’ counterparts are also subject to greater turmoil in the coming months, as possible FED hikes, “Brexit” concerns, U.S. elections and faltering global growth are all interconnected factors thereby contributing to the recent spikes in U.S. CDS spreads.
If things follow the FED script, I imagine that next months’ payrolls will exceed ‘tapered down’ expectations and consequently, there will be an upward revision of Mays’ numbers. Will this continue sending the market into exuberance? NO! However, the FED officials will then restart the rate ‘hike’ talks with just enough offsetting uncertainties to mislead everyone while trying to keep the market ‘bubble’ from ‘bursting’.
The financial system is like a giant game of poker with all the major player holding a seven and two off suite (worst hand you can have), yet they are all-in with their chips (money & policies) trying to bluff their way out of this mess.
Things are going to be very crazy over the next 6-12 months and beyond, but until the US large cap stocks breakdown and start a bear market expect tough trading and investing.
Find out what I think the market is doing and where its headed with my ETF Trade Alerts: www.TheGoldAndOilGuy.com
Chris Vermeulen
https://thegoldandoilguy.com/wp-content/uploads/2016/06/jobsgrowth.jpg183275adminhttp://www.thegoldandoilguy.com/wp-content/uploads/2014/11/tgaoglogo.pngadmin2016-06-06 11:33:282016-06-06 11:33:28Don’t Bank On Rate Hikes!
As you know a picture is worth 1000 words so consider this short yet detailed post a juicy 2000+ word report on the current state of the stock market and economic cycle.
The charts below I think will help you see where the US stock market and economic cycles appear to be.
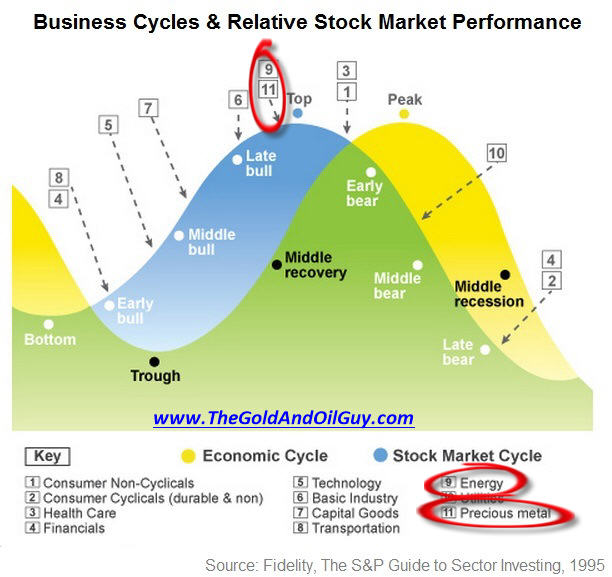
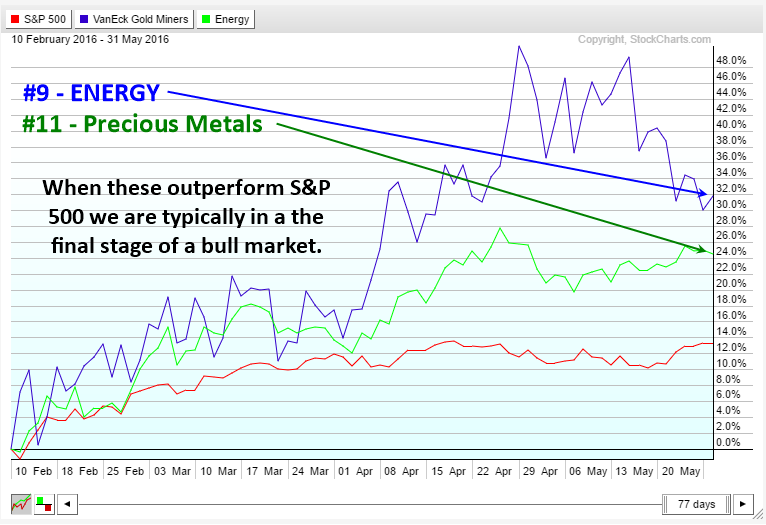
The first image shows two cycles, the blue one is the stock market cycle and which sectors typically outperform during specific times within the cycle. Here you will see that during the late stages of a bull market the safe haven plays become the preferred choice for investors – Energy and Precious Metals.
Typically, the stock market tops before the economic (business) cycle does. Why? Because investors can see sales starting to slow and that earnings will start to weaken and share prices will fall, so the market participants start selling shares before the masses see and hear about a weakening economy. The stock market usually moves 3-9 months before the economic cycle change I known by the masses.
Stock Market Topping According to Sector Analysis
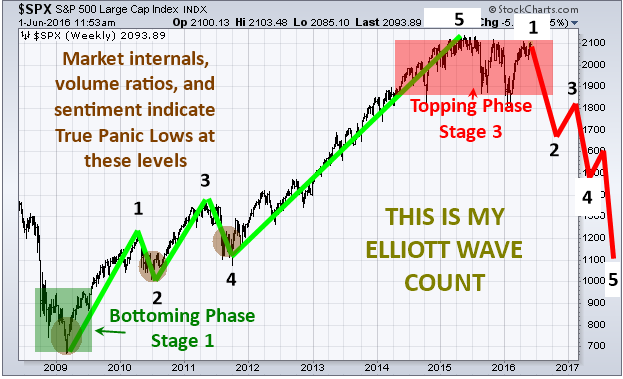
Elliott Wave Count – My Educated Guess
Elliott wave theory is a tough strategy to follow. Meaning, if you gave the same chart to 5 different people you would likely have 3 or 5 very different wave counts.
Recently I have seen a flurry of EW charts on the SP500 wave count which I do not think are correct. When I do Elliott Wave counts I like to use more than just price. I look into things deeper and use the market internals, volume flows, and overall market sentiment during those times. They must all be screaming extreme FEAR in the market in order for me to count it as a wave low.
Fear is much easier to read and time than greed. So based on waves of fear and I can plot the rest of the waves. By doing this, I feel it gives a truer reading of significant highs and lows we should use in our analysis.
See my analysis below for a visual… BUT REMEMBER:
I Use My Own Rules,
Which is Why Its Different Wave Count
Stock Market & Economic Cycle Conclusion:
In short, the current market analysis, in my opinion, is still very bearish and this could actually be the ultimate last opportunity to get short the market near the highs before we dive into a full blown bear market in the next 3-5 months.
I will admit, the market is trying VERY hard to convince us it wants to go higher as it flirts with the recent highs for its second time in the past 8 months. I know it is doing its job because so many traders and investors are changing their tune from bearish to SUPER BULLISH.
I don’t see it that way JUST yet, but it could happen as the market can do and will do whatever it wants. But all my analysis (much more than what you see here) points to substantially lower prices over the next year.
To learn more and get my ETF swing trades and long term investing signals join me at www.TheGoldAndOilGuy.com