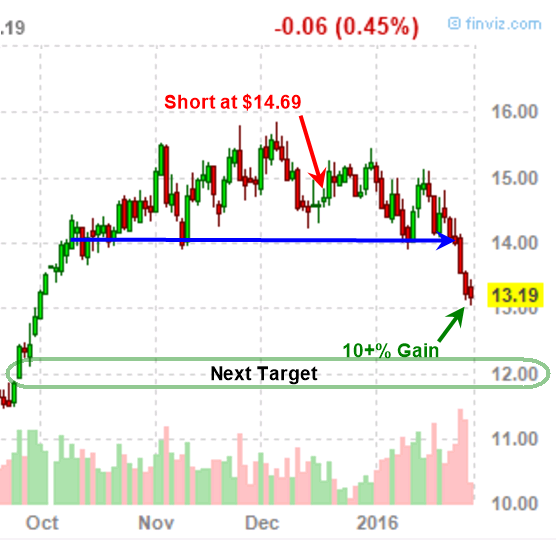
On Wednesday Jan 27th I wrote an article that gave you a picture perfect trade setup. The trade is on sugar or the SGG sugar ETF. As of this writing sugar is now over 10% in our favor from the original entry and trading at short term support.
This is a critical level to lock in partial profits and move your stop in the money for the balance of the trade to be safe. I just want to keep following up with this trade as many followers are in this trade with me.
Daily Chart of Sugar
As you can see in the chart below sugar price formation has turned bearish. With price breaking through support we have seen a beautiful wave of stops being triggered and traders selling their long positions.
There were a few ways to execute this trade. You can do what I do and trade the sugar contract using CFD’s. I do this with AVAFX as I like being able to trade smaller position sizes than that of a full futures contract. Or you can trade the SGG sugar ETF, you will need to have a margin account and be approved for short selling so we profit from price falling.
Sugar Trade Idea Conclusion:
In short, sugar was poised for a strong move down as mentioned Jan 17thRead Post. But now is the time to locking in gains and tightening your stop. This was a simple and profitable setup and there is no need to give back these gains.
If you like this type of trading: Slow, Simple, Logical, Tradable Ideas then be sure to watch my video and join me at www.TheGoldAndOilGuy.com
Chris Vermeulen
https://thegoldandoilguy.com/wp-content/uploads/2016/01/sugarticon.jpg200317adminhttp://www.thegoldandoilguy.com/wp-content/uploads/2014/11/tgaoglogo.pngadmin2016-01-29 15:25:012016-01-29 15:25:01If You Have A Sweet Tooth For Trading Its Pay Day!
As traders we are always on the hunt for new trade ideas poised and ready for big moves. And back on Dec 17th 2015 I shared a sweet trade idea publicly on my blog and other financial websites.
Now, as of Jan 2016 I would like to update on this trade because I feel one of the biggest moves for this trade is going to take place within a few days.
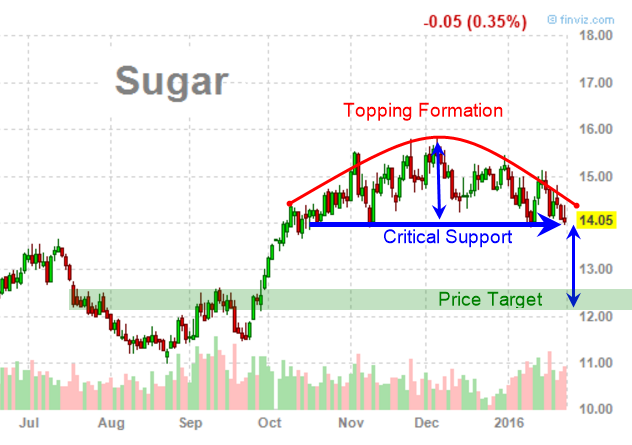
Daily Chart of Sugar
As you can see in the chart below sugar price formation has turned bearish. With price testing support once again we could very well see another bounce before a breakdown. Also, with Valentines just around the corner there could be some speculative buying in sugar in anticipation of an increase in demand.
We have seen some strong rallies the second half of February the last few years but not enough to call it any type of tradable trend if you ask me. And with REAL sugar not being used in anything anymore after being replaced with the fake chemical sweeteners it kind of voids the need for sugar during Valentines Day making it a wash.
There are a few ways to play this. You can do what I do and trade the sugar contract using CFD’s. I do this with AVAFX as I like being able to trade smaller position sizes than that of a full futures contract. Or you can trade the SGG sugar ETF, you will need to have a margin account and be approved for short selling as we want to profit from the falling prices.
Trading Conclusion:
In short, sugar looks poised and ready for a breakdown in price to test the $12.50 level over the next month. This is just one of many trades myself and fellow subscribers to my newsletter have taken recently.
Recently we have closed 10 trades and 8 of those were winners and we still have another winning trade open as of this article.
https://thegoldandoilguy.com/wp-content/uploads/2016/01/coffee.png224338adminhttp://www.thegoldandoilguy.com/wp-content/uploads/2014/11/tgaoglogo.pngadmin2016-01-27 07:07:072016-01-26 20:47:31The Sweet Holiday Trade Is In Play & In The Money!
January was the worst start of a New Year in the history of the US stock market.
Last week was one of the most intriguing weeks in global equity markets ever. As the week got started, there was a powerful sense of foreboding that stock markets around the globe were going to crash. Last Wednesday, January 20, 2016, many global indices were making new yearly lows, some of which had fallen below the 20% mark which have been associated with a new bear market.
Investors have been so scared and they pulled $24 Billion from their equity funds so far this month. They are fleeing into US Government funds shifted $5 Billion so far this year. This was the largest inflow of cash in over one year.
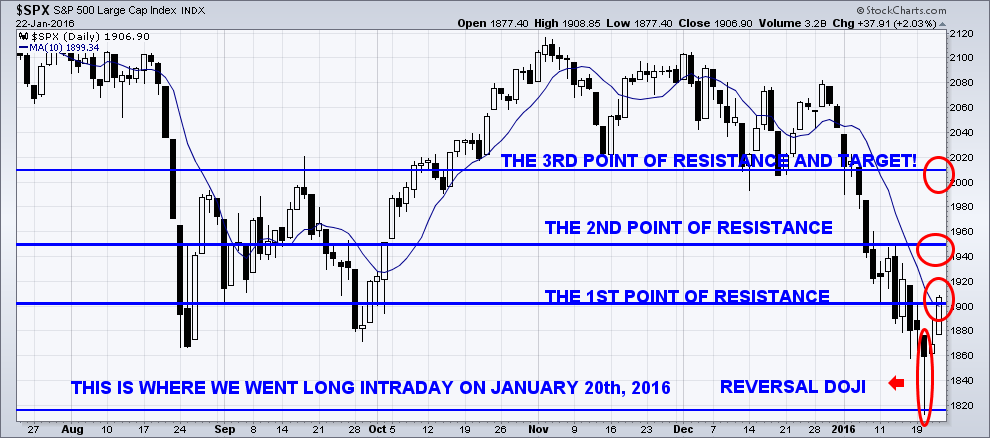
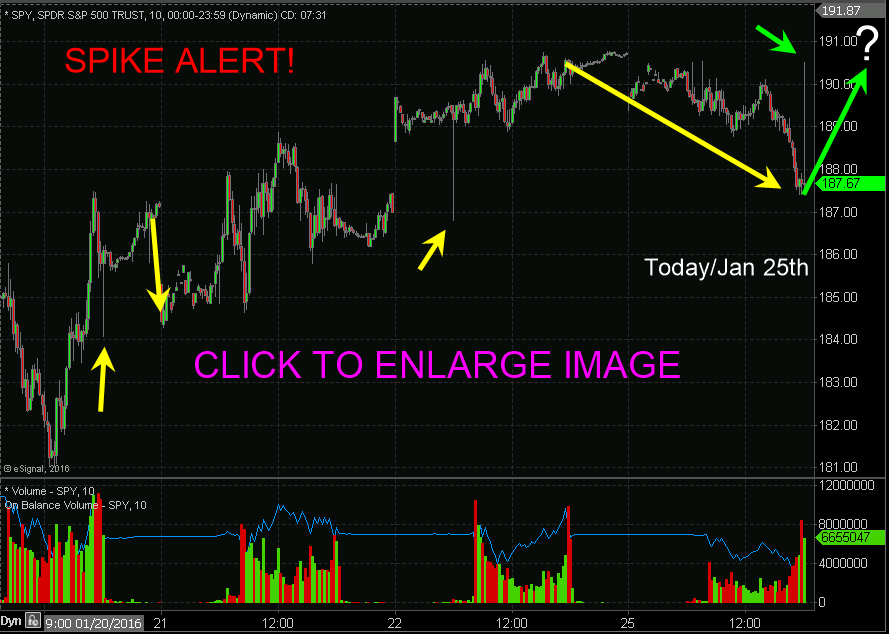
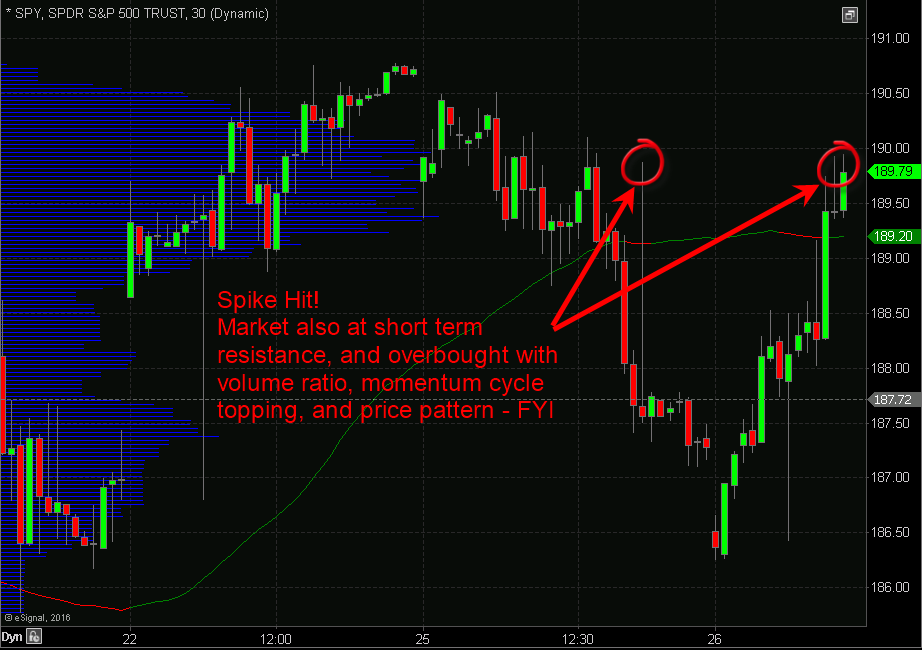
As I mentioned in last week’s article we should see the stock market stage a bounce or rally, and why this was a good price level for it to start. With everyone jumping off the ship bodes well that the market should go against the masses emotional trade. I took a long position on the SPY on Wednesday, January 20th 2016 with subscribers.
The SPX index took out the low of August 24, 2015, while the DJIA is still 600 points higher. The Dow Jones Industrial Average held above their lows of August 24, 2015 for a clear case of intermarket bullish divergence. This was validated last Friday, January 22, 2016, when each of these indices closed above daily resistance as the DJIA up over 200 points. That is not a bad recovery. However, maybe it was not so great when you consider that it had fallen 2300 points from the 17,750 high of December 29, 2015 just three weeks earlier.
The Asian markets, except the Chinese Shanghai Index, broke below its low of August 26, 2016 last week. It bounced back spuriously by the end of the week. The Hang Seng of Hong Kong fell to 18,534, its lowest level since June 8, 2012. The Japanese Nikkei plummeted to 16,017 on January 21, 2016, its lowest point since October 2014.
Now everyone is wondering if this is the end to the stock market decline? Will stocks resume their bull market? Do not be surprised to see a bounce up first from these levels.
Rallies in bear markets tend to be quite strong, fueled by short covering. Investors will be quite surprised this week as this is only a “counter trend rally” and not a “buy the dip” investment opportunity.
This big problem will become crystal clear to everybody in 2016. Oil is likely to continue to struggle, and China will continue its struggle. There is no money printing, and with a recent interest rate increase the stock market is inevitably going to go down. It appears likely that we will see a point when the Dow Jones is around 15,000, the same place it was at its peak in 2007. The worst has yet to come.
We are still going to have to face all the same problems. The continued debt crisis in Europe is unsolvable and the psychology of the financial community is going to be very bleak heading into 2017.
Debt, which is always the root of financial crises and their resulting economic contractions, didn’t go away. The financial system is even more dysfunctional than the one the U.S. was facing in 2007 to 2008. The Office of the Comptroller of the Currency, as of September 30, 2015 which insures U.S. commercial banks and savings associations, reported that they had exposure to $192.2 trillion notional (face amount) of derivatives. The report goes on to verify that only four banks hold 90.8 percent of all derivatives: Citigroup, JPMorgan Chase, Goldman Sachs and Bank of America.
January’s sharp decline, coupled with all the negative news regarding the stock markets, presents a situation where the market participants should go elsewhere with their investment capital.
Crisis always brings opportunities for those who can see the obvious realities. I am very excited about what’s starting to unfold. You will be presented with these opportunities to make more profits in the next 3 years than you accrued in the previous 9 years.
https://thegoldandoilguy.com/wp-content/uploads/2016/01/STPR500.jpg183275adminhttp://www.thegoldandoilguy.com/wp-content/uploads/2014/11/tgaoglogo.pngadmin2016-01-26 06:35:242016-01-25 15:54:51A Bear Market Rally or the Resumption of the Bull Market?
Here is a 1 hour radio show I was part of this weekend. You will see on the webpage the full “Hour 1” show audio option at the top, if you just want to listen to my section listen to “Segment 8” which is 10 minutes.
https://thegoldandoilguy.com/wp-content/uploads/2016/01/header.png70980adminhttp://www.thegoldandoilguy.com/wp-content/uploads/2014/11/tgaoglogo.pngadmin2016-01-25 17:23:242016-01-25 17:23:24I’m on the Weekend Korelin Economics Radio Show!
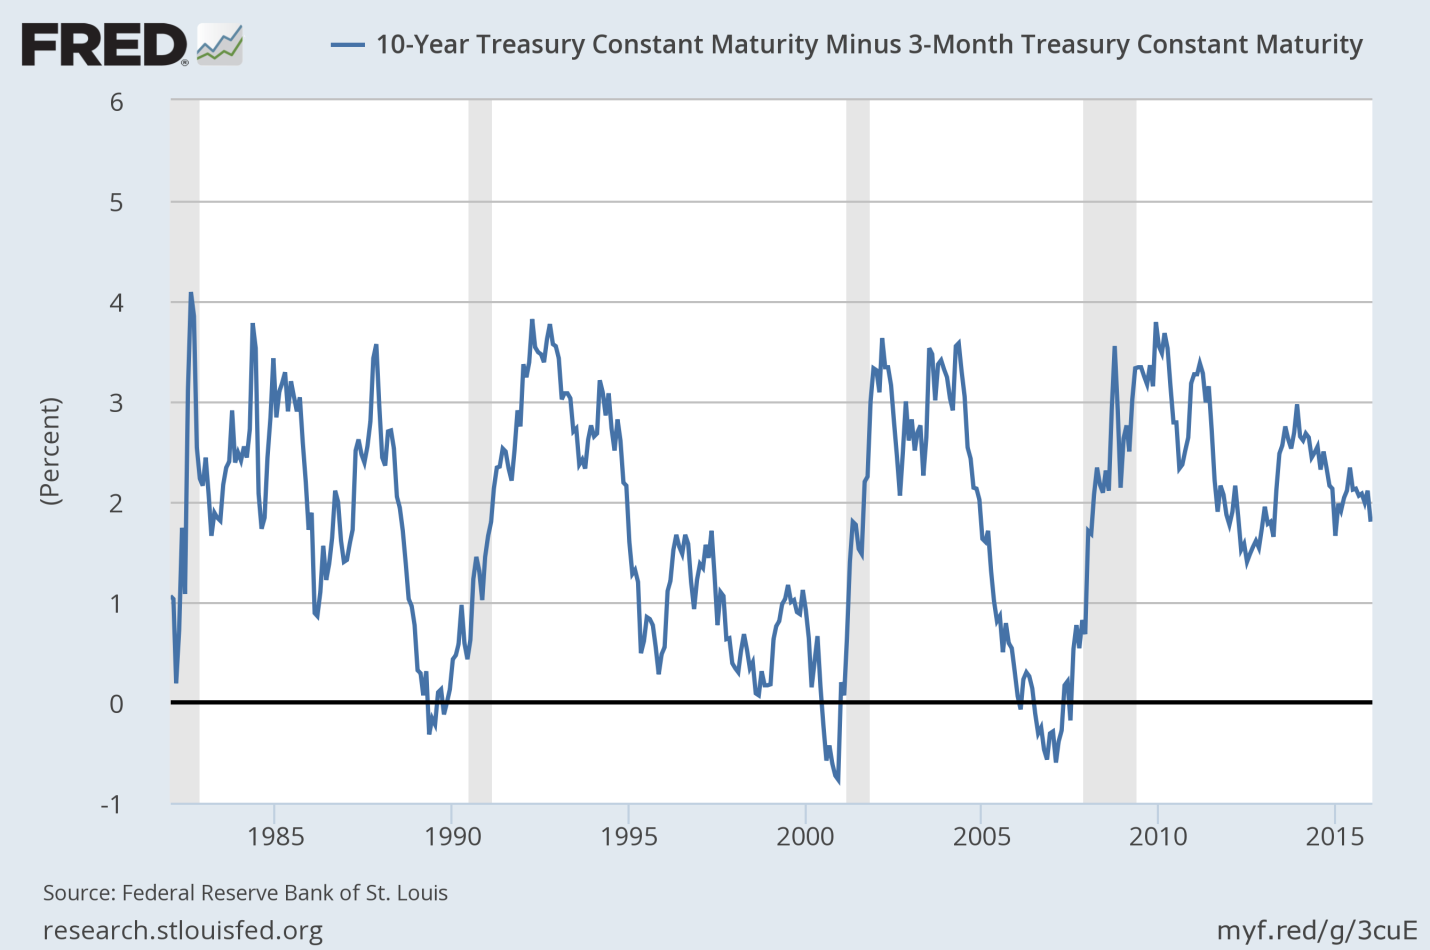
Every crash was preceded with the 10 year minus the 3 month Bond Yields dropping towards the zero line. Although the equity markets have crashed, the bond markets are still not displaying any signs of panic. This tells us the market must continue to fall until the percent return is around the zero mark.
Thinking of this logically, it makes sense. Investors when scare start moving more and more of their capital in to safer investments, like bonds. Eventually there is a change in this perception, which occurs when bonds are not paying anything in return. That is when investors say enough is enough, and start taking risk and start moving back into the stock market.
The indications from the bond markets should be respected, as they are a leading indicator.
The chart below is up to date as of Jan 19th 2016, and it’s clear that the masses (investors) have not yet moved their capital into bonds which drives the percent down.
Leading Indicator Conclusion:
In short, I think we have a long time yet before bonds start rocketing higher and the percent yield drops to near zero. I’m expecting a 6-18 month time frame, but we will know better once the large cap stocks start to breakdown and enter a bear market.
I will be sure to keep you informed with the market tops and bottoms as they unfold. Make sure you join my free email list and don’t miss my next important update!
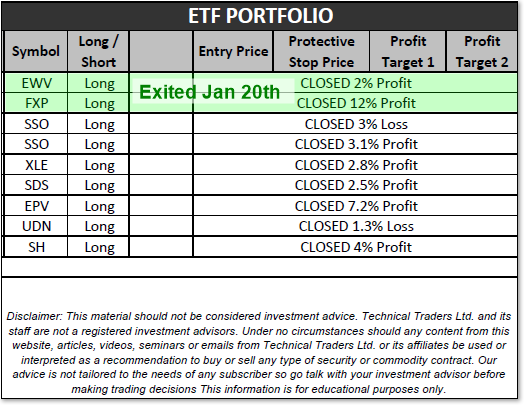
Check out our recent trades below and it does not include another trade we have profits on and are still in.
https://thegoldandoilguy.com/wp-content/uploads/2016/01/depression.png250374adminhttp://www.thegoldandoilguy.com/wp-content/uploads/2014/11/tgaoglogo.pngadmin2016-01-24 07:36:192016-01-22 15:58:23Leading indicator “Bonds” Suggests More Time before Crash Occurs
https://thegoldandoilguy.com/wp-content/uploads/2016/01/ttlogo.png373773adminhttp://www.thegoldandoilguy.com/wp-content/uploads/2014/11/tgaoglogo.pngadmin2016-01-22 08:41:012016-03-16 10:22:42How To Know Where The Next Market Top Or Bottom Is For SP500 Index
The future looks bleak for stocks and not just the US market, I’m talking about global markets are poised to enter bear markets which we have seen already started to see. Subscribers and I have been short the Japan and China market for several months and these two markets have dropped dramatically already and the bear market has not even started yet!
Just take a look at the chart below which shows the declining GDP in January. Real GDP is down the trend it’s not going to stop for a long time yet. The economic outlook appears dismal in the upcoming financial quarters and is likely part of the reason stocks have crashed in January.
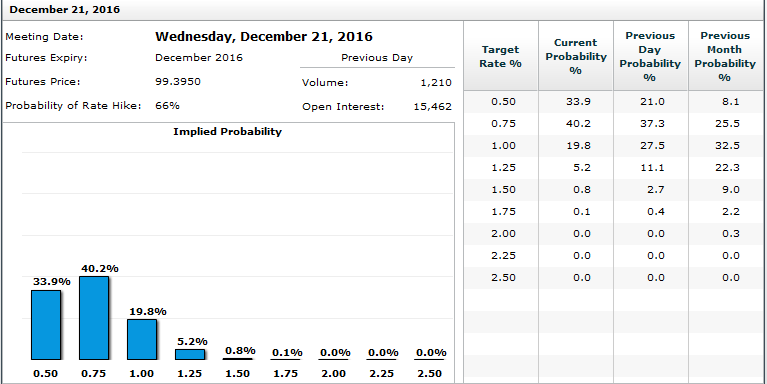
The Fed Fund Future Indicate another Minor Rate Hike in 2016
After the highly anticipated rate hike in December market participants have toned down their expectation of another FED rate hike in the near future. I believe that instead of another rate increase, the FED will start thinking about back-peddling to correct their mistake of raising rates that definitely has created a reason to sell stocks. They did this during a time when the economy was and still is very “fragile”.
If you look back in history you will see clearly that the FED has the tendency to raise rates just before major corrections in the stock market. Or better said, they start to raise rates when the economy is still too fragile and they trigger the selloff in stocks.
John Williams, San Francisco FED President, said, “We got it wrong” referencing the earlier statement by FED officials regarding crude oil prices being good for the economy.
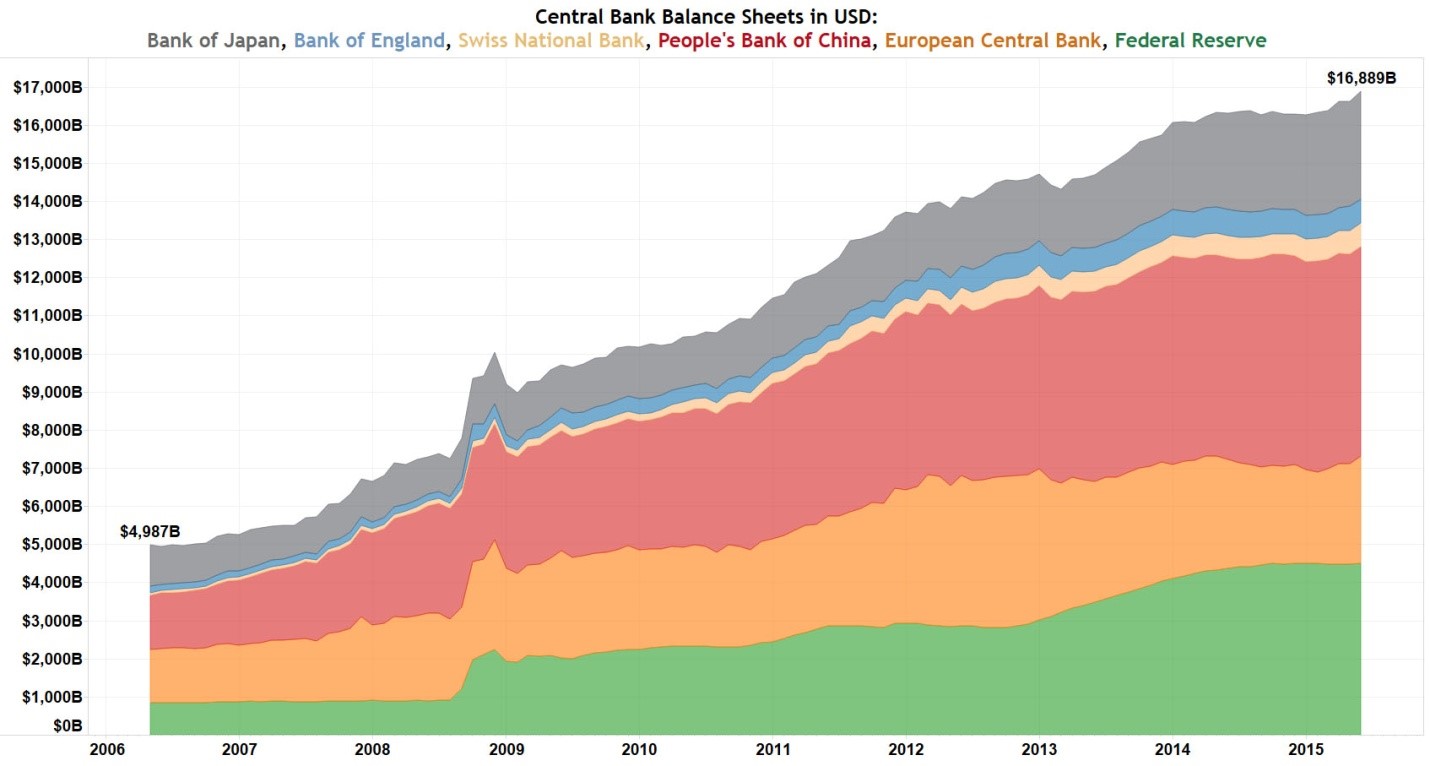
The FED is Not the only One with Easy Money Policy
This graph clearly shows how the US FED, the ECB, the Bank of Japan, People’s Bank of China, the Bank of England and many other nations, have been implemented an easy monetary policy at the same time as the FED.
Remember all markets are linked so when one has an issue so to the others. In 2008/09 it was not just the USA having financial issues, it was a global issue and many countries started easy money policies to help their economy stabilize. It just some counties have different ways of doing things and many don’t openly share what they are doing as they don’t want to show signs of weakness.
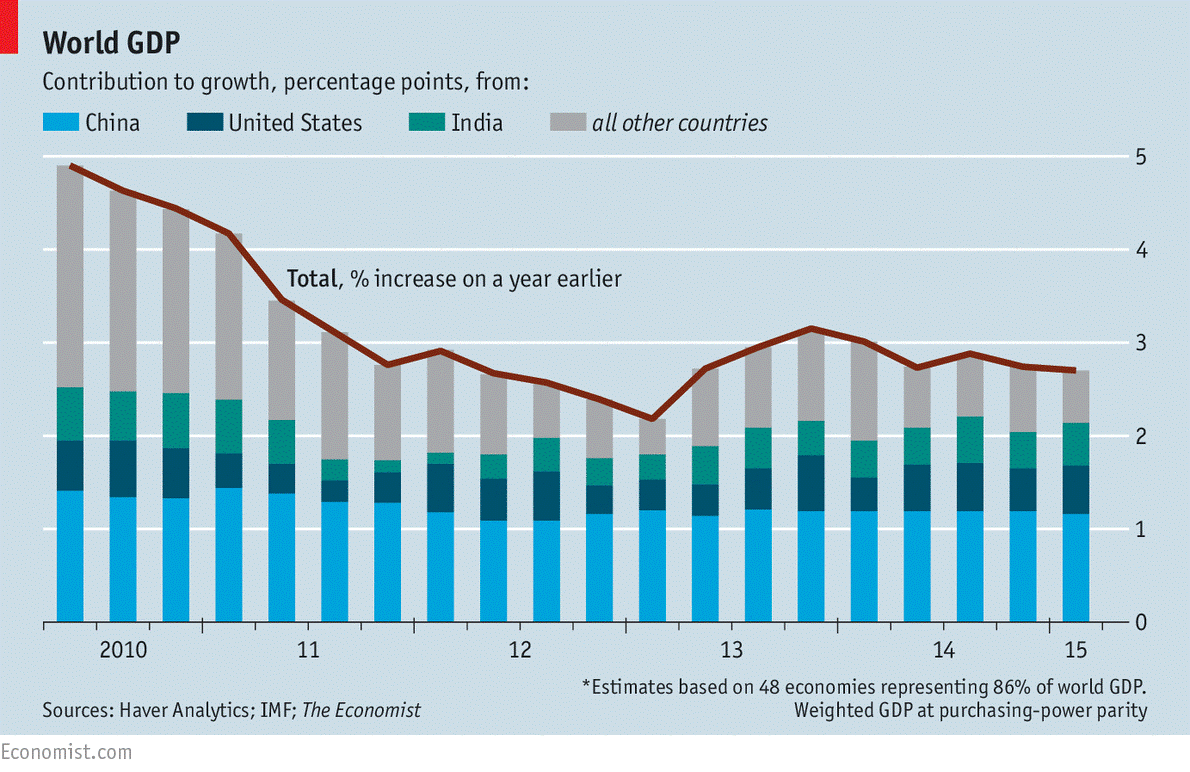
WORLD GDP
World GDP continues to decline even with global efforts of many countries trying to help boost the economy. The world is struggling and is going into “economic contraction” which could plague us for many years. China slow growth trajectory is likely to continue and the US forecasts are also pointing to slowing growth. The odds favor that the growth in 2016 will be much lower than what has been currently reported.
Look at the graph below to see the global GDP line falling.
Concluding Thoughts:
In short, all this negative talk about the world economy is depressing and not what we all want to hear, see, and worse – live through.
Let me mention that for every negative there can be a positive outcome. And this this case, when the stock markets crumbles and the economy falls into the gutter there is a way you can profit from the event. In fact, when the market crashed in 2008 many of us made a fortune from the falling stock prices and weak economy.
In my next article I will share how I made a couple million dollars from my computer during a time when 95% of individuals lost half of their life savings and their homes. But you must optin to my free newsletter at www.GoldAndOilGuy.com to receive this special report!
Chris Vermreulen
https://thegoldandoilguy.com/wp-content/uploads/2016/01/gdpicon.gif250575adminhttp://www.thegoldandoilguy.com/wp-content/uploads/2014/11/tgaoglogo.pngadmin2016-01-20 13:08:502016-01-20 13:08:50Latest GDP Forecasts Confirm Things Will Get Ugly
Dramatic drop in Canuck Buck predicted a year ago.
Oil testing $27 target predicted months ago.
Washout low in miners just starting – Bottom is Near!
https://thegoldandoilguy.com/wp-content/uploads/2015/05/cvinterview.png151210adminhttp://www.thegoldandoilguy.com/wp-content/uploads/2014/11/tgaoglogo.pngadmin2016-01-20 12:21:542016-01-20 12:38:20Most Stocks a Bad Investment This Year
Technical Evidence Indicates Major Price Movement Just Getting Started!
Stocks around the globe were pummeled again last week.
This is no surprise to our subscribers as our predictive trend analytics model gave us clear technical evidence that important multi-year highs had completed back in the middle of 2015.
I continue to remain steadfastly bearish in my outlook for stocks.
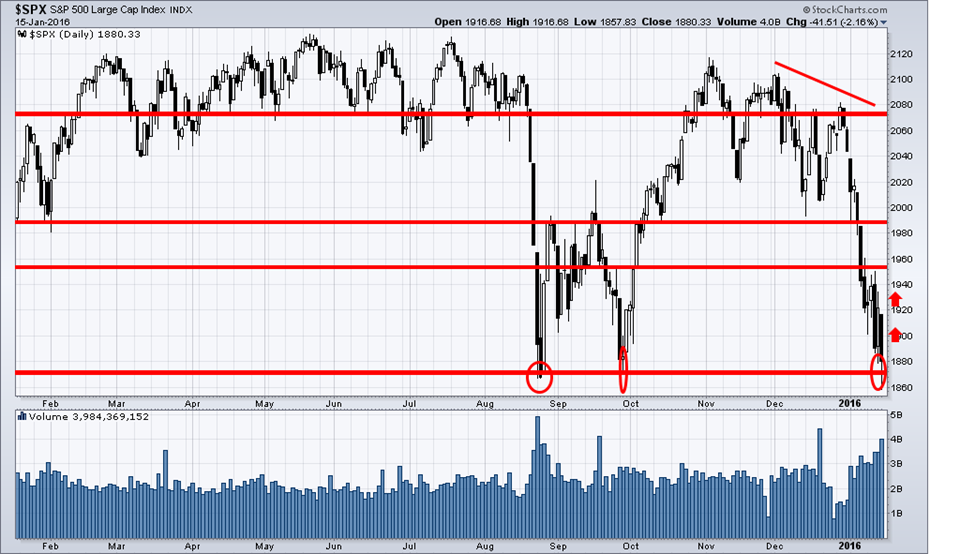
Last Friday, January 15, 2016, the SPX broke below its Aug. 24, 2015 low, which is equivalent to a major sell signal if price closes the month below that level.
Last week, The Dow Jones Industrial Average slumped 511 points, or 3.1%, to 15,866, while the S&P 500 slid 64 points, or 3.4%, to 1,856.34, led by the financials, technology and energy sectors. The Nasdaq Composite tumbled 190 points, or 4.1%, to 4,424.35.
Subscribers and I managed to catch a 33% quick intra-week bounce trading the SSO ETF and then got out of harm’s way as volatility took hold once again.
European stocks were unable to escape the downward trend from other markets, and the Stoxx Europe 600 index lost 2.8%. The dollar fell to a one-year low vs. the yen. Gold rose $22.40, or 2.1%, to $1,096.20 an ounce.
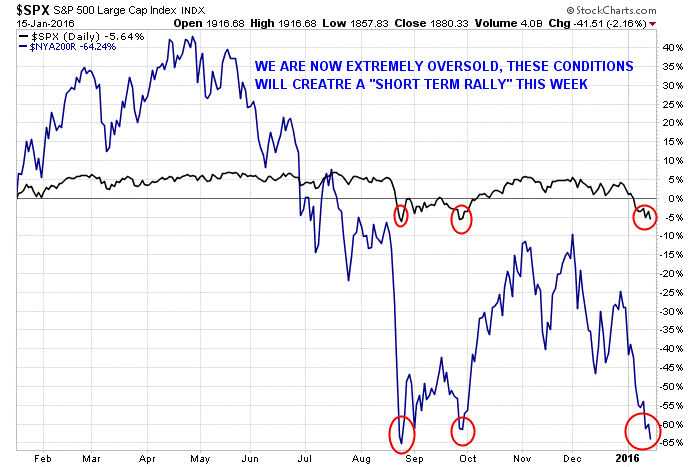
The SPX is currently testing major support. This is consistent with a “cycle low” that arrived over the weekend. Even though we are in a bear market, we should expect a “Bear Market Rally” sucking every last investor into long positions, before dropping much lower through previous support areas. This will be a very “short term bottom” this week.
We are in a long term downtrend now; it is not a “hiccup” as we experienced back in 2012.
If the stock market is going to stage a rally from here, this is a good time to start, right when everyone is jumping off the ship and the sentiment is so extremely negative. Just to give you a feel for the level of panic selling on Friday, my panic selling indicator which tells us when short term bottoms are likely to happen as everyone is running for the door, this contrarian indicator spiked to 50. Now any reading over 3 is panic in the market, and a reading of 9-18 is typically a multi week low. So you can see how 50 is VERY extreme.
Because we are entering a bear market and institutions will be unloading shares area record pace going forward, I feel this extreme level of panic selling (50) is only going to trigger a bounce lasting a week or so, then more distribution selling will take hold.
A slew of disappointing U.S. data shows that manufacturing and consumer spending are in trouble. Empire State factory index declined sharply this month to its lowest level since the recession. Retail sales declined by 0.1% in December 2015 and a report on industrial production compiled showed that activity declined for the third straight month.
The New Year is not off to good start. In fact, it may be the worst start ever of a New Year in many world stock indices. Instead off irrational exuberance that had previously been so evident, investors of world equity markets are clearly starting to panic.
We all know things are not right. We know it hasn’t been okay since the 2008 financial crisis. The effort by the central banks to get over the hump has fueled an “Asset Bubble” in the stock markets.
This in turn should start to fuel safe haven buying in gold. Gold’s day in the sun is soon approaching. I believe this new year will prove to be a pivotal year for gold, silver and miners.
The “talking heads” tell us that the stock market is falling because energy prices are falling. We need higher energy (gasoline) prices. Really? They claim that energy companies are going out of business and that tens of thousands of people will lose jobs and unemployment will rise. Really? Didn’t the jobs numbers show hundreds of thousands of people getting new jobs – in fields outside of energy? Who are you going to believe?
This week I posted an exciting video show you how to make a fortune during this pending bear market and exactly how I did this in 2008 – 2012 to become financially free before I turned 30 years of age – WATCH HERE. Stay tuned and be sure to opt into my free email list if you want to see this exciting, inspiring and educational video!
Instead of talking about the all the manufactured strong earning numbers created by share buyback programs, sales being way down for most companies, shipping companies struggling for products to ship, and products and service prices being reduced to help generate sales (deflation), let me share with you some monthly charts that I think paint a simple and clear picture of what is happing in the US stock market.
https://thegoldandoilguy.com/wp-content/uploads/2016/01/charts.jpg300580adminhttp://www.thegoldandoilguy.com/wp-content/uploads/2014/11/tgaoglogo.pngadmin2016-01-18 15:52:112016-01-18 15:52:11These Monthly Stock Charts Say It All