So far 2011 has been an interesting to say the least. Stocks and commodities have been jumping around with high volatility generating mixed trading signals. This choppy price action typically indicates trends are in their late stages. The late stages of a trend is very difficult to trade because volatility rises meaning larger day to day price swings, and at any time the price could either drop like a rock or go parabolic surging higher in value. Generally the largest moves take place during the final 10% of trend, but with a sharp rise in price keep in mind the day to day gyrations are much larger than normal, hence the false buy and sell signals back to back on some investment vehicles.

Taking a look at the charts it’s clear that we are on the edge of some sizable moves in both stocks and commodities. It’s just a matter of time before a correction is confirmed or this current pullback in stocks is just a dip (buying opportunity). I am in favor of the longer term trend at work here (bull market) but it only takes a 1 or 2 bid down days and that could change.

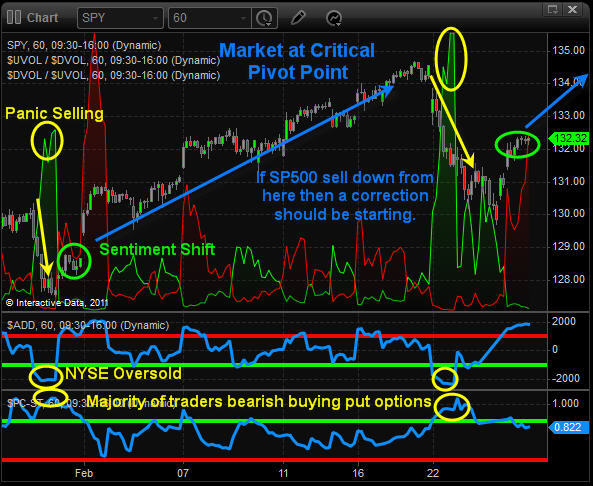
SPY (SP500 Price Action) – 60 Minute Chart

This chart shows intraday price action with my market internals. It is signaling a short term bottom within the overall uptrend on the equities market. The big question is if this is a just an opportunity to buy into this Fed induced bull market or the start of a larger correction?

Currently I am bullish but the next couple trading sessions could confirm my bullish view or a correction could be unfolding. Until then, we must remain cautious.

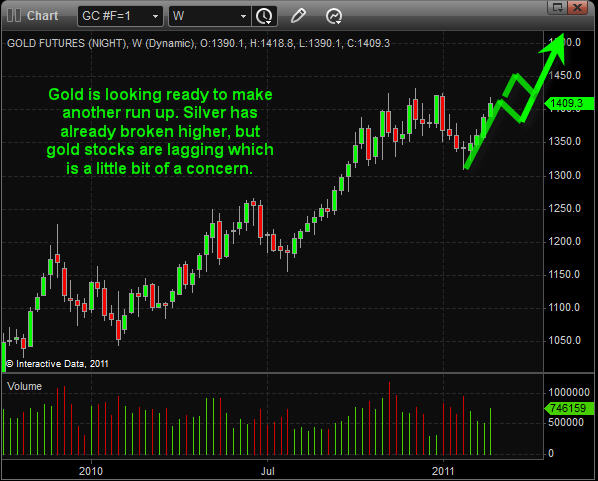
Price Of Gold – Weekly Chart

Gold has staged a strong recovery in the past four weeks. But it has yet to break to a new high. I do feel as though it will head higher because of the way silver has been performing (new highs). But it is very possible we get a pause for a week or two before continuing higher.

Because of the international concerns in the Middle East both gold and silver should hold up well even if the US dollar bounces off support. But, if the US dollar breaks down below its key support level we could see stocks and commodities go parabolic and surge higher in the coming months. It’s going to be interesting year to say least…

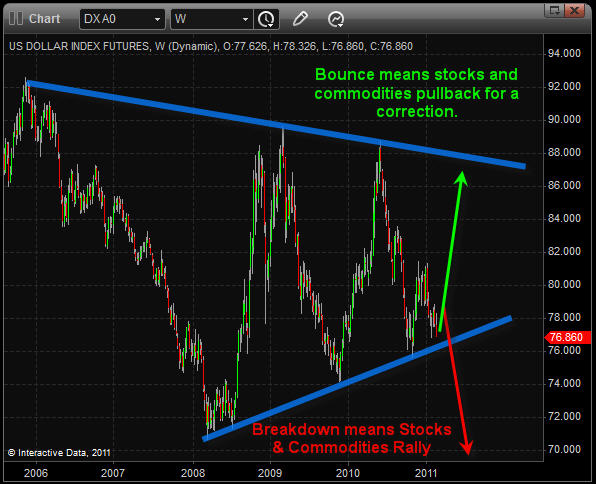
Dollar Weekly Chart

This long term view of the dollar shows a MAJOR level which if penetrated will cause some very large movements across the board (stocks, commodities and currencies).

In short, a breakdown will most likely cause a spike in stocks and commodities across the board which could last up to 12 months in length. On the flip side a bounce from this support zone will trigger a pullback in both stocks and commodities. This weekly chart is something we must keep our eye on each Friday as the weekly candle closes on the chart.

Weekend Trend Report:

In short, 2011 has been interesting but trading wise it’s has yet to provide any real low risk trade setups which I am willing to put much money on. There are times when trading is great and times when it’s not. It all comes down to managing money/risk by trading small during choppy times (late stages of trends), and times when we add to positions as they mature building a sizable portfolio of investments which I think will start to unfold over the next few months.

I continue to analyze the market probing it for small positions as this market flashes short term buy and sell signals.

Last week we say a lot of emotional trading and that typically indicates large daily price swings should continue for some time still so keep trades small and manage you positions.

You can get my FREE Weekly Analysis here: http://www.thegoldandoilguy.com/trade-money-emotions.php

Chris Vermeulen

?

Over the past few years Forex traders have really had to step up their game in order to continue making money in the currency market. Back in the day before currency trading was main stream, currencies used to trend in a direction for a long period of time with a low level of volatility. But with so many individuals now involved speculating on price action coupled with international concerns in most countries, the once slow and steady currency market now moves like the stock market with large price swings on a weekly and even daily basis.

With currency trading growing at an incredibly fast rate, stock traders have been giving tools to trade currencies using ETFs. If you are familiar with leveraged ETFS then you have most likely seen the huge opportunities (100,200 even 400% gains) which they can provide during major trends. Below are a couple major trends that both Forex and ETF traders should be keeping their eye on.

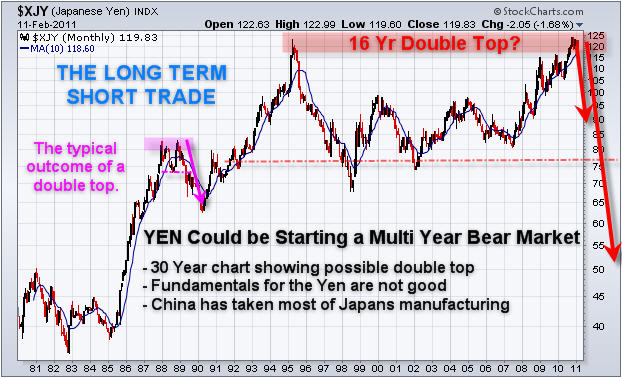
Japanese Yen – 30 year Monthly Chart
Over the last couple years China has taken most of Japan’s manufacturing, creating some terrible fundamentals overall for the Yen. With a weakening economy and the Yen making a major top in 1995, I feel we could be seeing a 16 year double top forming. This means shorting the Yen for a multiyear correction (bear market). This could generate some serious gains in the coming 2-5 years with very little work.

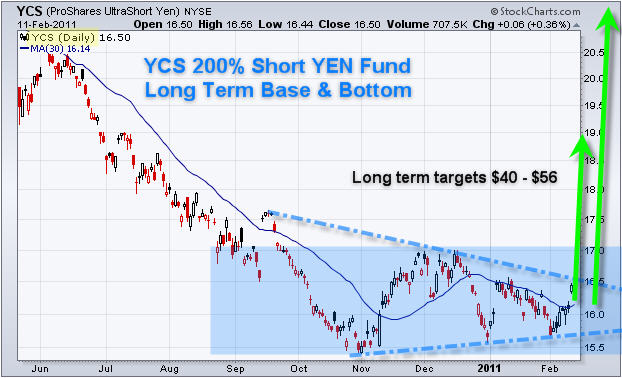
YCS 200% Short Yen Exchange Traded Fund – Daily Chart Setup
This fund allows stock/ETF traders to play the currency market within a regular trading account. The YCS fund is a 200% leveraged inverse fund, meaning this fund goes up in value as the Yen declines. For example, if the Yen drops 10% in value YCS will rise 20%.
Everyone has seen that infomercial to cook food with the saying “Set-It-And-Forget-It!” Well that’s more or less what this position will be like if we get a setup to buy this fund. This trade could easily last 5+ years with the potential to generate 150% – 400% gain.

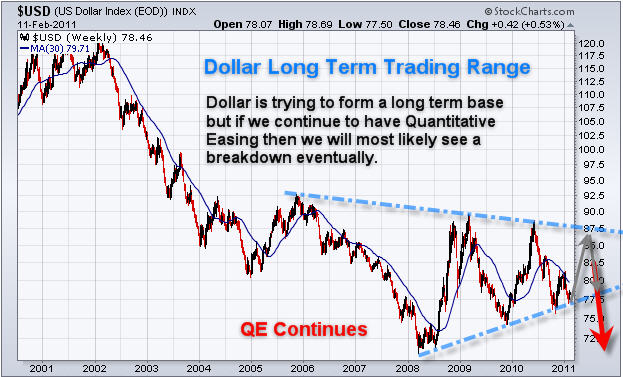
US Dollar Weekly Chart Setup
Taking a look at the more common currency “The Dollar”. It has been forming a similar price pattern and is trying to form a base and bottom. The dollar does have one major issue which will most likely cause a breakdown thus an even lower value in the coming year. The problem is that the fed reserve constantly prints money increasing the money supply and devaluing the dollar (quantitative easing).

Currently, the dollar is trading within a large range and is poised for a short term bounce. There will not be any major trends until a breakout of this trading range to either the up or down side.

Major Currency Trends for Major Gains
In short, while playing shorter term trends is exciting and rewarding and keeps us busy on a daily/weekly basis, it is nice to have some long term positions at work which slowly mature into large percentage gains which boost you’re overall portfolio value each year with little work. Both the Yen and Dollar look like there is big potential just around the corner using the buy and hold mentality.

Each year I find 3-5 major opportunities where I can put some money to work, not tie up much capital and if they move 150% or more in my favor then those small investments boost my overall yearly portfolio gains substantially.

I do have another major trend setup forming which I’m calling the “Holy Cow” setup… which could be a real money maker this year. The exciting thing about it is that I have not seen ANYONE talk about this investment in years…

Get my Trading Setups, Daily Pre-Market Videos, Intraday Analysis and Updates:
http://www.thegoldandoilguy.com/trade-money-emotions.php

Chris Vermeulen

The past couple weeks I have been keeping a close eye the price of gold and the gold miners index. I check to see if its pointing to higher or lower prices in the near future using inter-market analysis, price and volume, along with technical analysis. At this time the charts are still pointing to lower prices in the coming days or weeks.

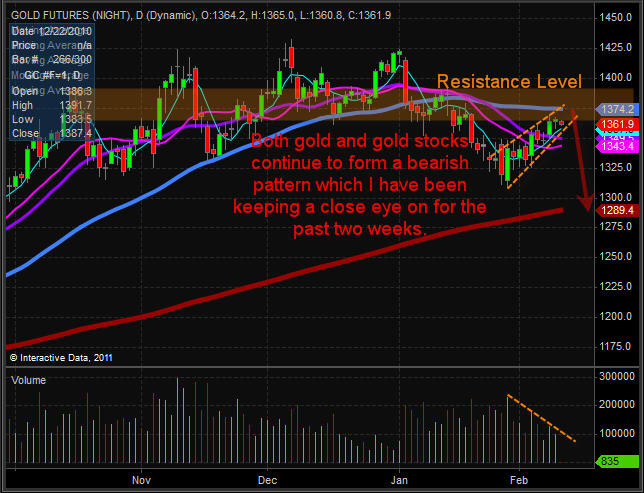
Taking a look at the daily chart of Gold
As you can see it has formed a bear flag with declining volume and the price has drifted up into a resistance level. This combination typically leads to lower prices.

With international fears floating around and the fact that inflation has started does make me a little weary of shorting gold but one thing I have learned over the years is that trading on fundamentals and news clips seen on TV is not a reason to pass on a setup if one forms in the coming days. The only thing that pays in the stock market is when the price action goes in your favor. This is why I focus on price, volume and momentum while avoiding what others are saying elsewhere. Trading is a numbers game and I put my money on the table when the odds are clearly favoring one direction. Unfortunately I am trading trades against what the masses think and feel is the right thing to do.

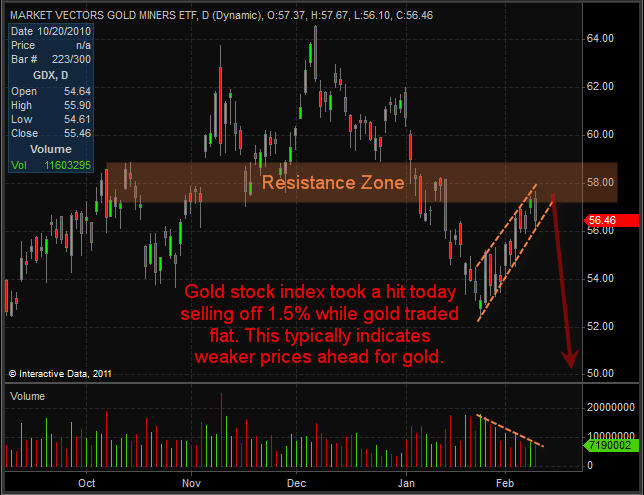
Gold Miner stocks are forming much of the same pattern as gold bullion but today (Wednesday) the chart actually put in a possible reversal candle. If this is correct then we should see gold and most likely silver follow suit tomorrow by moving lower and possibly even start a correction.

Gold Swing Trading Conclusion:
In short, gold stocks sold off strong today while both gold and silver closed only slightly lower. When this happens near a resistance zone, with a bearish price and volume patterns I start to look for a shorting opportunity. It has yet to happen and I’m not going to jump the gun, but I am waiting for the right opportunity to take advantage of these trading instruments.

If you would like to get my daily trading analysis and swing trade alerts please join my newsletter: http://www.thegoldandoilguy.com/trade-money-emotions.php

Chris Vermeulen

While Ben Bernanke says we are not seeing any inflation, I think most of us know that is a load of BS as other countries like Egypt see food prices surging. Over the past couple years everyone has been talking about how inflation will soon start and that has been one of the main driving forces for higher precious metals prices.

As we all know the market does the opposite as to what the majority of investors are doing. And while everyone has been buying metals in anticipation of inflation, I find it amusing how inflation for the first time is clearly presented on TV (Egypt issues) and we see gold and silver trading lower than they were a month ago. Seems like the buy the rumor sell the news lives is playing out. But the question everyone is starting to ask is how far will the metals correct?

Personally, I do not think they will drop much further but I do think it’s going to take 6-8 months before we see new highs in both gold and silver. They have had a nice run but now it looks as though they may cool off for a while. We could see some strength in the dollar for a little while and that should keep some pressure on metals even though inflation is clearly starting to show up around the world. Then the metals should start to climb the wall or worry again.

Below I are my updated charts on gold, silver and the gold miners index. Not much has really changed from last week analysis other than both gold and gold miners are getting deeper into a resistance level forming a bear flag pattern.

Gold Daily Chart
Gold is working its way up into a key resistance level and forming a possible bear flag.

Silver Daily Chart
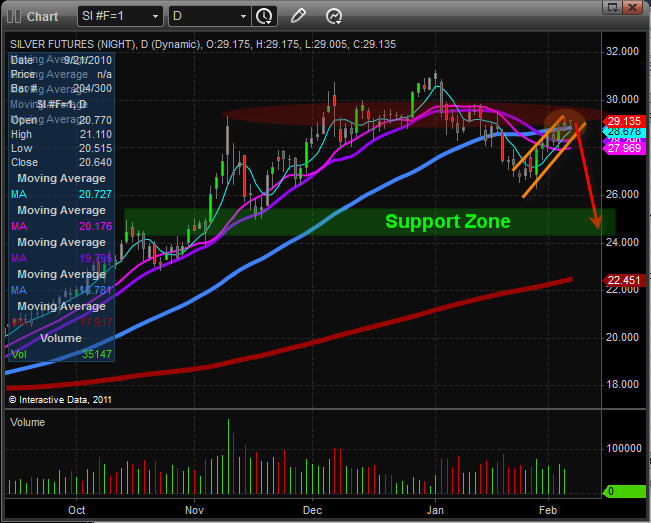
Silver has been testing its key resistance level for a few days. It is normal to see silver push the limits and make larger moves simply because it is thinly traded and much more volatile. It looks ripe for a pullback at this area.

Gold Miners Daily Chart Index
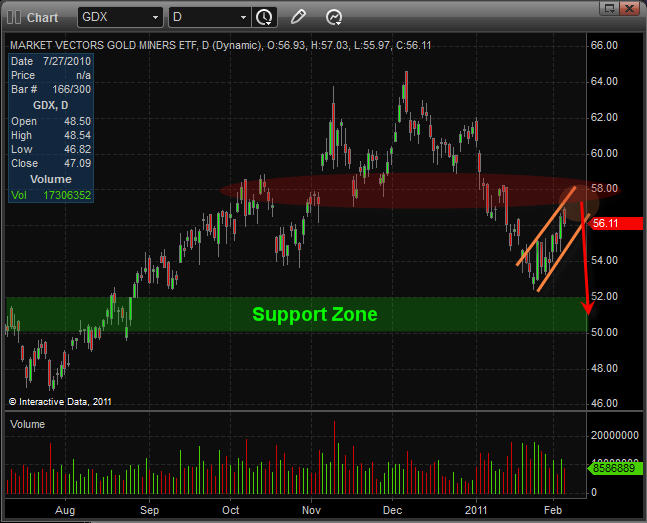
Gold stocks have put in a nice bounce from the strong selling in January. As it pushes up into a resistance level it’s starting to look more attractive as a short play also. I still think the market has a couple more days to upward/chop before metals see possibly another thrust down, but that also depends on what the dollar does this week. The dollar does look ready to rally this coming week and that will put pressure on metals.

Sunday Night Super Gold Conclusion:
In short, I’m an still neutral to bearish on gold, silver and gold stocks. Last week’s report showed these same patterns and it takes time for patterns to mature. The market always tends to take longer than we think to start a move.

At the moment I am waiting for metals to form a low risk entry point which looks to me like we could take a short position for another downward thrust in the market unfolds as the charts are hinting to before we buy gold for another long term hold as inflation rises.

You can get my daily trading videos, intraday updates and trade alerts by subscribing to my newsletter: www.TheGoldAndOilGuy.com

Chris Vermeulen

As most sophisticated investors and traders are aware, the U.S. Federal government has run up significant deficits and the long term debt burden is becoming a drain on Gross Domestic Product. That being said, most economists are discussing the possibility of a major decline in the value of the U.S. Dollar going forward as inflationary monetary policy begins to strangle growth. While that view point may prove right over the long haul, in the short run most traders are not likely expecting the U.S. Dollar to rally.

The U.S. Dollar is expected to reach a multi-year cycle low in the near future. From the cyclical low, I expect the U.S. Dollar to regain a strong footing and work higher against the crowd. This is not to say that the U.S. Dollar will not eventually decline, but financial markets do not work that easily. Shorting the U.S. Dollar is a crowded trade and Mr. Market punishes crowded trades quite often by pushing prices the opposite of what the heard is expecting. Should the U.S. Dollar find a strong underlying bid, precious metals and domestic equities would feel the brunt force of such a move. While it remains to be seen if the U.S. Dollar rallies, if it does it will catch many traders and economists by surprise and the unwinding of the short dollar trade could unleash a wave of buying that we have not seen for quite some time.

Let’s take a look inside the market…

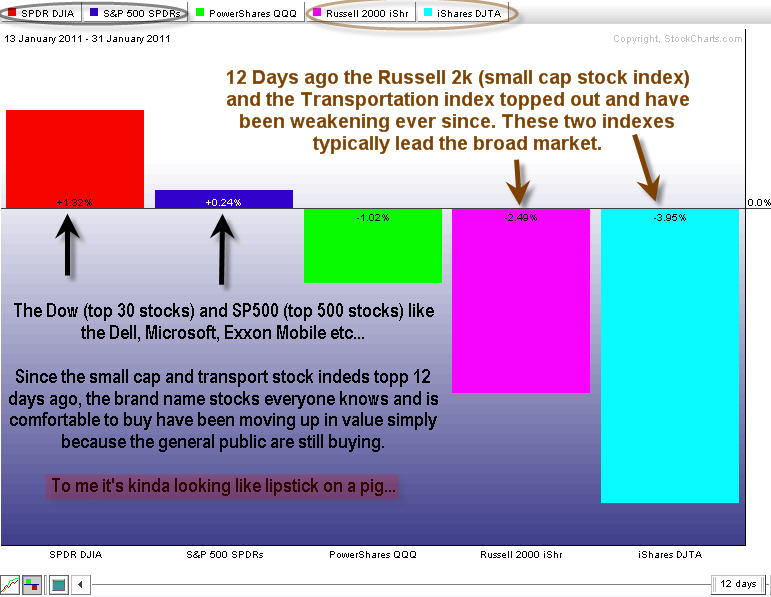
Major Index Price Action Over The Past 12 Trading Sessions – Bearish
Below is a table showing the main indexes used for tracking the market. The interesting thing about this data is that the indexes which typically lead the market have been deteriorating for the past 12 days and no one has noticed.

In short, the Nasdaq, Russell and Dow Transport indexes typically lead the market

Every radio station and business channel covers the Dow and SP500 indexes therefor the general public hears the market performance based on the those indexes. The problem here is that the Dow only consists of 30 stocks and the SP500 only holds the top 500 companies which is not a full view of the overall market because there are thousands of stocks listed on the exchanges.

The analysis below can be taken two ways depending which boat you are in… which I will explain in just a minute. The way I see things is a bit of both, I’m not really in or boat or the other… rather I have one foot in each because I have seen the market do things which support both sides (manipulation and measured technical moves) during my 14 years trading.

Ok here are my thoughts/opinions/forecasts…

Idea #1: Dow and SP500 indexes which 99% of the public use to gauge the market are moving higher on light volume. I feel because these indexes hold the stocks which everyone knows and is comfortable buying that this is the reason why they keep going up while the rest of the market silently erodes. It’s the simple thought that big money is moving out of leveraged positions (small cap stocks, transports, technology) in anticipation of a market correction, and the Average Joe continue to buy into brand name stocks boosting the Dow and SP500 thinking things are peachy..

Idea #2: We all know there is market manipulation, the question is how much of the price action is manipulation and how much is real supply and demand? No one will ever really know and that’s just part of the market and trading we have to deal with as traders. But I know there are traders out there blaming the Feds, POMO, and PPT for pushing the market up month after month. So the question is if these invisible forces manipulating the top 30-500 stock prices by buying them up which naturally boosts the Dow and SP500 indexes to keep everyone bullish on the market?

My thinking is that it’s a bit of both and that a correction is just around the corner.

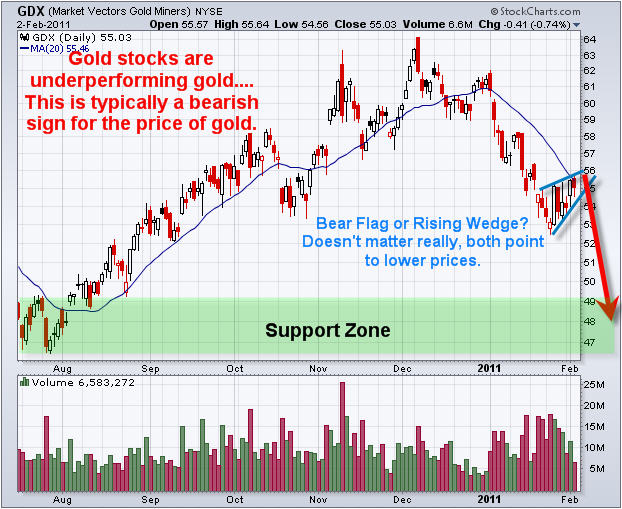
Gold Miner Stocks Underperform Gold – Not a good sign
Gold stocks today (Wednesday) underperformed the price of gold and are also forming a bearish chart pattern. If this plays out then we can expect another sizable pullback in both gold stocks and the price of gold because this index typically leads the gold.

US Dollar Multi Year Support Trendline
The US Dollar is trading down at a key support level and if we get a bounce and possibly even a rally then we could see a sizable correction in stocks and commodities across the board. As we all know everyone is shorting the dollar, buying gold and buying food commodities…. So it makes sense that all these crowded plays are about to see a major shift. Now this is just my contrarian point of view and those of you who follow my work know I’m not bias in my trading. I just take the market one day or week at a time and play the setups. But you must step back and look at the larger picture and at least give it some thought…

Concluding Thoughts:
In short, the major indexes are moving higher on light volume which is not a strong sign, and other key indexes are pointing to lower prices. The question everyone wants to know is how low will this correction be? The answer to that is that you must play the trend as you never know if a trend will last 2 days or a year. I take the market one day at a time continually analyzing price action.


If you would like to get my detailed reports and daily videos covering my analysis please join my newsletter at: www.TheGoldAndOilGuy.com

Chris Vermeulen