Gold & Stocks Are About To Move in Opposite Directions Get Ready!
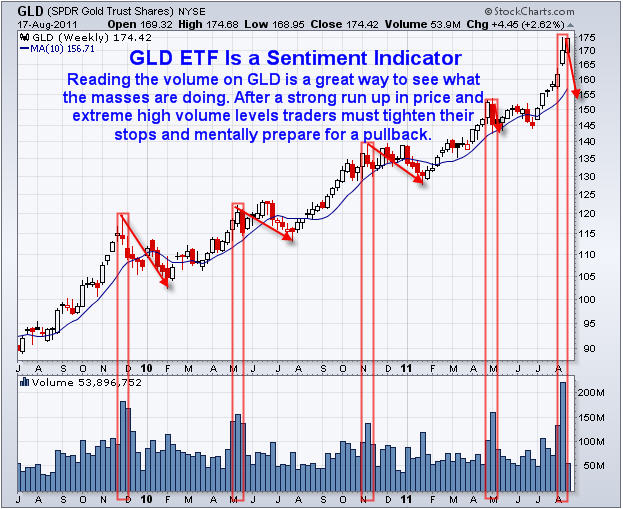
The past few weeks traders and investors have been completely spooked from the surge of negative news and collapsing stock prices. This fear can be seen by looking at the volume on the GLD gold ETF fund. With gold being in the spot light for several years now and the fact that anyone can own gold simply through buying some GLD shares. It only makes sense that reading the volume on this chart gives us a good feel for what the masses are feeling emotionally.
If we step back to trading basics we know that fear is the strongest force in the financial market for moving prices. And that there are a few ways to read fear in the market and the more which line up at the same time means there is a higher probability of trend reversal in the near future.
The first thing I look for is a rising volatility index (VIX). This index rises when investors become fearful of stock prices falling be hedging positions or flat out buying put options to profit from a falling market.
Second, I look for a high selling volume ratio meaning at least 3:1 shares traded are from individuals hitting the sell button in a panic thinking that the market is about to collapse.
And last but not least… I look at the GLD gold etf volume and price action. A surge in GLD volume after a strong move up means everyone is scared and dumping their money into a safe haven.
Let’s take a look at some charts to get a better feel.
GLD Weekly Gold Chart:
As you can see there are sizable price movements which ended with strong volume surges. Those volume surges mean that the majority of investors have reached the same emotional level and bought gold for safety (GLD ETF). Keep in mind that the big money players and market makers can see this taking place and that is when they start selling into that surge of buying volume locking in maximum gains before there are no more buyers left to hold the price up. Tops generally take a few weeks to form so don’t expect a one day collapse.
The recent rally in gold has taken place when stocks have fallen sharply. Money has been pulled out of stocks and pushing into gold but I think that is about to change…
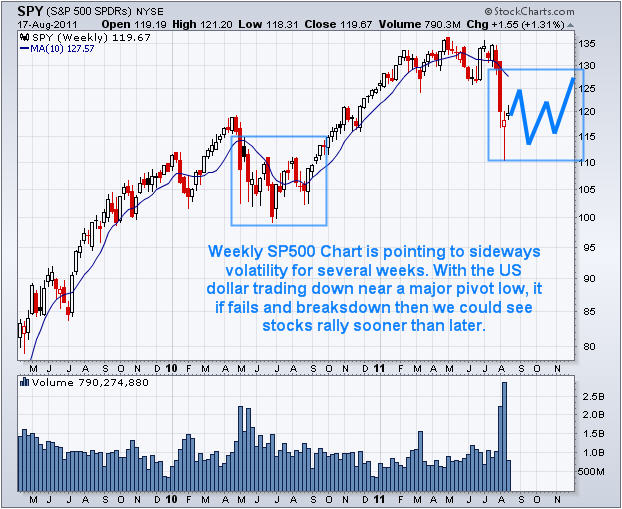
SPY Weekly SPX Chart:
The past month has been a blood bath for stocks. But from looking at the charts, volume and the fear in the market I can’t help but think we are going to see higher stock prices as investors see stocks moving higher, they will pull money out of gold and dump it back into stocks and likely high dividend paying stocks…
Mid-Week Trading Conclusion:
In short, everyone piled into gold sending it rocketing higher and I feel it has moved to far – to fast and is ready for a pullback (pause lasting 2-12 weeks). In association with gold’s pullback I feel investors are now realizing they sold their stocks at the bottom of this correction because fear took hold of their investing decisions. Now they are starting to think about getting long stocks but it still may be a bumpy ride for a few weeks yet…
Consider subscribing so that you will be consistently informed, have 24/7 Email access to me with questions, and also get Gold, Silver, SP500 and Oil Trend Analysis on a regular basis. Subscribe now http://www.thegoldandoilguy.com/trade-money-emotions.php
Chris Vermeulen


