The past few weeks have been fast moving with fearful investors clearly in control. As we all know fear is the most powerful force in the financial market and when the hedge funds and the masses get spooked they all dart in one direction like a school of fish. Watching the charts and volume levels it’s clear that money was/is flowing out of stocks and into precious metals as the risk off safe play. This was explained in last week’s report on how the GLD etf can be used as a fear/sentiment indicator (read here).

To make a long story short, I feel as though Euro-Land is going through something similar to what we (the USA) went through in late 2008 and first quarter of 2009. Keeping my analysis simple and to the point it’s very likely that Euro-Land will resolve their financial issues and their stock markets will bottom in the next month or so… If their market bottoms, so will the US market, which will be perfect timing as the market is currently oversold, sentiment is now turning bearish and we have had a sizable pullback in line with normal bull market corrections.

My thinking looking forward 2-6 weeks is that stocks rally, financials rocket higher, bond prices fall, gold falls and oil rises as it will be a risk off trading environment again. Of course all this would happen after Euro-Land resolves some of their key financial issues. I’m being very optimistic here but we could be nearing a major low that could kick start another massive 1 year rally.

Stepping away from that longer term outlook let’s take a peek at the shorter term trends for oil, gold and stocks.

Crude Oil 60 Minute Chart (1 month view)
The recent price action for crude oil remains bearish/neutral in my opinion. We saw a drift higher into resistance with declining volume then a sharp pullback on heavy volume. This tells me oil remains in a down trend. It may be forming a base which would act as a launch pad in the coming weeks for higher prices but only time will tell and I will update as price unfolds.


Gold 4 Hour Chart (One Month View)
Gold has been performing very well for our entry point but the recent price action is starting to look toppy. Gold and many commodities regularly form this pattern of three wave pushes to new highs just before a sizable correction takes place. I am bullish on gold long term and for a few more weeks, but I do feel as though there will be a multi month correction in the price of gold (Read More) soon so be sure to tighten your protective stops as price moves higher.


SPY ETF Weekly Chart (Two Year View)
The stock market has been hit hard and a lot of damage has also been done to the charts on a technical stand point. The amount of damage and fear that has happening generally takes some time to stabilize and heal before another move takes place. Until Euro-Land resolves some of their major issues the US market will be held hostage and under pressure. So I anticipate several weeks of volatility and wild daily price swings similar to what we saw in July of 2010. This type of trading environment can work very well for options traders (Read More).


Weekly Trading Conclusion:
In short, the market price action is favoring very short term traders (day traders). We are seeing complete price swings which can normally be swing traded happen in just hours… Until we get another extreme setup or stabilization (less big headline news) in the market we will be more of a spectator than a trader to preserve capital.

Consider subscribing so that you will be consistently informed, have 24/7 Email access to me with questions, and also get Gold, Silver, SP500 and Oil Trend Analysis on a regular basis. Subscribe now http://www.thegoldandoilguy.com/trade-money-emotions.php

Chris Vermeulen

The coming summer should be exciting for traders! While summer trading generally tends to be slow, this one could be different. A large number of other professional traders I talk with are all feeling the tension building in the market. We all think some big movements are just around the corner and the big question is which way are things going to move?

Depending on your trading style you may be viewing the recent market action as the beginning stages of a bear market (major sell off). A bear market is not necessarily impossible as the U.S. Economy is showing the beginning signs of weakness. The fact that stocks have moved lower for almost 6 weeks straight is a recent reminder that we may not be out of the woods just yet. The recent price action and negative sentiment has been harsh enough to make 99% of traders bearish.

In contrast, some traders may be seeing this market as an oversold dip preparing for a bounce/rally in the bull market which we have been in since 2009. Some traders may see this as a buying opportunity because you are a contrarian. Most contrarians generally want to do the opposite of the masses (herd) who are merely trading purely out of emotional sentiment.

I myself have mixed thoughts on the market at this point in time. I’m not a big picture (long trend forecasting) kind of guy but my trading partner David Banister is great at it. Rather I am a shorter term trader catching extreme sentiment shifts in the market with trades lasting 3-60 days in length. So looking forward 2-5 days I feel as though stocks and commodities are going to bottom and start to head higher for a 2-6% bounce. At that point we need to regroup and analyze how the market got there… Was the buying coming from the herd, institutions, or was it just a short covering rally? Additionally, where are the key resistance levels and did we break through any?

During extreme sentiment shifts in the market we tend to see investments fall out of sync with each other for a few days. I feel the attention will be on stocks and we get a bounce this week. I am expecting commodities to trade relatively flat during the same time period.

OK let’s take a quick look at the charts…

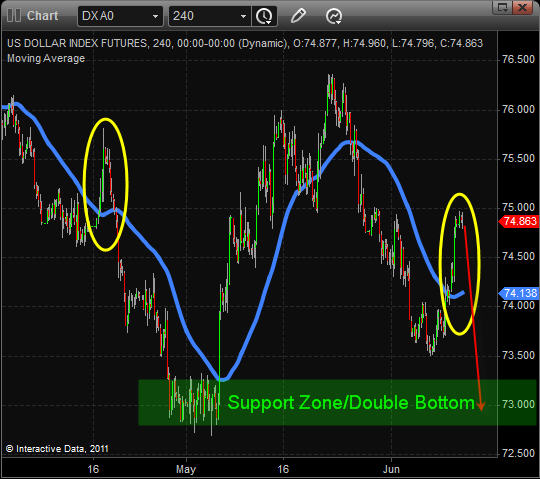
Dollar Index 4 Hour Candles
I feel as though the US Dollar is trying to bottom. It is very possible that we test the May low at which point I would expect another strong bounce and possible multi-month rally. So if the dollar drops to the May lows then we should see higher stocks and commodities, but once the dollar firms up and heads higher it will be game over for risk assets.

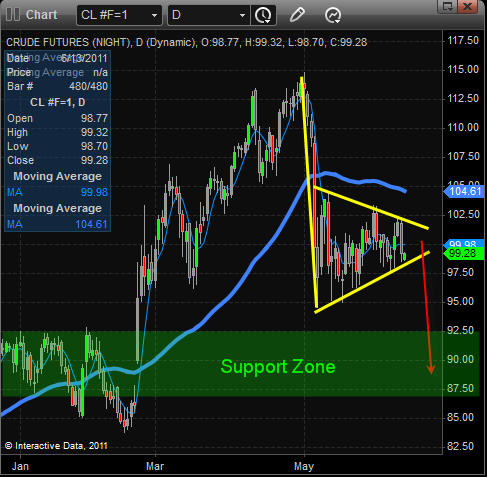
Crude Oil Chart – Daily
Oil took a swan dive in early May and has yet to show any signs of moving higher. Actually crude oil is looking more and more bearish as time goes by.

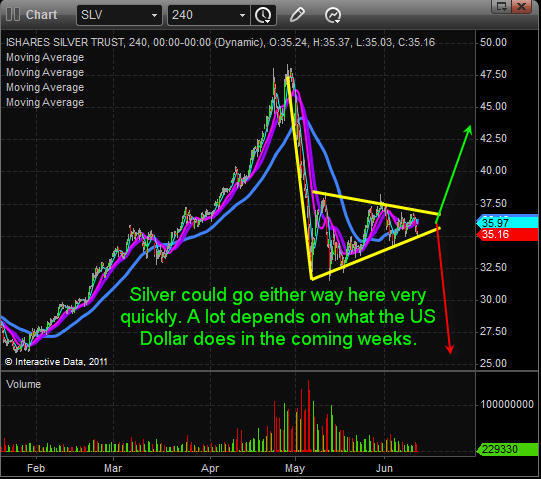
Silver 4 Hour Chart
Silver has formed much of the same pattern that oil has. On a technical basis its pointing to sharply lower prices still. The fact that silver bullion went from an investment to a speculative trading instrument within the past 8 months makes me think it could test the $25 area. The one thing to remember here is that silver is still overall in a bull market. This is a 50/50 guess in my opinion as it nears the apex of this pennant pattern.

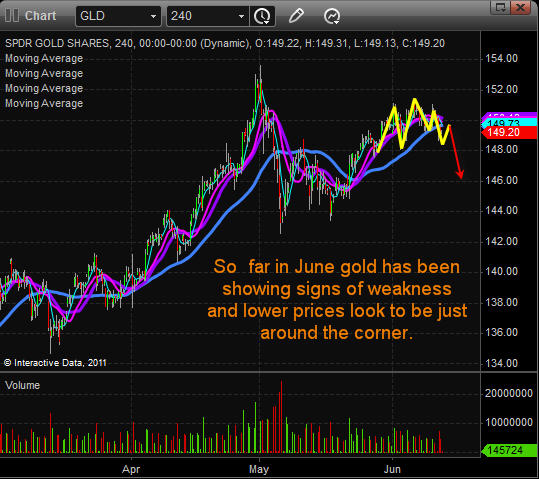
Gold 4 Hour Chart
Gold has held up much better than other metals and commodities and I feel that is because it’s still seen at the REAL safe haven. But reviewing the chart Im starting to see bearish price action beginning to take place.

SP500 Futures – 10 Minute Chart Going Back 8 Days
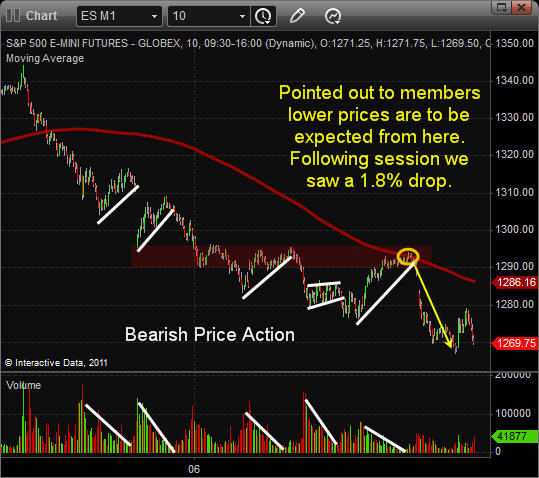
Last week the SP500 continued to show signs of weakness. Any bounce in the market was on light volume and that is because the sellers took a break and let all the small traders buy the market back up. But once the market moved up enough then sellers jumped back in and unloaded their shares.
Last Thursday I sent out an update to members pointing out that lower prices were to be expected. I came to this conclusion because of many data points. Looking at the chart you can see sellers are clearly in control. The SP500 bounces high enough that it reached a key resistance levels going back 5 days. Also the 200 period moving average was at that level. To top that off my sentiment reading for the herd mentality was at a point which sellers like to start dumping their shares again.

Weekly Market Trading Conclusion:
In short, I am getting more bullish for a bounce as the market falls. But once we are into day 3 or 4 of a bounce we must be ready to take profits and/or look for a possible short setup.

Get my free weekly reports here: http://www.thegoldandoilguy.com/trade-money-emotions.php

Chris Vermeulen

The price action in precious metals and oil this past week has been breathtaking. The last time we have seen this much volatility in commodity prices was amidst the financial crisis in 2008 and the early part of 2009. Does this mean we are at the brink and risk assets are going to decline precipitously? Obviously that question cannot be answered with any certainty, but the underlying price action in the S&P 500 has been relatively strong compared to gold, silver, and oil.

Talking heads everywhere are predicting the commodity bubble has burst and pointing fingers at excessive speculation in silver and oil. Margin requirement changes in silver futures have been fingered as the primary catalyst for the nasty sell off. Silver had gotten way ahead of itself in terms of price and parabolic moves higher are usually followed by parabolic moves lower. For silver buyers on Friday, April 29 a painful lesson has been learned as their investment has declined more than 30% in 5 days.

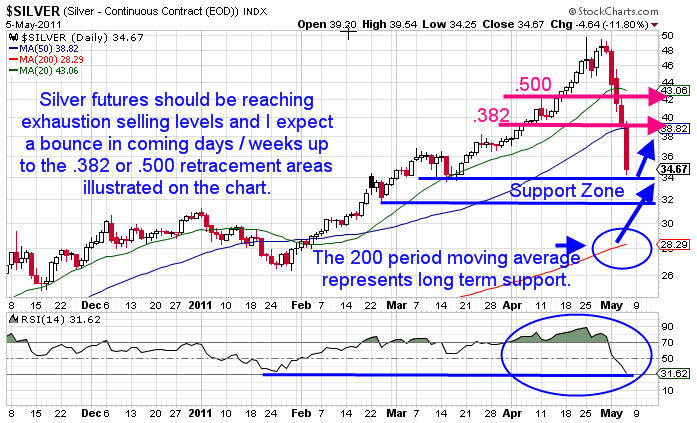
It doesn’t take a genius to realize that we are going to bounce higher at some point. With a sell off of this magnitude it would not be shocking to see at least a 50% retracement of the entire move in coming weeks. It is also possible that this is a buying opportunity for precious metals and oil. It is too early to be certain, but a bounce next week is likely as silver went from being severely overbought to severely oversold on the daily chart in one week. The chart below illustrates the 50% retracement and the RSI reading for silver futures:

In the month of April OptionsTradingSignals members were able to capitalize on rising silver prices to close a trade that produced an 18% return in less than 5 days using a double calendar spread in order to produce outsized profits based on maximum risk. Members regularly receive trade alerts focusing on gold and silver using ETF’s GLD & SLV which have extremely liquid options.

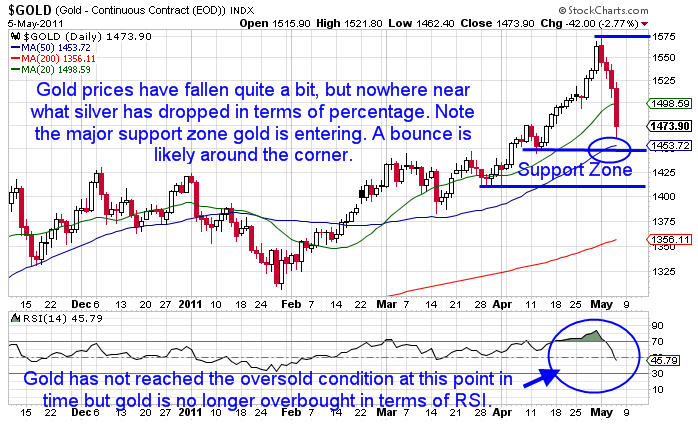
While silver prices have been absolutely crushed, gold prices have held up a bit better. In fact, in this selloff gold has been less volatile in terms of intraday percentage price movement and has not suffered from near the losses that we have witnessed in silver. The gold futures chart below illustrates key price levels:

Members of the OTS service received a trade alert on April 6th for a calendar spread that was converted to a vertical spread. When the vertical spread was closed on April 26th the members realized a gain close to 56% based on the maximum risk of the trade.

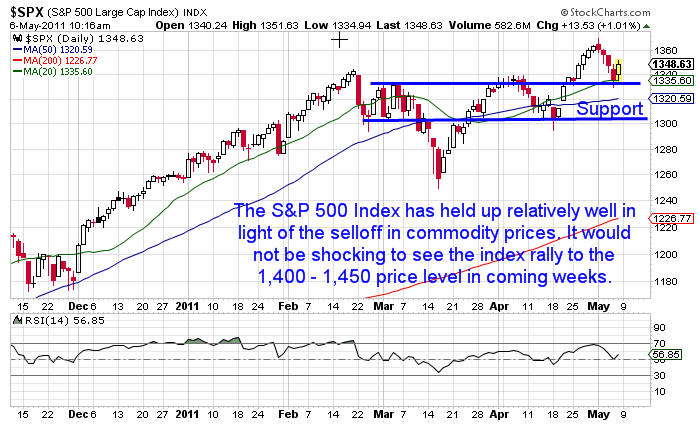
Recently we have received some poor economic data which has put a drag on equities the past few weeks. This morning we are seeing a strong bounce in the S&P 500 futures and if we have another light volume Friday prices tend to drift higher throughout the trading day. The S&P 500 futures spiked to around 1,370 on the news of Osama Bin Laden’s death and then sold off from that point. The chart below illustrates the S&P 500 futures rally and subsequent sell off highlighting current key price levels:

Members of OptionsTradingSignals received a trade alert on April 12th to put on a call vertical spread to capitalize on rising prices. On April 21st partial profits were taken and eventually stop orders closed out the position on May 4th locking in a total gain of around 32% for the trade based on maximum risk.

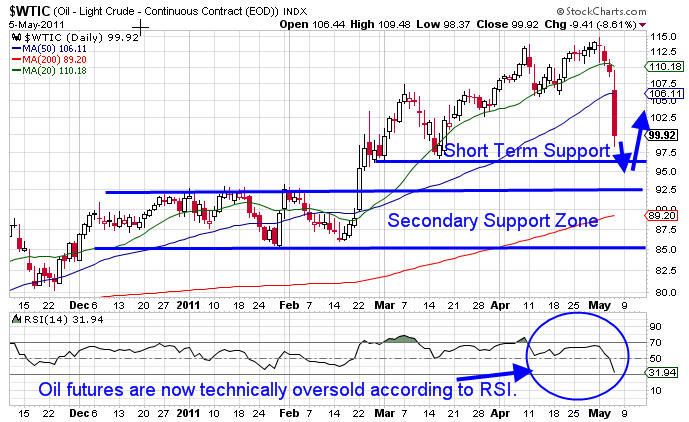
Oil prices have sold off sharply, albeit not as sharp as the downside move in silver recently from a percentage standpoint, but a significant amount of the risk premium has come out of oil prices. I continue to believe that oil prices over the long term have only one direction to go based on tightening supply / demand going forward and lower production levels in the future. Similar to silver, a .500 retracement of the entire recent move is rather likely in coming weeks. The daily chart below illustrates key price levels in oil futures:

I continue to believe that oil prices are going to work higher over the longer term for a variety of reasons, but a drop in gasoline prices would not hurt U.S. Consumers and the domestic economy. Higher oil and gasoline prices weigh on the U.S. Economy heavily so this sudden decline in price is beneficial to most Americans which could juice consumption if prices stay lower for a longer period of time.

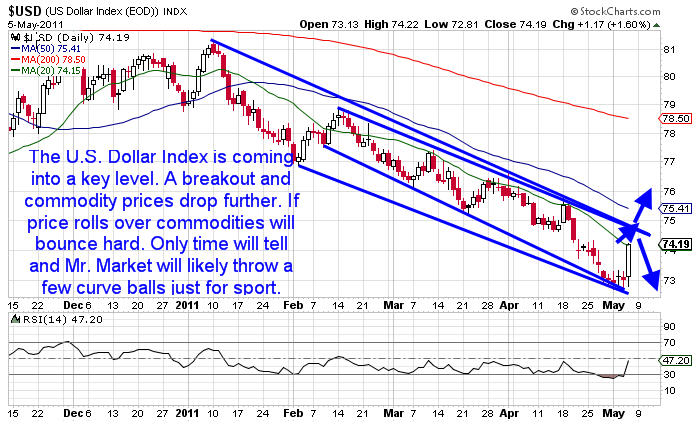
Overall, price action in the commodity space has been extremely volatile the past week with silver and oil really getting hammered lower. Gold and the S&P 500 held up a bit better and it would not be shocking to see the S&P 500 put on a rally from here if oil prices stabilize. However, if the U.S. Dollar continues its recent rally it will force the commodity space as well as equities lower. The daily chart of the U.S. Dollar Index futures is shown below:

In closing, I am expecting a bounce in coming days and a .382 or .500 retracement of the entire move in gold, silver, and oil would make sense so I would not be too aggressive shorting. However, I would not necessarily be an aggressive buyer either. It is going to take time for market participants to digest the recent moves. In weeks ahead it will be more apparent what price action is likely to do and I would be shocked if we did not see a few low risk, high probability trades setting up.

Speaking of low risk, high probability trades, the month of April was the best performance for the OptionsTradingSignals service so far year to date. Seven total trades were opened and six trades have been closed with sizable profits. Recent returns included an 18% return in SLV, a 56% return on a GLD trade, 32% return on an SPY call vertical spread, a 12% return on a RUT Calendar spread, and a 37% return on an AMZN calendar spread. The total cumulative return in April was 155%.

Assuming a trader had a $10,000 account and risked a maximum of $1,000 per trade, the gross gains would have been well over $1,400 in April alone. The overall service is up over 15% year to date handily beating the S&P 500 return while assuming less risk. Take advantage of the special offer going on now where new members get 3 months for the price of one!

Get JW Jones’ Weekly Reports Free Here: http://www.optionstradingsignals.com/profitable-options-solutions.php

By: JW Jones
Co-Author: Chris Vermeulen

I was starting to put on my bullish hat on Friday morning when out of the blue an ugly close has forced me to rethink my position. After viewing a few hundred charts, I have determined that while I am still leaning into higher prices at this point in time, I will not totally rule out a rollover on the S&P 500. In coming days the news flow will be extreme and headline risk will be everywhere we look. The S&P 500 has been able to deflect worry for quite some time now and in every case the resiliency is unquestionable.

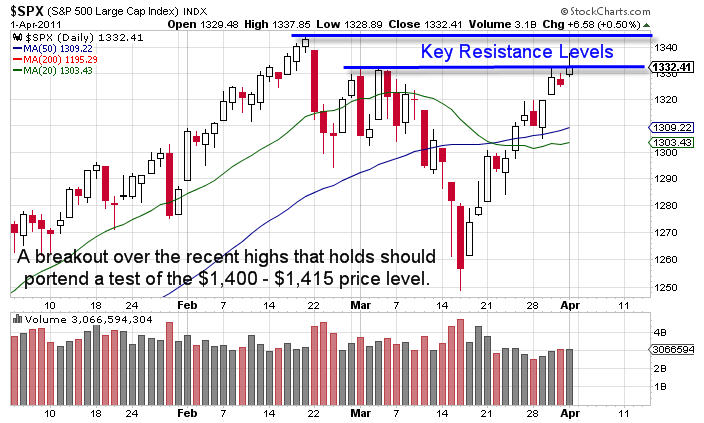
However, we are nearing the beginning of another earnings season which will start in just a few weeks’ time. First quarter earnings for 2011 are going to be quite interesting and most analysts’ estimates are relatively challenging. Will the rubber hit the road into earnings? Are we about to see a double top play out into earnings, or is there going to be a breakout which will take us to the SPX 1,400 – 1,415 price level?

I know, I ask a lot of questions but quite frankly that is what is running through my head. The SPX is not out of the woods yet, and the price action on Friday indicated that there is some serious supply overhead and two key resistance levels to break through before the SPX gets back to clear blue skies overhead. That being said Chris Vermeulen has caught a nice part of the recent bounce with his subscribers. He does feel the market is about to get choppy but his analysis is pointing to overall higher prices in the coming weeks.

SPX illustrates the two key price levels:
SP500 ETF Trader

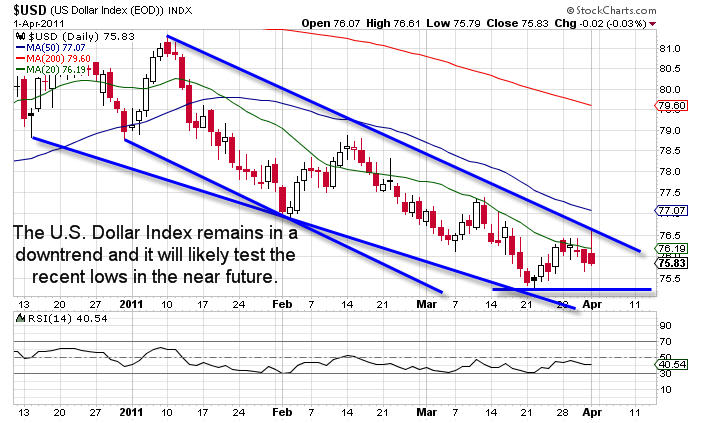
In addition to the uncertainty that earnings season can bring, the primary reason why I am still leaning into a bullish move in the S&P 500 is the recent price action in the U.S. Dollar Index futures. The U.S. Dollar is scheduled to make its 3 year cycle low sometime this spring and the recent price action is indicative that the recent lows may not be the cycle lows. If the U.S. Dollar Index breaks down below recent lows, I would expect to see a nasty sell off.

The U.S. Dollar Index futures daily chart is shown below:
DX Dollar ETF Trader

Whether readers believe that we are going to be in an inflationary environment or a deflationary environment is a topic for a different time, but the chart above is undeniable that recently the U.S. Dollar has declined in value and is exhibiting weak price action. Friday morning it looked as though the U.S. Dollar was going to rip higher, but by the end of the day sellers had stepped in and forced the U.S. Dollar into the red for the session. The price action on Friday highlighted the weakness in the U.S. Dollar and the high levels of overhead supply.

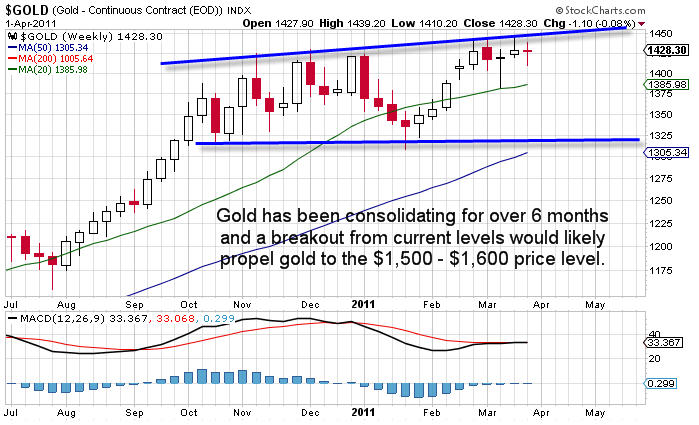
If the U.S. Dollar continues to weaken, in the short run I would view this as a positive for the S&P 500, crude oil, and precious metals. If the dollar breaks down to new lows, it should help buoy the S&P 500 and gold prices. Gold has been consolidating for nearly 6 months and a breakout higher from current price levels would make a trip to $1,500 an ounce very likely. I would not be surprised to see gold work even higher than $1,500 an ounce depending on how violent the selloff in the U.S. Dollar might be.

The weekly chart of gold futures is listed below:
GC Gold ETF Trader

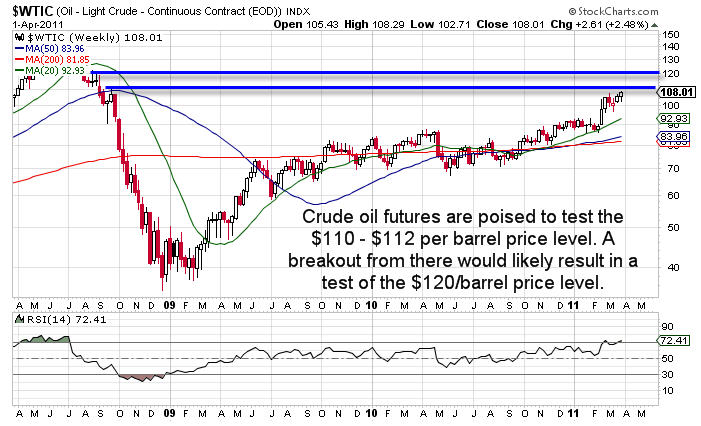
I would think that most investors are aware that crude oil futures have been trading higher recently. On Friday oil prices climbed above recent resistance around the $107/barrel price level and reached new recent highs. Members that belong to my paid service enjoyed a relatively low risk options trade that we put on several weeks ago which involved selling cash secured naked puts on $USO. The trade was closed on Friday for a total gain of 85% of the premium that was sold. For long time readers, my stance on energy has been pretty obvious. In the longer term, energy prices almost have to go up as the world’s demand for energy increases while supplies remain flat.

I will likely get involved in another oil trade at some point in the future, but for right now I’m going to wait for a more prudent entry. Based on current price action, it would not surprise me to see crude oil futures test the $110 – $112 per barrel price range in the near future. If the $112/barrel price level is breached to the upside, a test of the $120/barrel price level will be likely.

The weekly chart of oil futures is listed below:
CL Crude Oil ETF Trader

Weekend Trend Conclusion:
The S&P 500 is in an interesting place as far as the price action is concerned. With earnings season rapidly approaching and a possible break down in the U.S. Dollar Index likely, future price action is uncertain. I am leaning into the bullish camp at this point, but that could change rather quickly based on the price action later this week in both the S&P 500 and the U.S. Dollar Index. One thing worth mentioning is that if the U.S. Dollar Index were to bottom around these levels and a bounce higher transpired, it would put negative price pressure on most asset classes. The fact that price action in the U.S. Dollar Index has been weak lately makes me believe a break down is likely, but as most readers know Mr. Market offers few guarantees.

Assuming the U.S. Dollar breaks down, we should see the S&P 500, precious metals, and oil continue to work higher. My eyes are going to be watching the U.S. Dollar Index closely in coming days/weeks. If a breakdown transpires, the potential upside in precious metals and oil could be intense. Ultimately, I remain slightly bullish on stocks and extremely bullish on oil and precious metals. However, my entire thesis could change if the U.S. Dollar Index starts to firm up and begins to work higher. There are simply too many question marks surrounding price action to take on significant amounts of risk at this point in time.

Analysis & Opinions of:
J.W Jones – www.OptionsTradingSignals.com
Chris Vermeulen – www.TheGoldAndOilGuy.com

Trading with multiple time frames – Every now and then it’s always a good idea to look at some different time frames to be sure you have a solid understanding for the longer term trends in play. I will admit that it’s easy to get caught up in trading the shorter time frames like the 1, 10, and 60 minute charts especially when there are large intraday movements. But every night you must reset your thinking by looking at the bigger picture.

Below are weekly and daily charts which I think provide a big picture view of things.

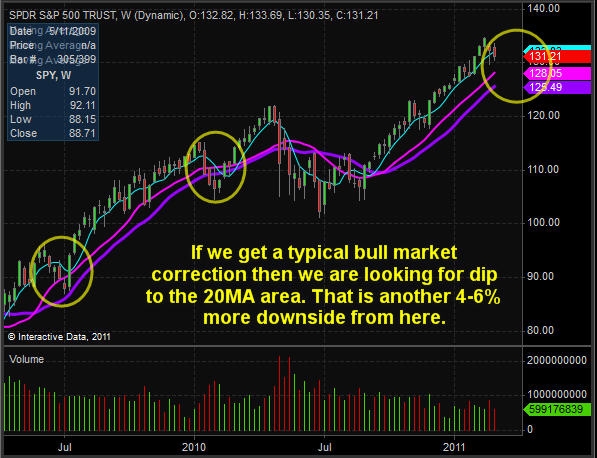
SPY – SP500 Index Fund – Weekly Chart
You will see that in both 2009 and 2010 we saw a 5-8% correction down to the key moving averages. I feel that we are in store for a similar pullback in 2011. After that we will most likely continue higher.

US Dollar Index – Weekly Chart
The dollar is trading down at a key support level which I am keeping a close eye on. If we get a close below this trend line then we should see the dollar sell off sharply which in turn will trigger another leg higher in commodities across the board.

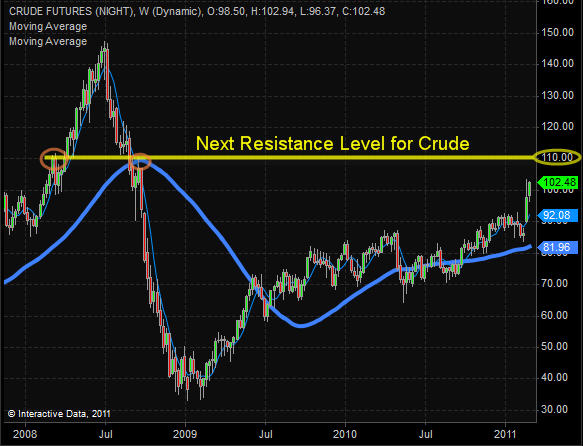
Crude Oil – Weekly Chart
Crude oil has really taken off because of the fears coming out of the Middle East. From the looks of it the next key pivot level is the $110 level.

Gold – Daily Chart
Both gold and silver have made new highs but after such a run I expect we see a quick pullback before they go higher. Gold and silver are the two investments I think everyone should hold a core position for the long run no matter what happens to the price. But, if we do get a nice quick pullback into the key moving averages then I think it’s a great spot get involved with more money.

Mid-Week Trend Report:
In short, I am bullish on stocks and commodities and bearish on the dollar and bonds. The one issue I see going forward is that if the dollar breaks down it will most likely help boost oil prices which in turn puts downward pressure on stocks… So depending on how things unfold in the Middle East and a falling dollar, we may not see higher stock prices. Some individuals are forecasting $150-220 per barrel and I know if it gets back up there it will definitely slow the economy and stock prices down…

That’s it for now, but if you would like to these reports sent to your inbox be sure to join my free newsletter: http://www.thegoldandoilguy.com/trade-money-emotions.php

Chris Vermeulen

Over the past few months it seems as though everything has been tied to the dollar. Simple inter-market analysis makes it obvious that almost everything in the financial market eventually has an affect on stocks and commodities in some way. But recently trading has really been all about the dollar. If you watch the SP500 and gold prices you will notice at times virtually every tick the dollar makes directly affects the price and direction of gold and the SP500 index.

Let’s take a look at some charts to see the underlying trends and what they are telling us…

Dollar Index – Daily Chart

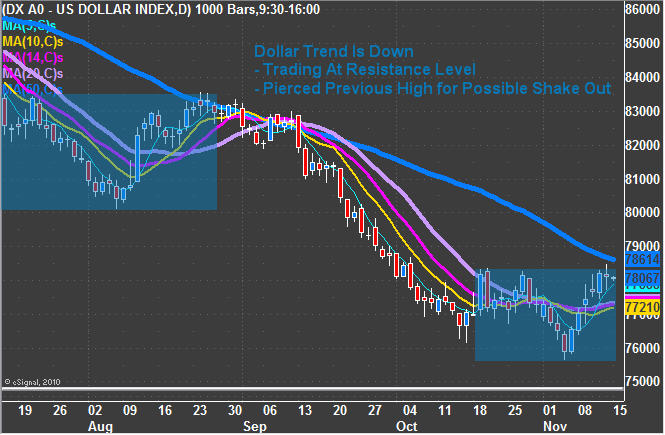
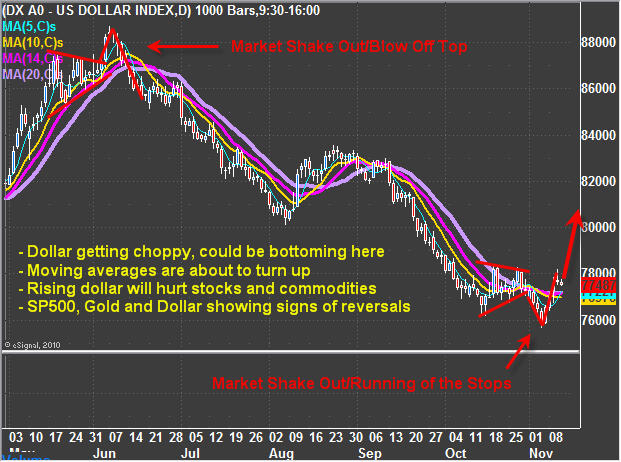
As you can see the trend is clearly down. Currently the dollar is trying to find a bottom as it bounces and pierces the previous high. The question everyone wants to know is if the dollar is about to rally and reverse trends or was Friday’s pierce of the October high just a shake out before the next leg down?

Back in late August the dollar pierced the July high on an intraday basis (shake out) just before prices dropped sharply. I think this could very easily happen again but when you see what gold volume is doing, it’s a different story.

Those who follow me closely know I focus on trading with the underlying trend, but manage my risk by trading smaller position sizes when the market has more uncertainty than normal with is what we are currently experiencing.

GLD – Gold Fund – Daily Chart

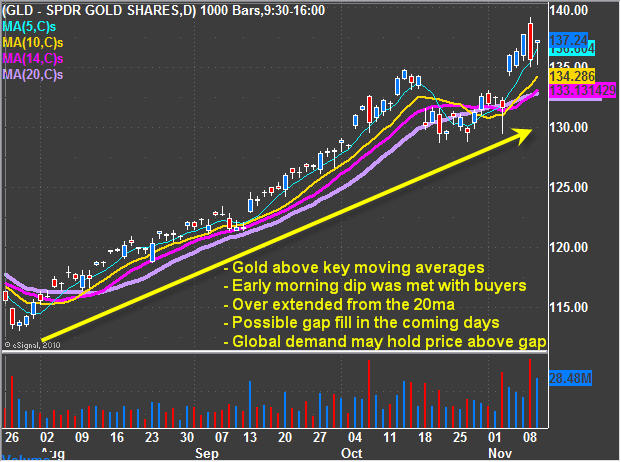
Gold and the dollar are almost inverse charts when comparing the two. Gold happens to be testing a key support level and its going to be interesting to see how the price holds up going forward. The one thing that has me concerned is the amount of selling taking place. The chart shows heavy volume selling and could be warning us of a possible trend change in the dollar, gold, oil and equities in the coming weeks.

Again the trend for gold is still up, so I would not be trying to short it at this time, rather look to buy into dips until the market trend proves us wrong. That being said, with the selling volume giving off a negative vibe and the fact that gold has rallied for such a long time, any new positions should be very small…

Crude Oil – Daily Chart

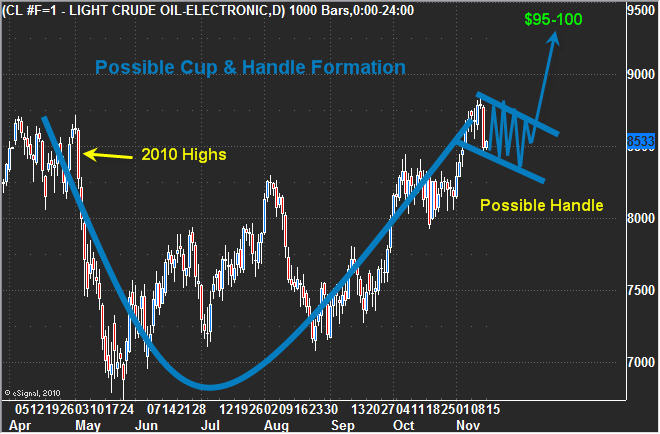
Oil looks to be forming a possible cup and handle pattern. If the Dollar continues to consolidate for another 1-3 weeks and breaks down, then we should see the price of oil trade in the range shown on the chart and eventually breakout to the upside. I have a $95-100 price target on oil if the dollar continues to trend down. Until we see some type of handle form here I am not trading oil.

SPY – SP500 Fund – Daily Chart

The equities market looks to have had one of those days which spooked the herd. Friday the price dropped triggering protective stops with rising volume. I was watching the intraday chart as the SP500 broke below the weeks low, and this triggered protective stops which can be seen on the 1 minute charts. In an uptrend I prefer watching stops get triggered because it means traders are getting taking out of long positions and most likely looking to play the short side. When the masses become bearish on the market, that’s when I start looking to play the upside in a bull market (buy the dip).

The chart below clearly shows the days when the shake outs/running of the stops took place. Most traders were exiting their positions and/or going short because the chart looked bearish. One thing I find that helps my trading is that if the chart looks rally scary (bearish) then I start looking at a shorter term time frame for a possible entry point to go long using price and volume analysis.

Weekend Market Trend Trading Conclusion:

In short, I feel the market is at a critical point which will trigger a very strong movement in the coming days or weeks. Because the dollar, gold, oil and the equities market have had such big moves I think trading VERY DEFENSIVE is the only way to play right now. That means trading small position sizes. Right now I am trading 1/8 – 1/4 the amount of capital I generally use on a trade. Meaning if I typically put $40,000 to work, right now I am only taking positions valued at $10,000.

Remember not to anticipate trend reversals by taking a position early. Continue to trade with the underlying trend with small positions or skip a couple setups if you feel strongly of a possible reversal. Once the trend reverses and the volume confirms, only then should you be playing the new trend. Picking tops can be expensive and stressful.

Get My Daily Pre-Market Trading Analysis Videos, Intraday Updates & Trade Alerts Here: www.GoldAndOilGuy.com

Chris Vermeulen

It has been a roller coaster week thus far as stocks and precious metals plunged on heavy selling volume on the back of a rising dollar, only to make a strong rebound Wednesday. While there has been significant intraday price movement, it was no surprise to us as we have been anticipating this pullback since discussing it in my Sunday Gold Newsletter.

Let’s take a quick look at the charts…

US Dollar Daily Trading Chart

The past couple weeks the dollar has traded in a choppy fashion, and last week I mentioned to subscribers to keep any new positions small. The dollar looked ready to make a bounce and if it reverses we will see stocks and commodities correct rather sharply.

Last week we trimmed some profits on our gold and SP500 trading positions in anticipation of a rising dollar/lower equity and metals prices. The dollar is currently in a down trend so we are still trading with the trend, but the next couple sessions could potentially change that.

As you can see on the chart a similar pattern to what we saw during the May/June top earlier this year has now formed in reverse this month. It’s a simple pattern I call a drop-n-wash. It is like dropping a knife – you panic, then take action (move foot, then wash the kife). That is typically how the market reacts to this type of price pattern after an extended trend has taking place for a long period of time.

The dollar made an obvious breakdown which the entire world witnessed, causing traders who recently went long to panic and sell their positions. Those who like to short the dollar would have taken a short position, only to see the market reverse and head straight back up again. This pattern has yet to confirm, but through the use of the shorter time frame charts (5 Min, 10 Min, 30 Min), I have a feeling the dollar may continue to rise. However, until the dollar shows considerable strength I am still playing the long equities / long gold side of the equation.

SPY – SP500 ETF Trading Fund

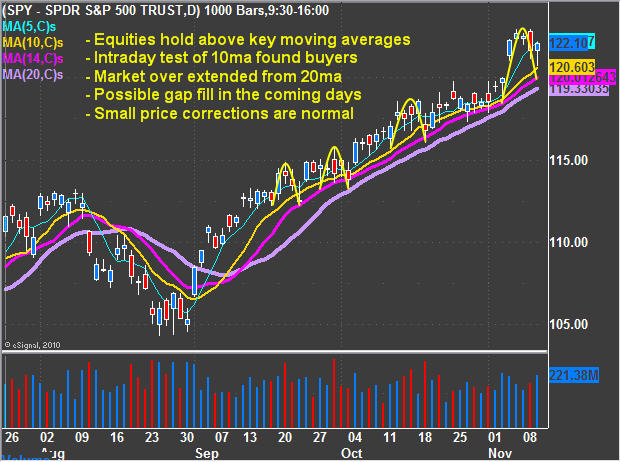
The SP500 made a nice move up last week and we trimmed our position back to lock in more gains as I anticipated this pullback and possible gap fill. As you can see on the chart the moving averages are all heading up and that’s the direction we are still focusing on playing (buying dips).

The morning dip on Wednesday the market sentiment started to shift to become extremely bearish on the short term time frame (10 minute charts). If the market drops down to fill the rest of that gap, I have a feeling the majority of traders will panic out of their position giving us an extreme sentiment buy signal. Also a gap fill will bring the price down to the key moving averages which will act as a support level. I will notify members to add more to my SP500 long position if that happens.

GLD – Gold ETF Trading Fund

Gold has much of the same story as the SP500 but with a couple twists. Gold has huge global demand from banks, investors and traders adding more buying power to this investment than stocks right now. We could see gold hold up above its gap that formed last week. That being said, a pullback to the key moving averages would not only act as a major support level but also fill the gap. We currently have our long positions, but trimmed some profits near the highs and are sitting tight letting the market work it’s self out.

My trading partner J.W. Jones posted a great gold play yesterday which had a nice payout already. Read about his gold options trade here.

Mid-Week ETF Trading Conclusion:

In short, the focus should be kept on trading with the underlying trends until a trend change has been confirmed. So that means short the dollar, long equities, metals and oil.

That being said, because things are starting to look unstable it is crucial to trade smaller position sizes during times of uncertainty like this. Anticipating major market tops is very difficult and generally costly play, just ask everyone who has been trying to pick a top for the past 2 months… Anticipate trend changes, but don’t trade them until the price/volume action confirms the new trend.

Get My Daily Pre-Market Trading Videos, Daily Updates & Trade Alerts Here: www.GoldAndOilGuy.com

Chris Vermeulen
The financial markets continue to climb the wall of worry on the back of more Fed Quantitative Easing. Those trying to pick a top in this choppy bull market may prove to be correct for a couple hours but over time the shorts continue to get clobbered.

Quantitative easing was enough to turn gold back up and gave oil just enough of a nudge to breakout of its cup and handle pattern explained later.

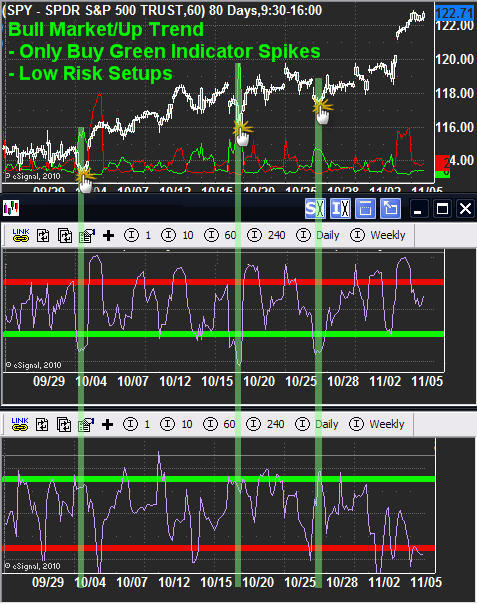
The past few weeks the number of emails I receive on a daily basis about what individuals should do about short positions they took on their own has growing quickly. Usually when my inbox starts to fill up with traders holding heavy losses trying to pick a top I know something big is about to happen and its not going to be in the favor of the herd (everyone shorting). In the past couple week there have been some great entry points for the broad market whether its to buy the SP500, Dow, NASDAQ or Russell 2K. I focus on trading with the trend and entering on extreme sentiment readings as shown in the chart below.

Extreme Trend Trading Analysis

Below are my main market sentiment indicators for helping to time short term tops and bottoms. That being said I don’t pick short term tops in hopes to profit on the down side. Rather I wait for a extreme sentiment bottom to be put in place, then enter long with the up trend (Buy Low).

Once there is a 1-2% surge in price and sentiment indicators are showing a short term top I like to pull a little money off the table to lock in some profits while still holding a core position (Sell High). This is exactly what I/subscribers have done over the last couple weeks. This is a simple yet highly effective strategy and works just as well in a down trend except I focus on shorting extreme sentiment bounces. Subscribers know what these indicators are as I cover them each week in my daily pre-market trading videos as we prepare for the day ahead.

SPX Running Correction

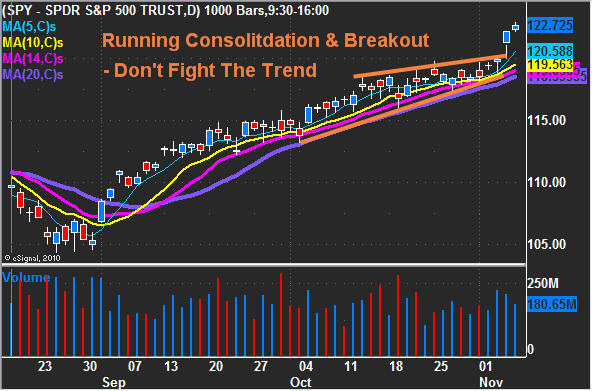
Since early September the equities market has been on fire. In late September the market was extremely toppy looking and trading at key resistance levels from prior highs convincing a lot of traders to take a short position. But instead of a correction the market surged and has since continued to grind its way up week after week.

This rising choppy price action can be seen two ways:
1. As a rising wedge with a blow off top (Bearish)
2. Or as a Running Consolidation (Bullish)

The running consolidation happens when buyers are abundant picking up more shares on every little dip. Overall looking at the intraday price action you will see market shakeouts as it tries to buck traders out before it continues higher. This choppy looking market action if not read correctly looks extremely bearish to the novice trader and the fact the market is so overbought it easily convinces them to take short positions. This choppy action is just enough to wash the market of weak positions before starting another run up.

All that said, both a blow off rising wedge and a running correction are very bullish patterns for a period of time. Again I cannot state it enough, trade with the trend and the key moving averages.

Gold Shines On The Daily Chart

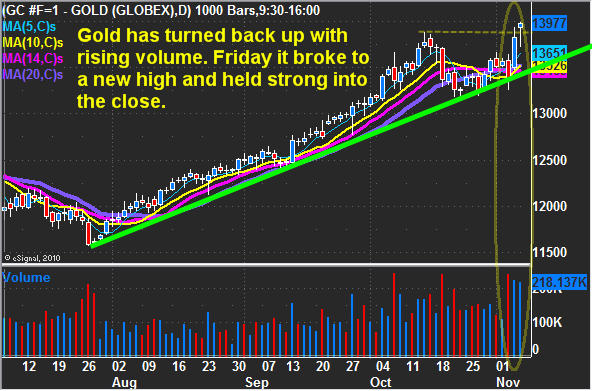
The gold story is straight forward really… Trend is up, quantitative easing is back in action and that is helping to list gold and silver prices. Key moving averages have turned back up and gold closed at a new high which shows strength.

Golden Rocket

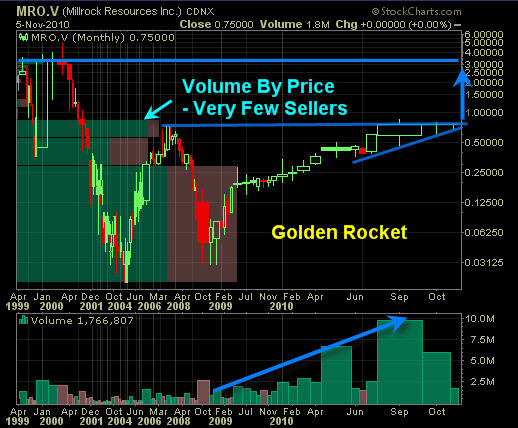
With another round of quantitative easing just starting and gold making another new high last week there is a very good chance gold stocks will rocket higher in the coming 8 months. I have been following Millrock Resources Inc. because of the team involved with this company. A breakout to the upside here could post some exciting gains if you take a look at the chart and see where the majority of volume has traded over the years along with the bullish chart patterns (Cup & Handle/Rising Wedge) with strong confirming volume. From 84 cents to the $3.50 area there should not be many sellers other than traders slowing taking profits on the way up.

Crude Oil Breaks Out Of Cup

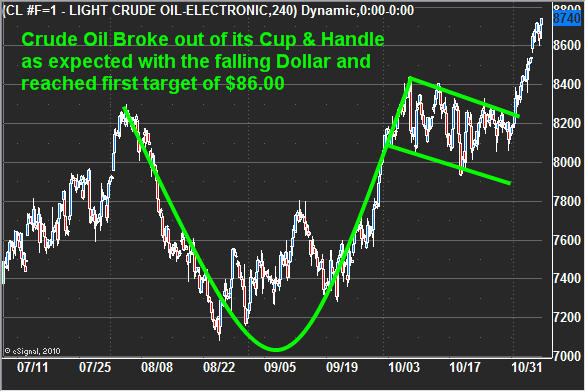
Crude oil has been dormant the past few weeks even though the US Dollar has plummeted. But last week’s news on more QE was enough to send oil higher. The surge took oil prices straight to the 2010 highs as expected and blew past my first target of $86.00 per barrel. I figure it will consolidate here for a while until we see if the dollar bottomed last week or is just testing the breakdown level.

Weekend Trading Conclusion:

In short, the market has played out exactly as we planned and all four of our positions are deep in the money. As we all know the market goes in waves in both price and for trade setups. The past couple weeks were great for getting into trades and now the market is running in our direction. It will take a few days for the market to stabilize (pullback or pause) before we could get anther round of trade setups. Keep position sizes small as the market remains overbought and a sharp correction could happen at any time. Until then, keep trading with the trend.

Disclaimer: I own shares of SPY and MRO.V

Get My Daily Pre-Market Trading Videos, Daily Updates & Trade Alerts Here: www.TheGoldAndOilGuy.com

Chris Vermeulen

This week we have a major wild card (Election) happening on Tuesday. Most of you know I don’t get involved with political discussion for several reasons… one of them being that I am Canadian “an outsider” looking in.

That being said, it looks and feels as though the market has been propped up and oil has been held down from an invisible force. Lots of theories going around saying higher stock and lower/stable oil prices will give voters the warm fuzzies to keep the current leaders elected… I prefer trading the charts and not getting caught in the Wall St. hype.

Let’s take a quick look at some charts

SPY – SP500 ETF Trading Vehicle

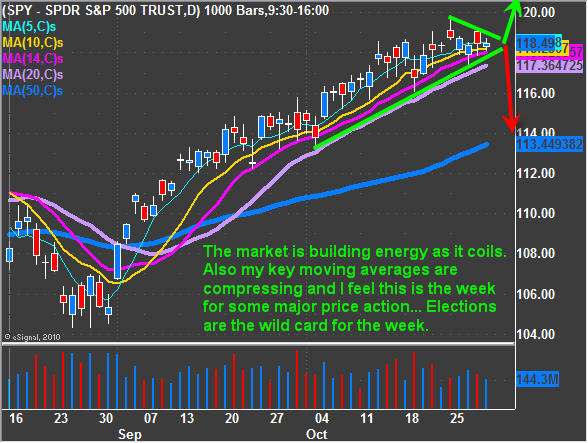
The broad market has been finding buyers as the beginning of each month and it looks as though it’s ready for another bounce. I do want to note that Tuesday or Wednesday we could see a very sharp move in the market as investors around the world digest the outcome. It is very important to keep positions small and or use protective stops incase of a flash crash or flash rally for those of you trying to pick a top.

Gold Price – Futures Contract

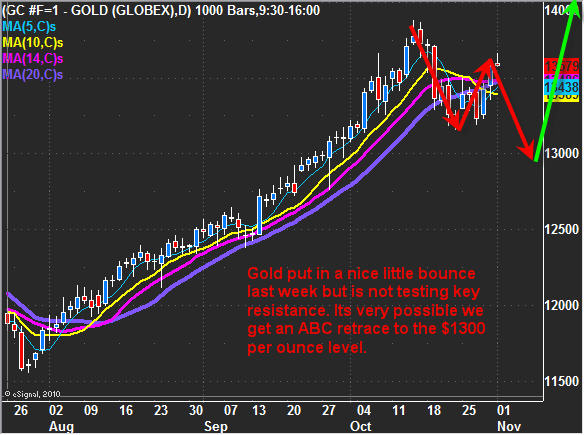
The price of gold looks to be setting up for another wave down in my opinion. More often than not we see a sharp pullback, sideways chop then a pop above recent highs. It’s that pop above recent highs which tends to suck in long positions only to roll over and make new lows quickly after. As noted in previous reports, gold has support around $1300 area and that’s what I am looking for. Again this week’s election will trump recent price action so we really just need to sit tight until the smoke settles.

Crude Oil Futures:

Crude oil has been trading sideways for a solid month while the US dollar has been dropping at tremendous rate. Many oil traders believe the price is being manipulated to stay down until the election is finished because of the strong negative affect rising oil prices have on the economy/end user/voters.

Weekend Trading Conclusion:

In short, this is a going to be a wild week in the market. Keeping position sizes small and using protective stops is crucial during times like these. We have taken profits on both of our positions from last week and have moved our stops to breakeven for the balance just incase of a crash.

Overall, I am neutral on the market for a couple days until we see what type of blip we get on the charts.

If you would like to receive my Daily Trading Commentary, Charts and Trades be sure to join my newsletter: www.TheGoldAndOilGuy.com

Chris Vermeulen
Get More Free Trade Ideas Free Here: www.GoldAndOilGuy.com

Last week was volatile thanks to China raising their interest rates a quarter basis point. This rate hike caused the Dollar to spike in value which in turn forced equities and metals to sell off sharply. This one day event caused equities to break below a short term support level causing a large number of protective stops to be triggered. This added more selling pressure causing the market to be down nearly 2.5% at one point but a late day bounce recouped a good chunk of the drop.

Wednesday & Thursday the market had a nice rally making back all of losses and then some. But Thursday afternoon we saw the market slip below a key short term support level and triggered another wave of stops. The market continues to resilience because it recovered into the close saving the day.

After Thursday’s end of day rally, we had expected a typical light volume session which typically chops around in a sideways or slow grind higher.

SPY – SP500 ETF 10 Minute Intraday Chart

I have put together a short video covering last weeks price action along with that I feel is likely to unfold this week.

SPX, Dollar, Oil & Gold Analysis Video:
http://www.thetechnicaltraders.com/etftradingvideos/FTS149/MarketTrend.html

Chris Vermeulen
www.TheGoldAndOilGuy.com – ETF Swing Trading Signals