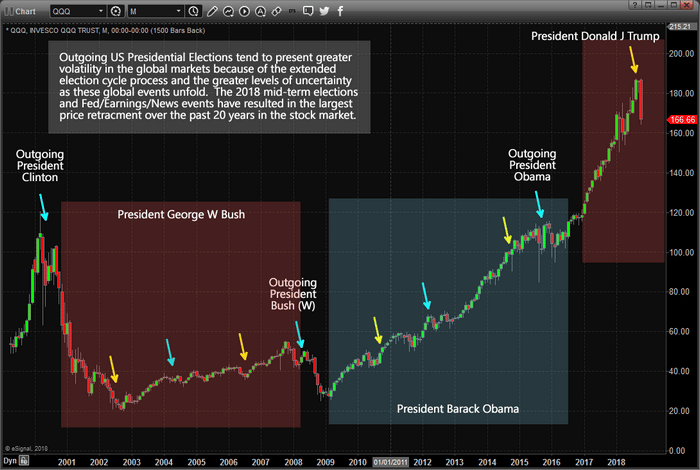
The clock is ticking on our expected bottom formation and now is the time for skilled traders to begin to position their trades for the remainder of 2018 and early 2019.  We detailed why we believe the US equities markets have already, or are currently, hammering out a price bottom after the last few weeks downside price activity.  In part one of this article, we illustrated how the US elections cycles are really more of a global geopolitical event and often drive price rotation in the months prior to these elections.  Please take a minute to read Part 1 of this two-part research post if you have not already done so.

In this second part of our US election research post, we are going to continue to review topics that were previously discussed as well as highlight how certain market segments appear to be setting up for a massive price reversal.  So, let’s get started.

Keeping in mind the information we presented in Part 1 of this research, our hypothesis is that US elections cycles present a huge opportunity for skilled traders by creating volatility and rotation in price and many segments of the global markets.  Over the past 3+ years, we have been writing about what we call a “capital shift” that has been taking place.  Near the end of the Obama presidency (2015 & 2016), a number of factors were taking place in the US and global economy.  First, the start of the new Presidential Election cycle events was already working through the news cycles – the selection of the candidates.  Second, China had recently instilled capital controls to prevent a capital outflow issue and to support their bulging economy locally.  Lastly, emerging markets and oil had collapsed, putting incredible pressures on certain foreign markets to support their local economies and find suitable sources for their investments as currencies started to collapse as well.

This event, that actually started in 2014 or so, initiated what we call the “capital shift” where cash quickly moved out of risky investments and hunted for and deployed within safer investment structures – the US and major global equity markets.  In particular, we believe the US Technology, healthcare and biotech sectors were huge beneficiaries of these new capital investments and we believe as these share prices started increasing, more and more capital kept flowing into these sectors – like a dog chasing his tail.  The price advances seem to never end…  until the 2016 election cycle event.  This caused the entire global equities markets to pause for a few months as Hillary Clinton and Donald Trump battled it out.

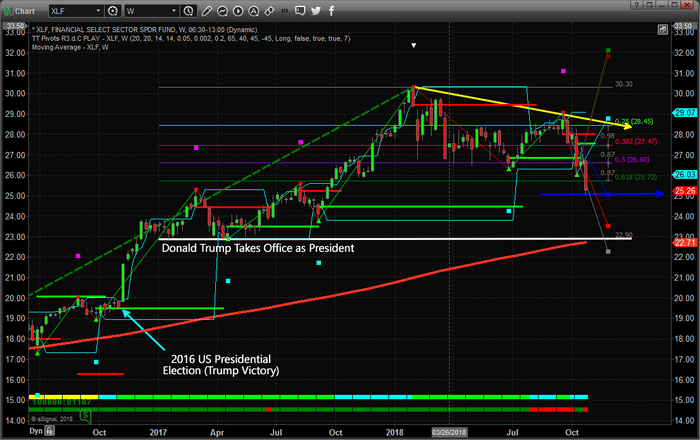
Within this Weekly XLF chart, you can see how quickly after the US presidential election the Financial Sector sprung back to life – rallying nearly 20% within the 6 weeks following the Trump victory.  This is a massive move for investors and traders.  Skilled traders know to watch for these setups within election cycle events and this is the one reason we are writing this article for you today – to keep you informed that massive trading opportunities exist over the next 3~6+ weeks.

You can also see from this chart that by the time President Trump was sworn into office, the XLF price rotated within a 12~15% range before the new Trump policies and objectives began to be announced (near October 2017).  At that time, the Financial sector skyrocketed again by another 35~40% – reaching a peak near $30.60 in January 2018.  Pay attention to what we are trying to suggest to you as skilled traders, we are about 7~10 days away from a US mid-term election that will likely present opportunities like this again and we want all of you to understand the huge potential for very big price swings that are setting up right now.  The XLF is trading near $25.25 and any upside potential to near recent highs would reflect a 12~15% price increase (or more).  Should this mid-term election result in increased fear in the markets and a related price downturn, the nearest support highlighted by the WHITE line on this chart would reflect a -9% price decrease.  Either way, up or down, the potential for the Financial sector to generate big gain is already there – waiting for us to execute.

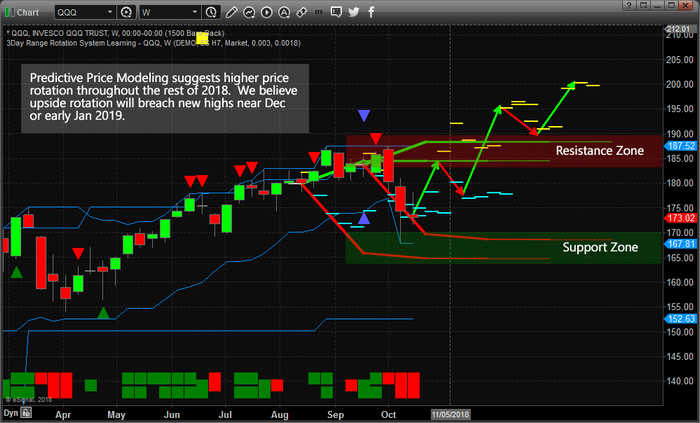
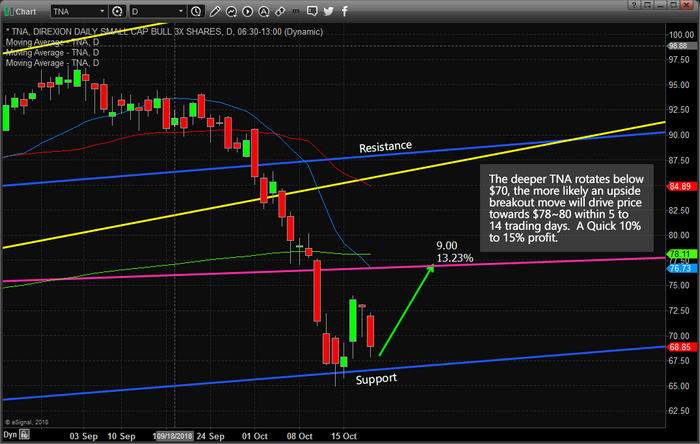
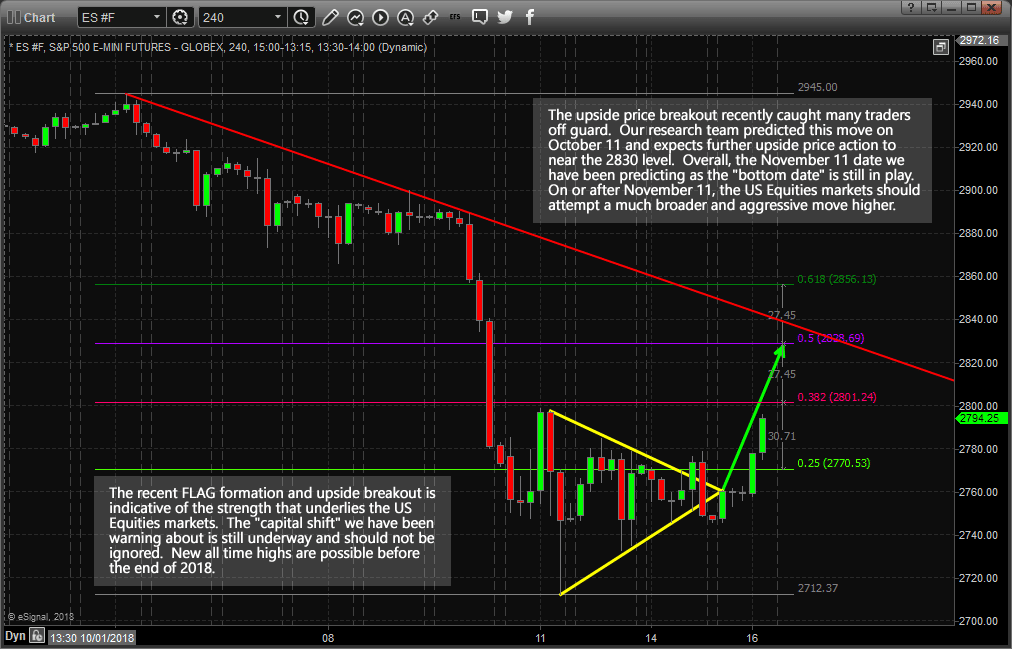
As we stated in Part 1, our predictive modeling systems have been suggesting that a major price bottom formation will setup sometime between November 8 and November 12 and that price will rally throughout the end of 2018 as the Santa Rally kicks into gear again.  The recent GDP numbers support this outcome as the US economy is knocking out 3.5~3.8% levels every quarter.

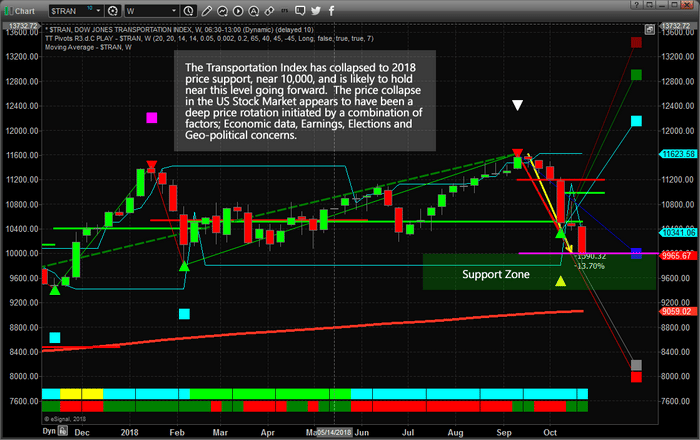
We found the move in the Transportation Index very interesting in terms of relative price analysis.  The $TRAN index rotated lower to meet our expected 5~8% targets, then blew past those levels last week to drop to below our BLUE projected Fib extension level – then recover.  The recent new low in the $TRAN will set up a new Fibonacci price bottom and will establish new upside price targets as the bottoms forms and price stalls headed into the mid-term elections.  We know this will occur as Fibonacci price theory operates on price peaks and valleys and we expect a continued price bottom to form over the next 7 to 10 Daily trading sessions.  Once this price low formation is established and confirmed, our price modeling systems will generate new upside projection levels that will help us understand how far and fast price will attempt to move higher.

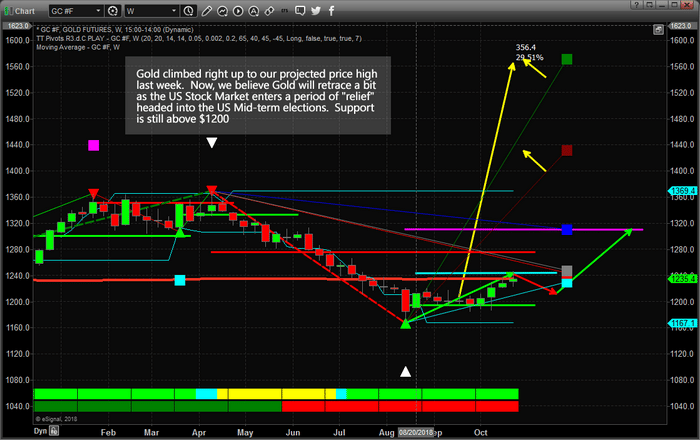
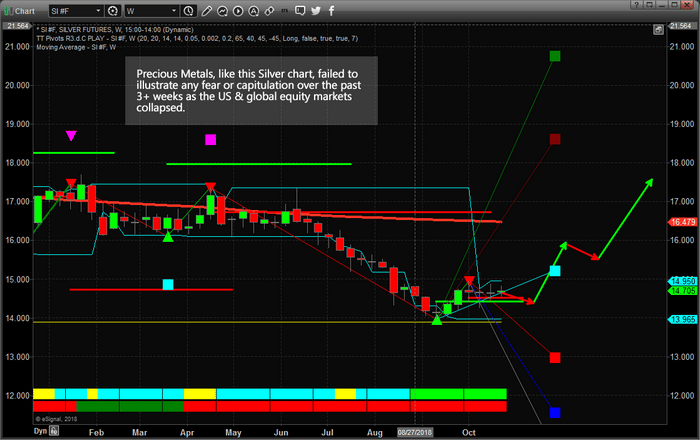
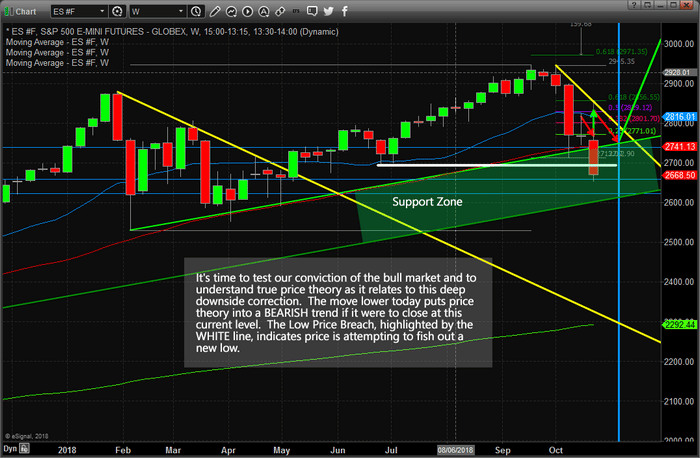
Major election cycles happen every two years in the US and are real opportunities for skilled traders.  The first rule is that you should be very cautious as major election events begin to unfold – such as major Presidential election cycles.  Understand that these events can, and often do, sew fear and uncertainty into the markets and could be predicted by some very interesting price swings in commodities, foreign markets, currencies or equities.  As the election cycle continues, prepare for the opportunities that will unfold and make sure you watch the commodities, like Gold, Silver, Oil and the US Dollar, for signs of contagion, capitulation, and fear.  We believe our September 17th analysis of a price bottom setting up near or before November 12 is still the valid outcome of this election cycle and we believe there will be huge opportunities for skilled traders immediately after this US election event.

Be prepared and don’t miss this chance to really capture some great trading opportunities.

Our predictive modeling systems called this move nearly 4 weeks in advance and now they are calling for a bottom to set up near November 10th and a price rally to resume throughout the rest of 2018.  If you want to find out how these incredible tools can help you find and execute better trades, then visit www.TheTechnicalTraders.com to learn more.

Chris Vermeulen

Almost like clockwork, our research team, at Technical Traders Ltd., predicted on September 17 the US stock market would turn lower and attempt a 5~8% downside move on or after September 21 headed into the US mid-term elections.  Our analysis of the potential downside move was related to our price modeling systems expectations that a common predicted downside target existed between -5% and -8%.  Our researchers did not believe the markets would fall much below -10% before hammering out a price bottom and finding support.

Today, we wanted to alert you to the fact that we are just 7~10 days away from the US mid-term elections and if our predictions hold true, we will be establishing a price bottom in the US stock markets over the next 5+ trading days and begin a new upside price rally fairly quickly after the election results are known.  We could interpret this as “a period of uncertainty that is mixed with economic and news data” which results in investors pulling out of the markets ahead of these types of global events.  In all reality, the US elections are really a global event for many investors.  Policies, regulations, taxes, objectives, and execution become a very big question for many as these elections take place.  Hundreds of billions of dollars are exposed to risk in the weeks headed into US elections and, thus, global investors and traders are always cautious headed into a major US election.

Our theory is that this phenomenon has become even more volatile in recent years and global political ideals have become further polarized.  We believe when a sitting US president that has served for two terms is leaving office, far greater volatility enters the global markets typically.  We believe that mid-term US elections, depending on the political climate at the time, may or may not reflect in broad global market concerns and volatility.  We’ve highlighted major US Presidential elections and US Mid-Term elections on the chart below so you can see how volatility and price rotation increase or decrease depending on the political climate and uncertainty associated with these US elections.  We’ve highlighted 6+ months (or longer) before Presidential elections and a few months before mid-term elections.

The current election event, November 6, 2018, is somewhat unique as it also coincides with the US Fed having raised FFR rates considerably over the past 2+ years as well as after a dramatic price increase in the US equities markets following the election of President Donald J. Trump.  You can clearly see from the chart below that the QQQ has increased by nearly $80+ over the past two years while that same $80 increase existed over the entire Obama stock market recovery (8 years).  This reflects the amount of increased volatility and activity that is within the current global capital market.

This QQQ Weekly chart highlights what we believe to be the core elements of this election cycle rotation.  On this Weekly chart, the overall price trend is still BULLISH (see the DARKER GREEN blocks near the bottom of the chart) and the bullish price trigger level near $163 is still valid.  Yes, the shorter term price trend is currently BEARISH and has been so since the week of October 8.  You can see the bearish price trigger level near $179 (in red) that was recently breached and the downside price target level (in blue) near $166.

Our expectations from our predictions that the markets would be rotated lower by 5~8% were that the markets would move towards the lower YELLOW price channel level and stall near these levels (or just below these levels).  We did not expect the extended price decline that was a result of earnings data and housing data being released last week.  We still believe this move has already reached its downside objectives and is in the process of setting up a major bottom formation.  We believe the extended move was an emotional price reaction to a hyper-election environment in the US and extended anticipation of caution in the global capital markets.


In the next segment of this research article, we’ll take a look at additional technical, price and modeling systems that support our belief of a major bottom formation setting up in the US equity markets and how election cycle events should be played for success.  This current downside price rotation has extended to below our expected levels – much like a deeper “washout low” price formation.  We continue to believe the next 7+ trading days will hammer out a bottom formation and that the US equities markets will resume an upside advance shortly after the elections are completed and throughout the remainder of 2018.

Please take a minute to visit www.TheTechnicalTraders.com to learn more about how we help our members find and execute success and how we can help you navigate these market rotations.  Our predictive modeling systems called this move nearly 4 weeks in advance and now they are calling for a bottom to set up near November 10th and a price rally to resume throughout the rest of 2018.  If you want to find out how these incredible tools can help you find and execute better trades, then visit www.TheTechnicalTraders.com to learn more.

Chris Vermeulen

Over the past 20+ years of research and trading in the markets, our team of traders and researchers know one thing is certain, when fear hits the global markets, precious metals react by rocketing higher.  We’ve seen this happen over and over again – even when non-US geopolitical concerns spark some true fear in the markets.

If you’ve followed our research this week, we’ve been warning about how we believe this move is purely price and technical based and not really a fear-based global price collapse.  In other words, our technical systems, price modeling systems, and other advanced price analysis tools are suggesting this move is nearing an end and was likely a function of price rotation and less a function of true fear in the global markets.

Yes, there were a couple of key factors the precipitated this price move; the Fed, Earnings, Housing Data, Trade, and Geopolitical concerns and the US Elections.  Yet the biggest concern for traders was the “deja vu” feeling that Housing could present another massive crash near an election.  We’ve been through that and we know how ugly that can be if it were to unfold again.

Our researchers, at www.TheTechnicalTraders.com, spent quite a bit of time going over the data and we continue to believe this downside price rotation in the global stock markets was nothing more than a technical price correction WITHOUT any real capitulation from other commodities.  If the recent downside price collapse sowed any real fear into investors, then precious metals should have skyrocketed higher over the past 3+ weeks.

This Weekly Gold chart shows how prices advanced moderately over the past few weeks and failed to originate any real broad upside move as equity prices collapsed.  Weeks ago, we predicted Gold would climb to near $1235, the CYAN line on this chart, before weakening to near $1200 again near the US mid-term elections.  After the elections, we believe that Gold will begin another price advance toward a price target near $1310 headed into 2019.

The YELLOW arrow showing the massive upside projections are based on our Fibonacci price modeling system and suggest that Gold may ultimately have an upside potential near $1435 or $1565 eventually.  These upside targets, if reached, would be the result of REAL FEAR entering the global markets associated with a much greater contagion/capitulation event taking place.  This may be something that happens in the future, as some point, but we don’t believe this is taking place now.

This Weekly Silver chart further illustrates the weakness in the precious metals sector throughout this recent global stock market collapse.  The price of Silver actually fell slightly over the past few weeks and stayed near $14.75.  A recent double bottom formation in Silver near $13.95 is a very strong indication that Silver is establishing a long-term base near the $14.00 level.  You can see from our draws arrows that we believe Silver will continue to contract headed into the US mid-term elections, then begin a moderate advance higher.

We are actively searching for new trades within the precious metals sector that present clear opportunities for our members/subscribers as we believe this upside move in the metals will be one of the best trades in 2019.  Although, right now, these trades are “setup trade” in the sense that we don’t expect any true fear to change price at the moment.  We do expect investors to continue to look towards the precious metals markets as a form of protection from global events in the future and we believe that when the dam breaks and fear really does enter the markets, traders need to already be positioned within the precious metals sector – not chasing after the move.

Overall, our question still remains valid – where’s the capitulation in the precious metals?  If this downside price movement within the global markets was “the top”, we have yet to see any real capitulation in precious metals, which we believe would be the first place to reflect this true fear.  Without this capitulation, our researchers continue to believe this is a technical “reversion” move where price is moving lower to re-establish support for another upside price advance.

In conclusion, we do expect moderate price advances in the precious metals sector over the next 4~6+ months.  We believe this sector will continue to attract investors as a means of protection against a sudden and more structural price collapse event in the future.  Right now, though, we just don’t see the capitulation that would need to be in place if the downside equities move instilled any real fear in traders.  It’s just not there – yet.  Therefore, this recent downside swing appears to be a capital shift or reversion event where price will quickly attempt to find support, based (headed into the US mid-term elections – as we’ve been suggesting) and begin to move higher after November 12th.

Please visit www.TheTechnicalTraders.com/FreeResearch/ to see all of our recent research posts and to help you understand what our researchers believe is really transpiring within the global markets.  Additionally, please visit www.TheTechnicalTraders.com to learn how we can help you find and execute better trades and stay ahead of these market moves.  Learn how we help our subscribers by delivering specialized content, video, research, trading signals and more.  The next few years are going to be full of fantastic trading opportunities.  Now is the time to start to take advantage of these setups and create greater success for your future.

Chris Vermeulen

Get ready for some crazy price trends in the US markets as investors react to earnings, housing data and overall re-evaluations of future objectives.  As we warned on September 17 with this post and on October 1 with this post, we believed the future Q3 earnings weeks and the 2~4 weeks leading into the US Mid-term elections could be very volatile.  We even suggested a 5~8% price correction was expected to start after September 21~24.

What we did not expect is the Federal Reserve to raise rates, again, on September 26 – just days before the Q3 Earnings season actually started.  Our price models for the Fed Funds Rates have suggested that any move above 2% FFR would put pricing pressures on homes and other assets.  This research we completed was first published in 2015 here.  This was the first time we illustrated our Fed Funds Rate Adaptive Learning modeling systems results.  The chart within this article that shows that our model expected the US Fed to begin increasing interest rates in 2014~2015 to levels near 0.75~1.25.  From that point, a gradual increase towards 2.0 was expected prior to 2018~19.  Our price modeling system then expected a decrease in the FFR from 2.0% to between 1.5~1.75%.

The reason our model expected this decrease in the FFR near current time is because the balance between growth of asset values, credit expansion and consumer’s ability to navigate efficiently within these constructs becomes very constrained above 2%.  In other words, as soon as the US Fed raising rates above 2%, they risk blowing holes in the economic recovery simply because it will outpace consumers ability to borrow and repay in an efficient manner.

We continue to believe this is the root of what is transpiring in the US Equity markets currently as a crush or reality has hit traders and investors as the housing, trade, Fed and other data is hitting the news wires.  So far, the earnings release have not been anything but a success when you look at the real data.  Nearly 75%+ of the total earnings announced as I write this post have been positive.  Yet, the markets collapsed on news related data and home sales data.  With more of this data streamed into the news cycle, we can only expect one thing to happen – a continued washout or price near recent lows or slightly lower as investors continue to digest this data and react to perceived weakness.

We urge you to understand the longer-term perspective of the markets and to understand true price theory as it relates to actual price highs and lows.  Right now, all indications are that we have entered a deeper price correction that has initiated an intermediate term bearish trend.  As of the close of Wednesday, Oct 24, price has breached recent critical price lows that has initiated this new intermediate bearish price trend.  If price can’t recover above these levels before the end of this week, then we will have a confirmed intermediate bearish price trend.  Yet, the ultimate low from February 2018 is still active as key support and a key price level that would need to be breached before we could call this a “new bear market trend”.  Right now this is just a price correction – yes, a DEEP price correction.  Those February 2018 lows are the ultimate test for a new bearish trend to setup.

This Weekly ES chart, below, helps to put everything into perspective in terms of what we are actually seeing transpire in the markets.  If you have been following our analysis, we’ve called for the markets to move lower heading into a November 8~12 ultimate price bottom before turning around and heading much higher throughout the end of this year and early into 2019.  The GREEN support zone is part of our key analysis that support our belief that this is nothing more than a very deep “washout low” price rotation happening right now.  The WHITE line on this chart shows the key price lows that are currently at risk in traditional price theory rotation.  A breach of that White line by the end of this week would indicate that we could see much further downside price movement – possibly to test the lower Support Zone level.  Beyond this analysis, the ultimate price low that is holding us back from calling this a “new bearish trend” is that February 2018 price low near 2529.75.  As long as price stays above that level, the overall bullish price trend is still in place.

This Weekly NQ chart helps to understand how the deeper NASDAQ price rotation has played out and where the true support and critical price levels are located.  The Support Zone in the NQ is much larger than in the ES.  This is because the price expansion in the NQ has been much greater than in the ES – thus, the range between current and long-term support is greater.  Additionally, we have critical price lows from February 2018 near $6164.  Although the recent price moves lower have seemed massive and a crisis like event, we are talking about 10.5% downside correction.  To give that some perspective, the correction in March 2018 in the NQ was a total of about -11.5%.  The price correction near the end of 2015~2016 in the NQ was about -18%.  The price correction near the end of 2012 in the NQ was a total of about -13%.  Want to know what happened after all of these various deeper price corrections – the market moved MUCH HIGHER.

Please pay attention to our research and our predictive modeling systems.  Skilled traders attempt to find opportunities in any market condition and execute for success no matter what the markets are doing.  Keeping a calm and rational head through all of this is critical to being able to achieve success.

Visit www.TheTechnicalTraders.com to understand how we help our members navigate these markets move and find success each day.  Remember, these huge moves create incredible opportunities for skilled traders.  Visit www.TheTechnicalTraders.com/FreeResearch/ to read all of our research posts and learn why we are still bullish going forward.

Chris Vermeulen

We have been following the news cycles for many months regarding the prognosticators that believe “the sky is falling” in the global markets and we find it interesting to see how quickly the bulls turn to bears when the market rotates 4~5% or more.  The reality is that in traditional market price rotation, a 3~5% market price rotation is a very healthy component of price advance or price declines.

When we consider the price swings within the SPY from early 2017 till now, we are looking at a total of at least 18% total Low to High price swings with a number of large 6~8% price rotations and many 2~4% smaller price rotations.  The natural rotation of price, as Fibonacci price theory teaches, is that price will always attempt to establish a new higher high or lower low in the process of extended trends.  This means that price is always attempting to find and establish some new price high or low by rotating/trending within existing/past high or low price levels.

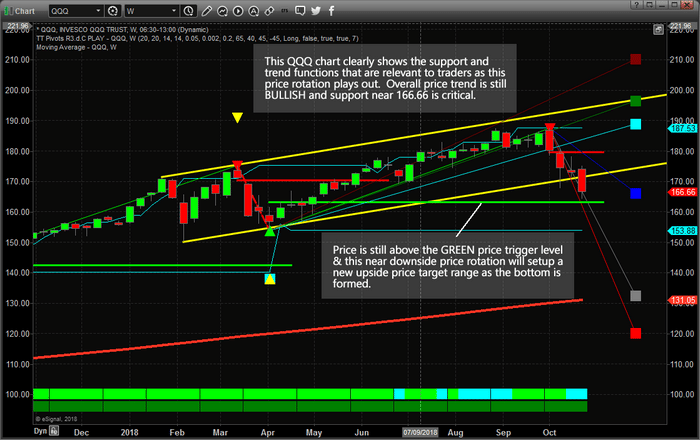
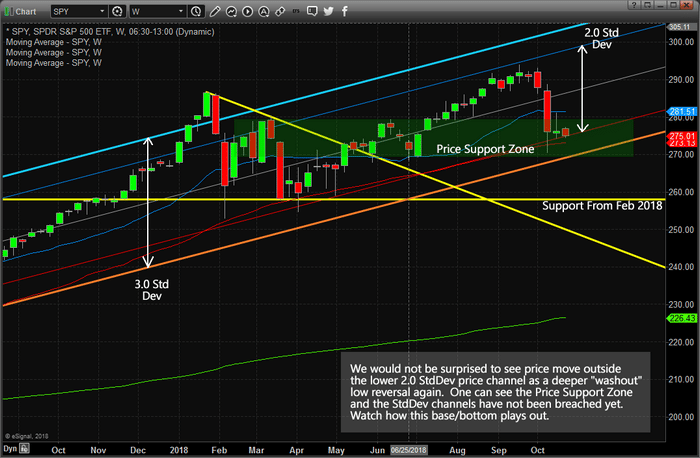
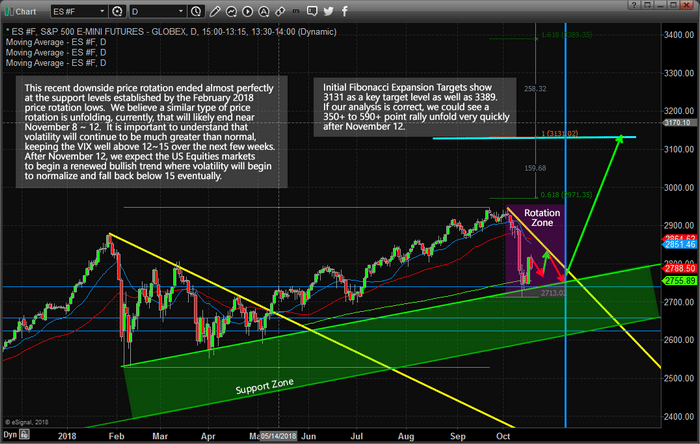
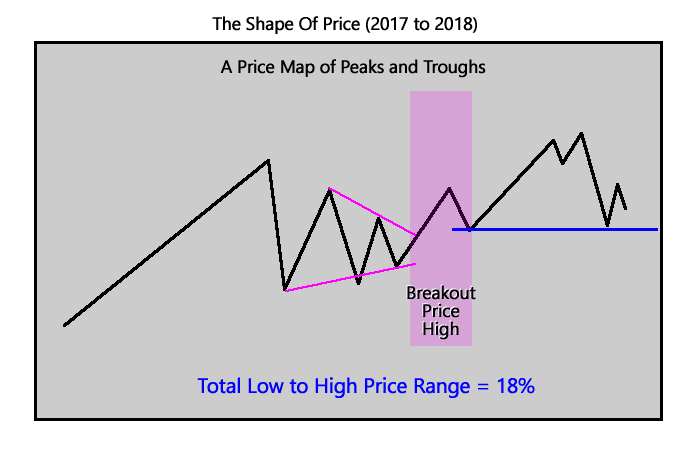
This is fairly obvious to see in the chart, above, where the initial downside price rotation in February 2018 established the deeper price low.  This low price level was still higher than the previous price low on the left edge of this chart.  As you can see, after the February 2018 price low, price continued to rotate in an attempt to establish a new “price high” or “price low” beyond the existing highest and lowest price levels.  It failed many time to accomplish this new price high or low and, in doing so, continued to rotate within a narrower price range.  Until…

May 2018 price pushed above the most recent price high channels and established a NEW Breakout Price High.  This established the price trend as Bullish again and began a normal type of price rotation higher.  In the process, it established a number of price lows that we can use as reference points for prior support and for our analysis of Fibonacci Price Theory as it relates to this current price move lower.

Getting to the current price charts and trying to make sense of the Fibonacci Price Theory example, above, is something we all need to pay attention to.  Understanding price theory is only one component of the overall analysis process.  There are many aspects to technical analysis and one of the most important is to understand how price operate within a global environment – the global economy.  Price becomes a variant of many aspects of the global economic environment and is continually related to various external factors of the global economy and the perceptions of traders/investors.  Putting it in simple terms, price becomes a factor of “whatever price investors are willing to pay for the safety and security of any type of various investment instruments OR whatever price investors are willing to sell at for the safety and security of exiting any type of various investment instruments”.

Keeping all of this in mind, remember that the US Equity market is, in our opinion, the leading capital market and investment destination on the planet right now.  There is no other source as big, as varied, as capable and as liquid as the US Equities and Capital markets.

This Weekly SPY chart highlights a few key elements of the current price swings and one key element which is the Standard Deviation channels.  Within this chart, we’ve drawn two Standard Deviation Channels that originate on November 8, 2016, and continue through today – a 2.0 StdDev channel and a 3.0 StdDev channel.  The purpose of showing you these channel ranges and levels is to more clearly illustrate the type and level of current price rotation that we are seeing in the US Markets.  The current price rotation originated near the top of the 2.0 StdDev channel and rotated to near the low of the 2.0 StdDev channel.  In relative terms, this is nothing more than a common price rotation that has yet to extend beyond normal rotational channels.

Support from the February 2018 price rotation and what we call the “Price Support Zone” are still intact and active as core elements of current price support.  In other words, the price would have to fall below $259.00 before we would be concerned with any massive Fibonacci Price Theory price reversal.

This SPY Daily chart shows the same Standard Deviation channels and the Support from Feb 2018 as key elements of this chart.  The importance of this chart is to understand that the current lows, near $270 (or the lower 3.0 StdDev channel) are the low price level that acts as massive support for this potential bottom.  Should price break below this level, then the $259 level becomes our next target and we could assume price has entered a short-term bearish mode.

Right now, we believe the bearish price trend will end near this support level and will soon begin an upward price move very similar to what happened after the February 2018 lows were established.  Volatility is high right now and the price will rotate to establish new high and low price levels just like we saw on the first chart of this article.  Eventually, price will consolidate and break to one side or the other.  Our modeling systems suggest the breakout move will be to the upside again.

Playing this move with skill and understanding of price theory and dynamics can allow you to identify and execute incredibly profitable trades throughout this price rotation.  Don’t be fooled by the news cycle content.  Expect price to rotate within a 3~4% range for the next few weeks while volatility decreases and price range decreases.  Near November 8 ~ 12, we expect an ultimate price bottom that will likely be the start of a new Bullish price trend and result in a new Breakout move to the upside.  Nothing, so far, is unusual in terms of price rotation.  Be smart and take advantage of these price setups while you can.

If you want to learn about what we do and how we help our members find greater success, please visit www.TheTechnicalTraders.com to learn more.  We pride ourselves on being ahead of these market moves and helping our members find and execute trades for greater success.  We called this downside market move over 3 weeks before it happened and you can read how we did it by visiting www.TheTechnicalTraders.com/FreeResearch/.  Please take a minute to see if our services and tools can help you create greater success in 2019 and beyond.

Chris Vermeulen

Our proprietary adaptive learning tools, specifically our adaptive predictive price modeling tool, is clearly illustrating higher price rotation over the next few weeks with a strong potential that the US equities markets will break to be all-time highs near Dec 2018 or early 2019.

Our research team has spent more than a decade studying the markets and developing specialized tools to assist us in understanding current and future price activities.  This one tool, the Adaptive Dynamic Learning (ADL) Price Modeling system is one of the more dynamic tools we have ever created.  We can ask it what it believes is the highest probability future outcome many weeks, months or years in advance.  Today, we are sharing with you what we believe will be a strong upside price rotation to close out 2018 and lead into 2019.

This QQQ Weekly chart shows two data points of our ADL price modeling system.  The reason we asked for these two points of analysis is that we attempt to identify aligning price analysis when using this tool.  In other words, when the analysis aligns well in multiple instances, we believe the outcome to be more sustainable going forward.  In this instance, data points originating from August 13 and September 17 clearly highlighted the downside rotation in early October and suggest we could see another 2 to 4 weeks of price rotation near the “Support Zone”.  These ADL predictive levels also align well with our suggestion that a November 8 ~ 12 ultimate price bottom will set up.  After that, we still believe the markets will enter a rally mode that could present a 10% to 12% upside move well above recent highs – breaking through the Resistance Zone quickly.

The one concern we have regarding this future price prediction is that out modeling systems are showing the Precious Metals are also setting up for a bigger move and that allows us to understand some of the dynamics that are at play in the markets.  If the metals begin to move higher while the US Equities markets also move higher, it would indicate a moderately strong “capital shift towards safety and away from risk” is taking place.  Thus, the US equities markets and Precious Metals would BOTH be moving higher at the same time.  We believe this could be an event that puts additional pressures on the Emerging Markets, Oil, Foreign Currencies and other commodities while the US Dollar continues to maintain overall strength.

We’ll know more in early 2019.  Right now, we can tell you that our modeling systems are suggesting “the bottom is in” and that we should be expecting upside price rotation throughout the rest of 2018.

Please take a minute to learn more about what we do and how we can assist you in finding and executing better trades.  Visit www.TheTechnicalTraders.com to learn more about our team, our tools, and our services.  Isn’t it time you invested in your future success?

Chris Vermeulen

The recent downside price rotation in the US Equities markets has been a blessing for skilled traders.  The opportunities for profits are setting up all over the markets – you just have to look for them and understand price theory.

The Small Cap ETF, TNA, is setting up a nearly perfect example of a quick in and out trade for a potential profit of 8% to 15% or more.  We understand the fear that many traders may have in the markets right now and we understand the reason why many experienced traders decide to sit on the sidelines while these types of moves play out.  Yet, we believe the opportunities that exist while these volatile market moves are playing out are some of the best setups for experienced and skilled traders.

Typically, volatility may only be only 20% or 30% of the current volatility on average trading days.  In other words, you might be waiting 3x to 4x (or more) longer for the same types of price swings to occur.  If the opportunity presents itself and you have the skills and understanding to dissect the trade, why not take the opportunity for these great, quick moves?


Let’s take a look at the TNA setup

This Monthly TNA chart illustrates the Price Channels that our research team has suggested present the opportunities for this LONG trade setup.  Our research team believes the primary BLUE price channel is acting as support for the current price near $65~70.  As long as this lower price channel holds, then the potential for an upside price reversal towards $78~80 is rather strong.  The MAGENTA target level is price resistance from 2013~2015 and would be an immediate price target for any relief rally from these lows.  The Breakdown Zone is where we want to alert our followers to be cautious.  If the price does not rally and falls below the Breakdown Zone, this trade is invalid.

1

This TNA Daily chart more clearly illustrates the trade setup that is currently setting up.  The relief rally on Tuesday, October 15, rallied to near $74 from lows near $65.  This type of price rotation establishes a price range and shows us what is capable if the price were to enter a rally mode.  Again, the MAGENTA level is our immediate price target for any new long trades near these lows.  Our opinion is that any new long entries below $70 are sufficient for most skilled traders and, of course, waiting for deeper price entries could be very advantageous.

Don’t get greedy with this one just yet.  We still believe the price will rotate lower after reaching near the target zone and form a major price bottom near November 8~12.  Think of this as a scalping trade.  Once you have entered your long position, any price level above $75 is sufficient to call this one a “solid winner”.

2


We continue to deliver superior results to our subscribers and members.  We hope you are enjoying our free research articles and are able to gain insight and understanding of our work, research, passions for the markets and willingness to share our knowledge.  If you find our work helps your trading, then take a minute to really see what we offer our subscribers by visiting www.TheTechnicalTraders.com.  Consider trying our services for a three month period to see how we can help you stay ahead of these moves and find greater profits.  If you want to read more about our detailed market research, please visit www.TheTechnicalTraders.com/FreeResearch/

Chris Vermeulen

Our research team was hard at work over the past few days.  Not only were they able to call this downside price swing 3+ weeks in advance, they also called the market bottom within 0.5% of the absolute lows.  Now, they have put together a suggested “map” of what to expect in regards to price rotation, support, resistance and the eventual price breakout that we are expecting to happen near or after November 8~12.  Today, we are sharing this detailed map with all of our followers.

Our research team, at www.TheTechnicalTraders.com, have honed their skills over the past few decades by studying market correlations, price relationships, advanced price modeling and more.  Our objective is to be able to identify price patterns, opportunities, and setups while attempting to accurately predict the future of price so that we can keep our followers and members uniquely aware of future opportunities.  As you can imagine, it is not an easy job and we often take heat for some of our research posts.

Today, we are sticking out neck out (again) and attempting to predict the future of the ES price rotation as this deeper rotation continues to play out.  Our research team believes it has identified key price levels and dates/times that are relevant to this future price rotation.  By no means is this research set in stone in regards to exact dates/times.  These are suggestions which we believe to be accurate based on our research and analysis of the markets.  Use them as guides to how this price rotation plays out.

This first chart is a Daily ES chart that shows three very important components of the current market price rotation.

_ The Support Zone below the recent lows is actually very critical to the true understanding of price rotation.  As long as this support zone is not completely breached, prices should continue to push higher overall.

_ The Rotation Zone is where we believe the price will continue to consolidate within a fairly tight range before the November 8 ~ 12 bottom sets up.  Volatility will continue to be greater than normal throughout this Rotation Zone.

_  The post-November 8 ~12 breakout is likely to attempt to target 3131 initially (a Fibonacci extension target) and we believe this move higher could explode fairly quickly.


Now that we have explained the general sense of our research, let’s dig into the numbers a bit.

Our expectation is that a price peak will occur near early morning trading on October 26 (morning session in NY).  We believe this peak will end near 2830 (a Fibonacci 50% retracement level) and we believe an extended basing pattern will precede this price peak.  The extended basing pattern, which is expected to end near 2770 (a Fibonacci 25% retracement level) is already starting to form and should last from now until near October 23 or 24.  We believe the upside move between the end of the basing pattern and the October 26th peak will be very fast and end fairly quickly – so be prepared.

The October 26 price peak will set up a very important component of our final analysis – the peak-to-peak price channel (highlighted in YELLOW now) and will allow us to determine when and where price volatility predicts the breakout move to occur.  Our research team believes another bout of extended basing will occur after the October 26th peak that will likely push just below the 2771 support levels (to near 2750) retesting the Support Zone and presenting a “false low price breakout” pattern that may sucker many longs out of the market (and potentially set up massive short seller pressures in the market).  This move may be critical to the eventual upside breakout that we are predicting.

Think of it like this, Fibonacci price theory suggests that price MUST attempt to establish new higher high prices or lower low prices at all times.  Failure to accomplish these new price levels results in a consolidating/congesting price trend that typically forms as Pennants or Flags in price.  Near the Apex of these pennant/flag formations, false breakouts (or what we call “washout lows or highs”) are common.  These are price functions that operate as a “shakeout move” where price searches for direction and where buyers and sellers are stacked on top of one another attempting to ride the next wave.  Price MUST attempt to establish a new higher high or lower low – so it must attempt to rally up and break the 2945 level or it must selloff ant attempt to break the 2712 level.  We expect extreme volatility near or after the November 8~12 apex setup.  Price could fall deep into the Support Zone before reversing higher with a bigger rally that attempts to run well above the 2945 level.

The vertical blue line is the November 8 date where we expect the absolute bottom to form and where we expect the next big price rally to initiate.  Near after this date, we expect the price to rotate with greater volatility and attempt an upside breakout move near or after November 12.  The key Fibonacci levels at 2771 & 2829 are certain to become key price rotation levels near this November 8 ~ 12 price breakout.

At this point, we have outlined some very detailed and structured price rotation levels that should clearly help you understand what is transpiring within the US Equities markets right now.  If you take only one thing away from reading this article, please understand the Support Zone that we’ve highlighted on our charts is super-critical to the ability for the US Equities markets to continue to push higher.  If this level is completely breached by lower prices (prices falling all the way below these price channels on the Daily chart, above), then our predictions of price rotation, extended basing and an ultimate upside price breakout are invalid.  This Support Zone MUST hold for our analysis to become valid.

This level of research and understanding as related to technical and price analysis is not something one stumbles upon blindly.  This takes years of study, practice, research, and understanding to be able to “see into the future” as we do.  Sure, anyone that understands basic trend lines and Fibonacci concepts can draw some lines on a chart – but their overall success rate will quickly illustrate their true understanding of the markets.  Take a minute to visit Technical Traders Ltd. website and read some of our recent research posts and pay attention to how we accurately predicted a 5~8% price correction 3+ weeks before this recent move happened.  Ask yourself, how did we know it was going to happen and how did we know it would stop near 2700?  Visit www.TheTechnicalTraders.com/FreeResearch/ to read all of our recent research posts or read how we predicted this downside price move by clicking here: https://www.thetechnicaltraders.com/predictive-trading-model-suggests-falling-stock-prices-us-elections/

Chris Vermeulen

HoweStreet.com Radio with host Jim Goddard – October 17, 2018 #Trump: The #FederalReserve is my Biggest Threat #StockMarkets, hashtag#Gold, #USDollar, #Energy, and Transports Guest: Chris Vermeulen

GET CHRIS’ TRADE ALERTS TODAY! – CLICK HERE

As fast as the downside breakout occurred, the upside recovery appears to be taking place as Q3 Earnings begin to hit the news wires.  This past weekend, the news cycles and market experts all seemed to have opinions about where the US equities market was headed after last week’s price collapse.  We’ve read everything from warnings of a $20 trillion dollar collapse to seeing Bloomberg’s SMART INDEX chart showing equity valuations are near historic market bottoms.  It seems everyone wanted to get out and share their opinions – I guess we are no different.

The facts still remain the same, until the global market dynamics change and the US equities markets break the defined price channels that have been well established, we do not see any reason to consider a 6~8% correction life-threatening.  In the total scope of the price range, this move represents less than a 25% price correction from price rotation points (as you’ll see on the longer term NQ chart below).  Yes, eventually, some critical market event might cause the US equity markets to change direction, but until then stay safe and roll in and out of trades with skill.

Our research team, at Technical Traders Ltd., has continued to stay on top of this move by predicting the downside move over 3 weeks before it happened and by calling the bottom near 2700 on the ES.  Recently, we posted two articles regarding the Q3 earnings expectations and the longer term price channels that are defining this current move.  We suggest you visit www.TheTechnicalTraders.com to read our most recent research posts.

The recent upside price swing in the US Equities markets should not have been a surprise if you had been following our analysis and research.  These types of price rotation are actually very healthy for the price and allows the price to establish support, wash out a few weaker positions and allows skilled traders to position themselves for future success.

This Monthly NQ chart shows you what our research team has identified as a price pattern going back 8+ years.  Since the 2009-10 bottom in the markets, price rotation has been limited to about 0.25% total retracements for each upward price range.  This is interesting in the sense that rotation is occurring in price, but it has historically been somewhat limited to within the 0.25% range.  This also suggests that as price continues to climb and expand, the 0.25% retracement range is also expanding.

Still, until we see a deeper price retracement that clearly breaches support channels and confirms a downside move, we don’t believe any real danger exists to the downside.  We have advised our members appropriately to watch for this move and protect their open long positions as this downside setup was identified by our team over 4 weeks ago.  Now, we are advising our members to take advantage of strategic opportunities in selected symbols because of what our predictive modeling systems are suggesting.


This 240 minute ES chart shows the recent upside breakout of the FLAG/Pennant formation near the support levels (2733~2744).  These levels were identified by our research team shortly after the bottom had formed and allowed us to understand that as long as price stayed above these levels, an upside price breakout was the strongest possibility.  The “washout” price rotation near the apex of the FLAG formation was expected as well.  Our team believes the upside price move is just starting and that price will move to near 2830 before stalling and potentially retracing back to near 2785.  Remember, our research shows that a true price bottom will not form in the US markets will somewhere near November 8~12.  Somewhere near these dates, the US Equities market should form a very solid price bottom and begin to really accelerate to the upside throughout the end of 2018.


We’ve already positioned our subscribers to effectively profit from the future moves we expect in the markets.  Our predictive modeling systems are showing us what is the highest probability outcomes and our job is to keep our subscribers well informed and ahead of these moves.  We urge you to spend a bit of time reviewing our most recent research posts to better understand the current market environment: visit www.TheTechnicalTraders.com/FreeMarketResearch/ to access all of our public research posts.  The Christmas rally should be setting up very quickly and this Q3 earnings season is likely to present some very good trading opportunities.  Get ready for 2019 by following our research and staying ahead of these market moves instead of following along after the moves have taken place.


Chris Vermeulen