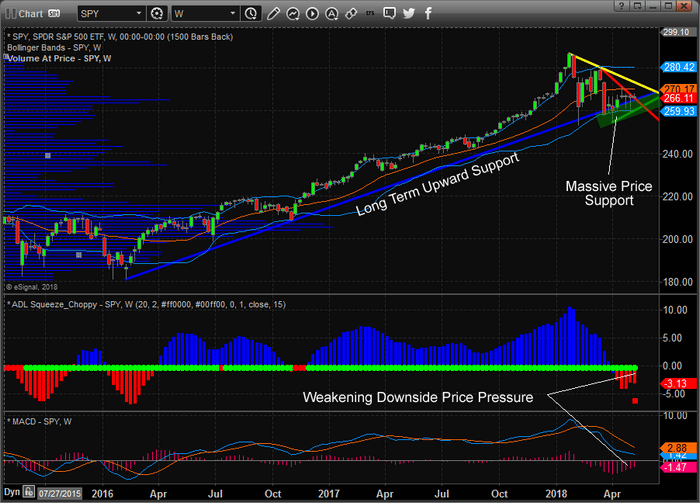
Recently, we authored an article about Fibonacci price levels in which we referred to a term called “Fibonacci Price Ladders”.  This is our own term, as far as we know, and we used it as a way to attempt to explain how price operates within the Fibonacci theory.  Our objective was to allow the reader to think of a standard ladder and how each ladder rung allows the climber to advance (move up) or decline (move down) using the ladder.  We hope it helped all of our readers to better understand the concept of how price rotates within a trend to establish longer-term price trends.

Within this post, we are going to revisit this Fibonacci Price Ladder concept to show you how recent price rotation may be setting up for a new, and possibly historical, price advance in the near future.  We urge our readers to revisit our earlier Fibonacci Price Ladder research to refresh your memory should you have any questions about this research.


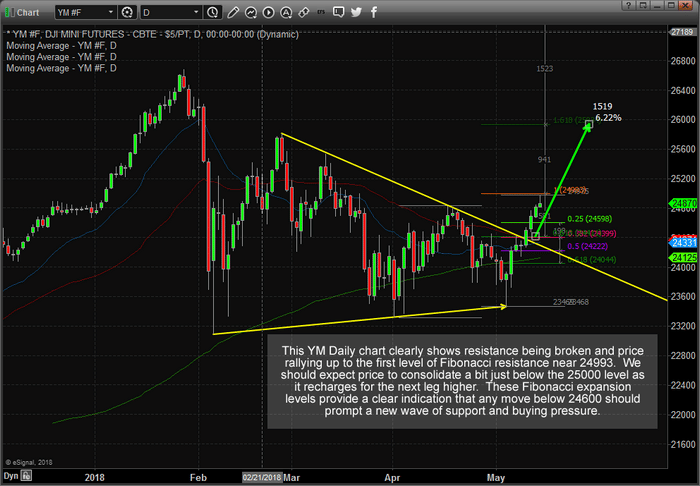
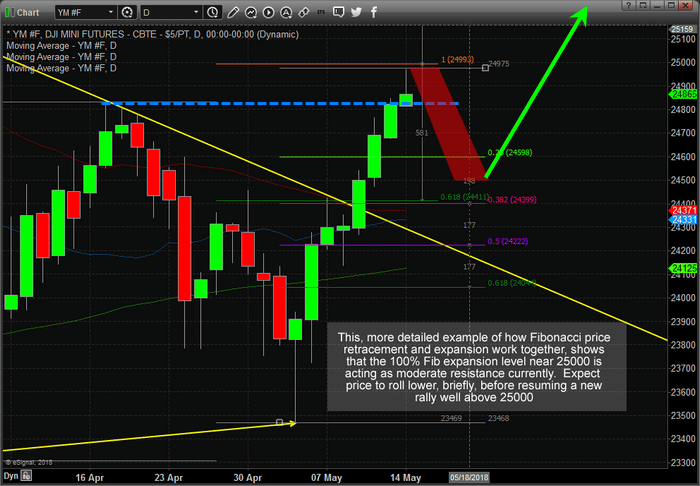
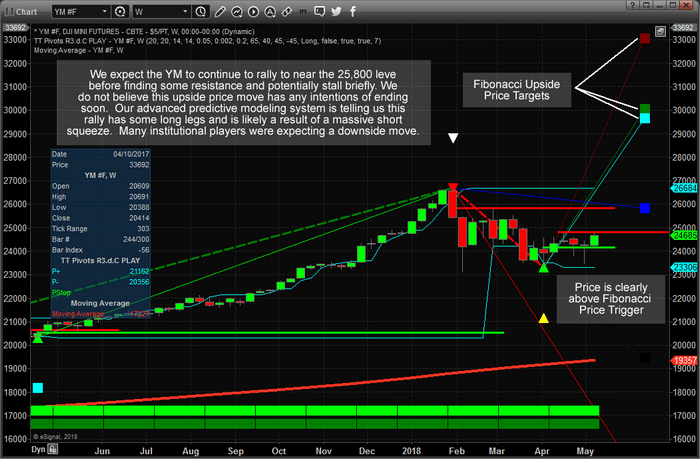
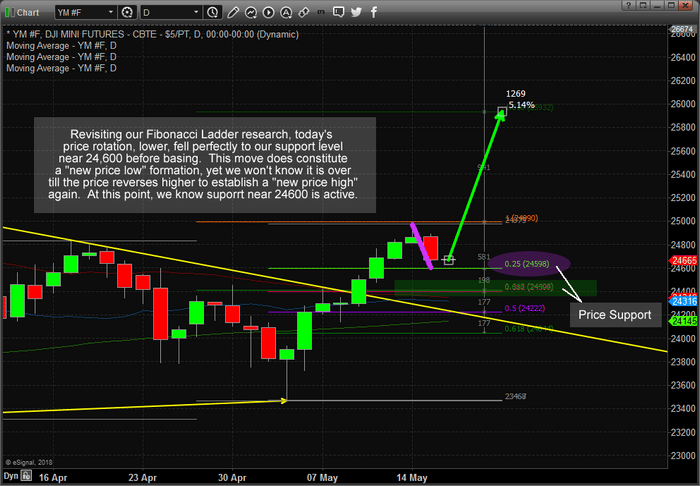
Daily DOW Index Chart

This Daily YM Mini DOW Index chart shows the price rotation, downward, that moved directly to our Fibonacci support level near 24,600.  Technically, this constitutes a “new price low” formation and could foretell the end of this price correction before a new price advance begins.  If you remember, our prior analysis has indicated a very strong potential for a very strong price move higher from recent lows.  Yes, we expected this move and actually protected ourselves and our members by pulling profits in some trades near the highs last week.  Now that this move appears to be nearing completion with a proper Fibonacci price rotation, we believe a new price bottom will form quickly near the 24,600 level (with massive support existing above 24,400) driving a new price advance within days.
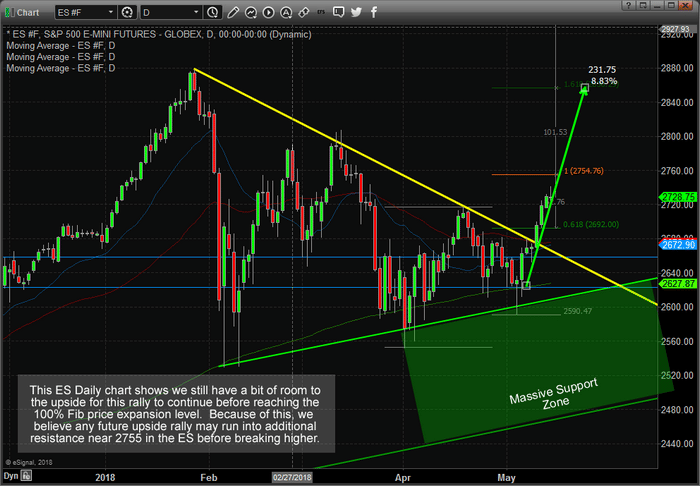
 

Daily ES Chart

This Daily ES chart helps to confirm the Fibonacci Price Ladder analysis by showing an even deeper “new price low” price rotation recently forming.  Massive price support exists in the ES between 2684 and 2700 and we believe this level will hold to form a price bottom/base before a new leg higher will advance price to new highs.

This Fibonacci Ladder process is simple to understand, once a new price high or low is established, any failure to continue to set new immediate higher highs or lower lows constitutes a potential failure of the current price trend.  So, if this recent low price move is a move to near a market base/bottom, then we should expect an upside price rotation to set up fairly quickly over the next few days.  We believe this will be the case and that traders should already be looking for new entry levels for the next leg higher.
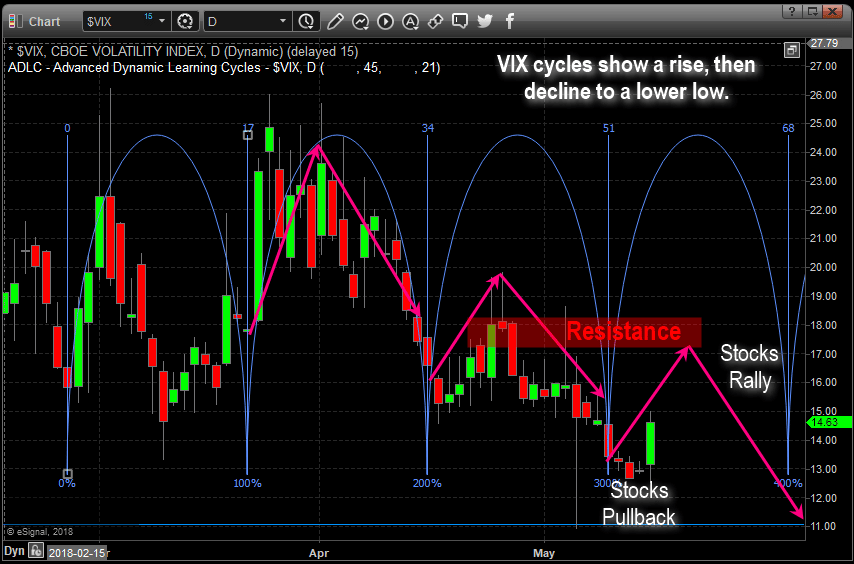
 

Daily VIX Chart

This last Daily VIX chart showing Fibonacci Time/Price cycles shows that we are nearing a major cycle date, with resistance just above the current price of the vix.  We should expect the current downside stock market price to possibly extend downward, briefly, to establish a low price rotation and then reverse higher to begin a new upside price leg.

It is our belief that the VIX will stall near the resistance level and fall back to near or below $11 as the new upside price advance in the US majors extends to near all-time highs.


Currently, we see this price rotation as a healthy normal price rotation that is essential to a further price advance.  Price MUST attempt to rotate while establishing new price lows in order to establish new price highs.  This is healthy, normal price rotation that we believe will result in a larger price advance in the immediate future.

We are already searching for new entry triggers to take advantage of the future price leg higher.  If you are searching for ways to profit from this, and other future price moves, then visit www.TheTechnicalTraders.com to learn how we can help with Daily video content, extensive and proprietary research and price modeling, detailed trade triggers and analysis and more.  Our job is to assist you in becoming a better and more successful trader.

Our 53 years experience in researching and trading makes analyzing the complex and ever-changing financial markets a natural process. We have a simple and highly effective way to provide our customers with the most convenient, accurate, and timely market forecasts available today. Our stock and ETF trading alerts are readily available through our exclusive membership service via email and SMS text. Our newsletter, Technical Trading Mastery book, and 3 Hour Trading Video Course are designed for both traders and investors. Also, some of our strategies have been fully automated for the ultimate trading experience.

We continue to appreciate the positive and supportive comments we are receiving from our followers and members.  We can’t tell you how pleased we are that all of you are enjoying our efforts to provide you with the best market research and analysis we can offer.  Today, we are highlighting some important Fibonacci price levels and how they should continue to drive price action over the next 3~10 days or so. Let’s get started.

This first Daily ES chart shows a pretty big picture of the Fibonacci price legs (the Fibonacci price “ladder” as we will refer to it in this article) and how these legs work in tandem with other types of support and resistance channels/level as price expands or contracts within new trends.  As you probably remember, one of the key factors to understanding Fibonacci price theory is that “price MUST attempt to establish new highs or lows at all times”.  Therefore, as we can see by recent price action, new price highs have been reached.  This is a clear indication that a new bullish trend is in place and we should now be searching to key levels to enter new trades.

We know the massive support zone exists below 2620 in the ES and we know a critical price channel exists between 2625 & 2660.  We don’t believe price will retrace enough to threaten any of these levels.  We believe price may retrace to near 2700 before finding additional support and developing a new base for a “ladder move” higher (likely to near 2855).


To confirm this analysis lets take a look at the YM (DOW futures) Daily chart below as well.  The Daily YM chart, below, paints a fairly similar example as the ES (S&P500 futures) chart, above).  Yet, this YM chart shows that the recent high price is very close to the Fibonacci 100% price level (a “ladder rung”) and should find moderate resistance near this level (24993).  We expect price may rotate lower to near 24598 before finding support and establishing a quick, possibly V-shaped or large lower wick type price rotation, bottom that would propel price higher to the next Fibonacci ladder leg near 25937.


This, zoomed in view of the Daily YM price chart below with our Fibonacci price levels drawn, helps to better understand what we expect to see.  As we keep trying to instill into your thinking, “price MUST attempt to establish new price highs or lows as it continues to develop trends and trend reversals in Fibonacci Theory”.  Therefore, price MUST attempt to rotate lower after establishing a new price high (as it has done recently) only to FAIL to establish a new price low (which would be a move to below 23460 – a long way away).  In doing so, the failure to establish a new price low (through price rotation) would indicate that price MUST do what?  That’s right, establish another NEW PRICE HIGH.

It is our belief that any price rotation below 24700, when price appears to be holding or forming support, would be a tremendous opportunity to identify new long entries.  Of course, the deeper the downside move, the better the entry levels will be created, but we don’t believe this future downside price rotation will be very deep – possibly just below 24500 as the lowest points for the YM.


If you have been following our research and analysis, you know we called this move nearly a month ago and have been sticking to the analysis of our advanced modeling and predictive analysis systems.

We offer some of the most complete and informative research anywhere and we invite you to visit www.TheTechnicalTraders.com to learn how we can help you find and execute better trades.  Your subscriptions help us continue to deliver these incredibly valuable research reports and we urge you to consider how our work has helped you over the past few months.  If you feel our work is superior and valuable, then support our research team and start using our research. 2018 is proving to be a fantastic trading year and we urge everyone to join us in creating greater success.

Our articles, Technical Trading Mastery book, and 3 Hour Trading Video Course are designed for both traders and investors to explore the tools and techniques that discretionary and algorithmic traders need to profit in today’s competitive markets. Created with the serious trader and investor in mind – whether beginner or professional – our approach will put you on the path to win. Understanding market structure, trend identification, cycle analysis, volatility, volume, when and when to trade, position management, and how to put it all together so that you have a winning edge.

Chris Vermeulen

Throughout this year, many analysts have focused on the price of Gold, Platinum & Silver markets for insight to the fear levels that exist in the global markets.  Demand for Gold and Silver have been near historically high levels for the past 12+ months and the ratio of Gold to Silver has continued to show that Silver is extremely undervalued in relative value to Gold.  We’ve highlighted these facts in previous articles to our readers.

The recent news regarding economic and political concerns regarding a wide range of Emerging Markets and established economies, we believe, has continued to drive upward price pressures in the precious metals markets.  We feel the Metals & Miners are setting up a unique opportunity for patient and skilled traders/investors.  Possibly, the opportunity of a lifetime if our analysis is correct.


2015 Gold Miners – Weekly NUGT Chart Pattern

Near the end of 2015, NUGT was setting up a congested wedge formation, that lasted 7 months, with clear support near $20.  This pennant formation retested support over 6 times before a “wash-out low” price pattern formed as price attempted the eventual breakout.  These types of “wash-out” patterns are common as price begins to accelerate into new trends.

Washout lows tend to flush out stops and positions from traders that have their stops too tight for the markets.  In this manner, the market is rotating in a matter to reaffirm support before the new bullish trend extends.  Notice how quickly price expanded in this uptrend and how price moved above the $30 level in just a week before continuing well above the $120 level.  We are illustrating the explosive capabilities of a congestion trade setup like this – well over 500% from the $20 support level.


2018 Gold Miners – Weekly NUGT Chart Pattern

Take a look at a current 2018 NUGT chart (below) and please pay very close attention to the similarities between these two charts.  We can’t stress how important it is to understand the opportunity we are showing you today with regards to these patterns and the potential for traders to take advantage of this setup.

The current price pattern setting up in NUGT is another congested wedge formation with support near $22.  This pattern has been setting up in the pennant formation for over 12+ months.  Price initially rallied from the initial bottom formation (December 2016) and established a price peak @ $54.80 (highlighted in RED).

Afterward, the price has continued to rotate between support and the downward sloping resistance channel presenting traders with a very extended congestion pattern.  What interests us the most about this current pattern is the length of the congested wedge pattern.  We believe the upside pricing pressure that is being built up within this wedge could be 2x to 3x (or more) the pressure from the 2016 upside breakout.  This would indicate that NUGT could rally well past the $100~140 level when this breaks – again a 500%+ price advance.


2018 Gold Miners – DAILY Chart Pattern

This Daily NUGT chart shows one of our price modeling systems and shows it has clearly indicated a new bullish trend began on April 10.  Lower price support is currently near $24 and ultimate support is near $22.  You can see from this modeling system chart that any upside breakout above the CYAN Standard Deviation channel would be very positive within this bullish trend and likely prompt a further upside price rally.

Clearly, any chance at a new trade entry near or below $24.50 is acceptable with risk near $2 per share.  Remember, if this breakout/rally happens as we expect, a “wash-out” price rotation may precede this move where stops need to be soft in nature.  Support is near $22, but the “wash-out” price rotation may attempt to test price levels below $22 before the massive upside rally begins.  So be aware that the smart play is to understand the risk of this trade and play it knowing a “wash-out” price rotation may happen as price breaks these channels.

It is not often that the markets provide traders with these types of setups.  These are the type of trades that can make 400~500% or more on a single trade over 4~6 months.  We focus on finding opportunities for our members and delivering success for them every month.  Members to our Wealth Building Newsletter have already been alerted to this trade setup, and others and will know when a position should be initiated.

Our other recent trade alerts, that are up well over 10% each are UGAZ, FAS, and TECL.  These have been rocketing higher – as we predicted.  On Friday we closed our TECL position which hit our resistance level and we locked in the 18.3% gains with our members.  The single point of success for all of us is to manage our assets well in an attempt to achieve greater long-term success.

If you’ve been following our research and analysis and find it valuable, please visit www.TheTechnicalTraders.com to support our research team and become a valued member.  The markets are full of incredible opportunities like this and we focus on delivering critical market research, analysis, Daily video content, detailed trade triggers and continued support for our members.  We know you will not find anything like our proprietary price modeling systems and adaptive predictive modeling systems anywhere else.

Our 53 years experience in researching and trading makes analyzing the complex and ever-changing financial markets a natural process. We have a simple and highly effective way to provide our customers with the most convenient, accurate, and timely market forecasts available today. Our stock and ETF trading alerts are readily available through our exclusive membership service via email and SMS text. Our newsletter, Technical Trading Mastery book, and 3 Hour Trading Video Course are designed for both traders and investors. Also, some of our strategies have been fully automated for the ultimate trading experience.

Our research team wanted to alert our followers to the incredible opportunities that continue to present themselves in the current market.  While many people have been overly concerned about a market top and price rotation in the US majors, the Energy sector and many others have seen incredible price moves.

Take a look at this XLE chart as an example.  Yes, we know that Oil has rallied from about $60 to closer to $70 recently, yet we want you to focus on the price pattern that setup this move in XLE.  Specifically, we want you to focus on the Multi-Month Base pattern in price between early February and early April of 2018 as well as the upside breakout that followed.

In true technical analysis theory, price tells us everything and indicators assist us in relating current price movement/action to historical price movement/action.  This simple chart illustrates how price setup a top/resistance zone near $78 in early January 2018, broke lower in early February, then setup a multi-month price support base for nearly 60+ days.  This price support base because an extended bottom formation and a “price support zone” by testing and retesting the critical $65~66 price level while establishing a series downward sloping high price peaks.  When it finally broke free of this support zone, near mid-April, price skyrocketed higher (+17% or more).


With the stock market showing all the signs that it is in the late stage of a bull market this is when traders need to start identifying the hot sectors or high probability continuation patterns. Why? because we have entered a stock pickers market. It’s simple really, it means all the stocks are not going to be rising together and if you put your money into the wrong sector you could lose money while the markets rise.

So where is the next hot sector? we believe a very similar pattern is setting up in the IYT (Transportation Index) just like we saw on the first chart of the XLE. We feel an upside breakout move is likely to happen within the next two weeks.

The setup of this price pattern is a bit broader and more volatile than the XLE Multi-Month Basing pattern – which means the IYT upside breakout could be more volatile and dramatic in form (possibly driving price +10% to 20% over an extended period).

Additionally, the high price peaks are setting up in a similar format with lower high price peaks over the span of the base.  Support near $182.50 to $185 is critical and we believe the eventual upside breakout will be an incredible opportunity for traders.


This breakout will coincide with much of our other analysis of the US major markets which we have been sharing recently.

Our other recent trade alerts, that are up well over 10% each are UGAZ, FAS, and TECL.  These have been rocketing higher – as we predicted.  On Friday we closed our TECL position which hit our resistance level and we locked in the 18.3% gains with our members.  The single point of success for all of us is to manage our assets well in an attempt to achieve greater long-term success.

If you have not seen or read much of our recent analysis, please visit www.TheTechnicalTraders.com to learn more and review our work.  Our exclusive members are already positioned for many moves like this in the markets and more continue to form each week.

We urge you to consider joining our Wealth Building Trading Newsletter as a member to receive our incredible insight, proprietary research, and trade alerts to assist your own trading success.  We have delivered insights and research to our members that have clearly informed them of where we believe the markets are headed for many months in advance.  Imagine how powerful that kind of research could be for you?

53 years experience in researching and trading makes analyzing the complex and ever-changing financial markets a natural process. We have a simple and highly effective way to provide our customers with the most convenient, accurate, and timely market forecasts available today. Our stock and ETF trading alerts are readily available through our exclusive membership service via email and SMS text. Our newsletter, Technical Trading Mastery book, and 3 Hour Trading Video Course are designed for both traders and investors. Also, some of our strategies have been fully automated for the ultimate trading experience.

Chris Vermeulen

As we close out this very successful week of trading, we wanted to provide some additional analysis and research regarding our belief for what next week holds.  Before we get into the analysis for next week, lets take a bit of time to recap this week’s success.

Our other recent trade alerts, UGAZ, FAS, TECL, SIL and GDXJ have all been moving up quite well.  UGAZ, FAS and TECL have been rocketing higher – as we predicted.  Today, we closed our TECL position to lock in the 18.3% gains for our members with the intent to reenter with new trade opportunities as our strategies tell us.  The single point of success for all of us is to manage our assets well in an attempt to achieve greater long-term success.  We are still holding the other trades open for larger gains next week.

Now, onto our research and analysis.  This Daily SPY chart shows us that price has already breached the recent price peak level – indicating that an attempt to push to new price highs should continue.  Yet, the downward sloping resistance level (in YELLOW) is the current boundary for price and price has stalled at this level.  This is to be expected after such a nice run upward and with price reaching this resistance level.  We do expect price to advance much higher over the next few weeks, but we are also aware that price may rotate a bit near this level before attempting to breakout to the upside.

This weeks strong rally we warned and showed this exact chart before price broke out, take a look.


This Daily Transportation chart shows the opposite side of the bullish breakout – where price has broken the downward sloping resistance channel (drawn in RED) yet has not broken the most recent price peak level.  Again, price MUST attempt to establish new price highs or lows based on Fibonacci price theory.  Although a recent intermediate price peak has been broken, we would like to see technical confirmation that the major price peak is breached to confirm that the upside trend will extend further.

Yesterday, we sent an update that included the Weekly YM ADL predictions (below).  We want to stress that as long as the ADL system is predicting much higher price targets and current price levels stay dramatically away from these predicted targets, we are seeing a “price anomaly” pattern setting up.  We have seen many of these over the past few weeks and months.  When these types of patterns setup, price usually breaks towards the predicted price levels VERY QUICKLY & VIOLENTLY (very much like what happened in early February with the dramatic price drop).

We believe the reason for this is that price should be nearer to the predicted ADL levels and, when the price anomaly pattern sets up, the external pricing factors that are preventing price from nearing the ADL levels is in control of price.  As price finally breaks free of these external factors, price will attempt to “recover” towards the predicted price level and this move can sometimes be very quick (and profitable).

Be prepared over the next few weeks as we try to guide our followers towards some incredible profits.  We are still waiting for technical confirmation of this breakout, but it should not be long now.

Our articles, Technical Trading Mastery book, and 3 Hour Trading Video Course are designed for both traders and investors to explore the tools and techniques that discretionary and algorithmic traders need to profit in today’s competitive markets. Created with the serious trader and investor in mind – whether beginner or professional – our approach will put you on the path to win. Understanding market structure, trend identification, cycle analysis, volatility, volume, when and when to trade, position management, and how to put it all together so that you have a winning edge.

Enjoy your weekend and be safe.  This has been a great week and next week should be even better.

Chris Vermeulen
www.TheTechnicalTraders.com

We can’t believe how so many people did not see this upside price swing setting up over the past few weeks.  The research we conducted over the past few months was showing us a very clear picture that the US markets would advance in a dramatic format after settling a price bottom after the early February price drop.  We would like to remind our readers to reference this link to see how we called this move months (published January 19, 2018) in advance.  To quote our earlier work before the markets made all these moves…


“Somewhere near or after February 19th, we expect the NQ price to break to the upside with another 3~5% rally (again, another 350+ pt swing) that should end near March 15th and begin a dramatic downward price move.  The ending prediction of the ADL system for April 23, 2018 is $6846.25 – pretty much exactly where we are at right now. “


When you consider the fact that we were making and publicly publishing these predictions about what price would do many weeks in advance and somewhat accurately predicting many of these price swings, one has to ask “just how powerful are these adaptive price modeling systems and what advantage can that provide me?”.

Today, we are going to share some Weekly Adaptive Fibonacci price modeling that clearly illustrates we are in for a very exciting ride in the US markets.


SP500 INDEX WEEKLY CHART – (SPY ETF)

This first chart of the SPY is showing us that the current price level is well above the Bullish Fibonacci Trigger level which indicates that current trend is to the upside.  It also points to resistance being just below the $280 level.  The current price level has already breached a previous price peak and if price advances further by the end of this week, we will consider this a confirmation of a new rotational price high which will further strengthen our opinion that price will push dramatically higher.

Please note the upside Fibonacci price targets because they indicate we could be in for a very dramatic and extended price rally from current levels.  The first upside price target level is @ $299.45, the next higher level is @ $318.50 and this furthest target level is @ $331.40.  These represent a +10% to +21% upside potential in the SPY.  You better believe you won’t want to miss this move and you better be prepared to know how to trade it because we believe volatility is here to stay and nothing goes straight up. We currently have 5 open winning positions with three of them up over 10% already!


YM (DOW FUTURES) WEEKLY CHART

 Taking that same analysis model and applying it to the YM (Dow Futures) Weekly chart presents an even more dramatic picture of the future price potential.  The charts are fairly similar in structure, although where the SPY has already breached the most recent price peak levels, the YM has yet to accomplish this.  This would be one thing we are still waiting for in terms of confirmation of the upside potential in the YM.

Yet, taking a look at the other data from this advance price modeling system, we have a very clear indication that a major price top has recently formed near the early February price peak.  We can also see an intermediate price bottom has formed near April 2 – resulting in a new upside price rotation.  Fibonacci price theory indicates that “price MUST attempt to establish a new price high or low at all times”.  Therefore, the failure of the SPY and YM to break below the February 2, 2018 price lows indicates the markets were attempting to hammer our a bottom formation.  The rotation of lower high price peaks while the February 2 ultimate low held was a very clear indication that we just needed to wait for the price rotation to establish a new high before we could call a formal end to this downside price swing.

That time is almost upon us as recent price rotation has established a new “higher” rotational price low (on April 30th) and the SPY & NQ have already breached these levels to the upside.  Now, we are just waiting for the other US majors (ES & YM) to accomplish this price trigger and we will have confirmation that “price is telling us it wants to rocket higher.

Look at the upside range in the YM – incredible.  The first Fibonacci target level is @ 29,683, the second one is @ 30,055 and the highest one is @ 33,058.  Let me put that into perspective for you, these represent an upside potential of between +21% to +35% in the YM.


We are certain you are asking yourself “how in the world can this be possible?  Everyone has been saying the markets are going to rollover and tank??”  We are simply reporting what our modeling systems are telling us is the most likely outcome and we want to urge you to understand these predictive price targets could be months out into the future.

Additionally, new price rotation will create revised price targets as one of the key functions of Fibonacci price theory is that “price will always tell you where it wants to go” as long as you understand how to apply proper Fibonacci price theory.

The final component to all of this research is to ask yourself WHY the US markets would have the potential for +10% to +20% or more upside price moves if everyone thinks the US markets are going to rollover and start trending down?  Could it be that so many people have concluded the wrong analysis?  Could it be that something dramatic is about to unfold in the global markets that would make the US markets appear to be the “best and safest asset on the planet”?  Could it be that we are setting up for a massive leg higher and nearly everyone on the planet has failed to see the upside potential?

Our members have access to much greater insight and analysis than we can share here publically.  We reserve our most advanced price modeling systems, predictive analysis and research for our exclusive membership levels.  We are warning you that a massive upside swing is about to setup and you’ll want to be prepared for it because this could be a true “once every ten years” type of move.  We also urge you to consider joining www.TheTechnicalTraders.com as a member to receive all of our detailed updates, daily videos, trading signals and more.  If you don’t believe we can assist you in your future with our research, analysis and other features and benefits, you can cancel your subscription and move onto something else.  Either way, we urge you to be prepared for this next move higher and take a few minutes to read over our most recent public research posts.

Visit www.TheTechnicalTraders.com to see how we can help you achieve greater success.

Since before the start of 2018, we have been relying on our advanced predictive modeling systems, technical analysis and our understanding of the capital markets to help our members take advantage of the incredible price swings in 2018.  For those that have been following our calls, we’ve pretty much nailed every market turn over the past 5+ months perfectly and have been able to call many of the tops and bottoms in the markets two to three weeks (or more) in advance.  Honestly, do you know of any other research firm that can call marker reversals nearly a month in advance and be correct in timing it?

As of the beginning of May 2018, we’ve made our best predictive modeling tools a “Members Only” feature that will help our members secure greater success and see where the markets are moving weeks or months in advance of the move.  Without giving away “Members Only” details, here is what we can share with you today.

These charts of the SPY and Transportation index should help to clear up any confusion with direction and potential in the markets for most of you.  Far too many people have been concerned with the global markets while thinking these concerns could negatively result in the US markets contracting.  Our opinion is a bit different than many other analysts.  We believe capital will come rushing into the US markets if weakness or concern continues in foreign/emerging markets.  We believe these concerns will spark a “capital migration” into the US where it is likely that Equities and Commodities continue to rally as many foreign markets continue to weaken.  Capital (CASH) is always searching for the best returns and will source the safest locations for ROI.

Take a look at this Daily SPY chart.  It clearly shows the sloping resistance and support channels that are containing price over the past few months.  Additionally, above the current price you can see horizontal PEAK resistance levels that should be considered upside targets and DUAL resistance levels (Red & Yellow) that are currently holding price from rallying upward.  If you take a look at the lower indicators (ADL Squeeze and the MACD), you will see that price is very narrowly congested while recent support is evident with “higher low points” in price.

A broader look at the SPY Weekly chart shows a similar perspective over the past 3 months of price action, yet we can clearly see the Long-Term Upward Support channel as well as the Massive Price Support “block” that is near the right side of the chart.  Again, the lower indicators are showing a weakening bearish price trend that coincides with technical price patterns illustrating price support is holding up well.  The only thing holding this market back right now is the US Dollar and fear that any global market crisis could hinder the upside potential.

Think about it, the US economy is still fairly strong and unless something derails it in a massive form, we don’t believe the downside risks are a concern at the moment.  We believe that global capital will be moving into the US equity market faster than ever as a gradual weakness (“cold”) takes hold of many foreign and emerging markets.  We believe the upside potential at this point in the market is the most likely outcome and we are trying to illustrate how we believe the markets will react over the next few weeks.

Lastly, lets take a look at the Weekly Transportation Index.  The fact is that all of these charts are similar in structure and form.  It is almost like the markets are screaming at us and telling us what will happen next.  Yet so many analysts are still fearful of downside pressures and predicting a top formation that will prompt a downside move.

We believe the support levels we are showing on our chart would have to become threatened or breached before any downside move potential has any real chance.  We also believe that price has been indicative of an upside reversal pattern within this extended Pennant/Flag setup.

Yes, there was reason for some concern back in February, when the market volatility skyrocketed and the initial price drop frightened pretty much everyone.  But our belief is that the recent price patterns, support and indicators and our advanced predictive modeling systems have shown us a different picture completely.  We just don’t see it happening.  We don’t believe the markets have much downside potential at this point in time and we have identified multiple unique trades that we have alerted to our members to take advantage of the future price swings.

If only you knew what our predictive modeling systems were telling us.  If only you knew what our adaptive Fibonacci price modeling system was telling us.  If only you knew what our adaptive cycle analysis system was showing us.  You would probably be doing much of the same things we, and our members, are doing right now.

We’ve tried to give you a hint in regards to what our advanced technology is showing us and we want to remind you that we called this market bottom over three weeks ago.  As long as these support levels hold and nothing dramatic derails the US economy and expectations, we believe the opportunity is for an upside price breakout that may drive prices to new all-time highs.

Our members are uniquely positioned and taking advantage of this move already.  You owe it to yourself to visit www.TheTechnicalTraders.com to see how we can help you stay ahead of the markets and profit from these types of price swings.  Our latest trade resulted in nearly 9% profits in just a few days.  As a commitment to our members, we save the very best for “Members Only” with our proprietary adaptive price modeling systems that can show us what price will likely be doing days and months in advance.  We urge you to becoming a member and share in the success we deliver for all of our valued subscribers.  Besides, your subscription helps support the development and research team that brings you all of these tools and technology.

53 years experience in researching and trading makes analyzing the complex and ever-changing financial markets a natural process. We have a simple and highly effective way to provide our customers with the most convenient, accurate, and timely market forecasts available today. Our stock and ETF trading alerts are readily available through our exclusive membership service via email and SMS text. Our newsletter, Technical Trading Mastery book, and 3 Hour Trading Video Course are designed for both traders and investors. Also, some of our strategies have been fully automated for the ultimate trading experience.

BECOME A TECHNICAL TRADER TODAY AND PROFIT! – CLICK HERE

On Wednesday, May 2, we issued a research post supporting our position that the markets were nearing an apex breakout and that critical support and resistance levels had established within the market.  We indicated that volatility is usually quite high throughout these apex breakout moves with the potential for a “wash-out” price rotation in the works.  In other words, as these apex breakouts happen, price can sometimes, falsely, break to one side or the other and rotate very quickly to the other side – creating what we call a “wash-out” price reversal.

Closing out this week, prices broke lower on Thursday, May 3, and reversed sharply before the end of the trading session to create a “wash-out” low formation which is indicative of a price bottom.  We felt strongly that our ADL price modeling system’s analysis as well as this bottom formation are strong evidence that the US majors will enter a new upside price trend very quickly.

Last week we entered three trades to take advantage of this increased volatility, fear and large price swing in the markets with subscribers of our service. We took partial profits of 4% on one, the other is up over 7%, and the third is on the verge of a big move of 20% or more.

In this post we want to share with the markets general direction because there are some hot sectors and hot commodities that should have incredible moves over the next several weeks.


SP500 Channel, Washout Low & Breakout

As of Wednesday, May 2, there were two levels we were watching: support at 2623 and resistance at 2658.  The triple top formation in the ES was indicative of major resistance near 2658.  We didn’t believe this range will hold for very long as our ADL price modeling system was predicting an upside price breakout.


SP500 Pennant Formation

This ES Weekly chart clearly shows the pennant formation, lower price support channels and the two intermediate support and resistance levels drawn on the price chart, above.  Our interpretation of the current market setup is that price may continue to rotate in somewhat violent modes until the breakout is completed.  The breakout price move we are expecting could happen any minute between now and the end of next week.  We believe this is the most likely time span for price to attempt this breakout move.

On Thursday, May 3, the markets created a moderately deep “wash-out low” pattern that we called in our Daily morning video to our members.  We execute a few trades at bottom of this price rotation to take full advantage of this move.

Our previous research indicated the markets would attempt a rally within the next few weeks and we knew this price apex formation often includes volatility “wash-out” reversals near the end of the move.  Our instincts proved very successful as the markets opened and rallied on Friday with a follow-through rally.


NASDAQ Pennant Formation

This, the NQ Daily chart, clearly shows the bullish price breakout that happened on Friday.  This is the start of the “bottom confirmation” that we’ve been warning about for weeks.  The next upside move to this formation should push NQ prices to well above 7000 and higher.  Pay attention to how this move coincided with a Time/Price Cycle pattern indicating that we should have strong upside price movement over the next 5~10 trading days.


SP500 Pennant Formation Still Intact

This ES Daily chart shows that the S&P has not confirmed the price breach pattern just yet and will likely rally past this level early this week.  This chart also shows the critical support and resistance levels that we had been watching over the past few days and provides a clear example of what a “wash-out” low looks like.  Upside potential in the ES is clearly 7%+ over the next few weeks.


Our research team dedicated many hundreds of hours into digging into the underlying factors of the markets and developing advanced price modeling tools.  Our Advanced Dynamic Learning price modeling systems and Adaptive Fibonacci price modeling systems are only available to our members.

If you have been following our analysis over the past few months, you know how valuable our research and timing tools are to creating success.  We urge you to join our group of traders/members by subscribing today at www.TheTechnicalTraders.com to help support our continued efforts to create success for all our members.  We continue to be 2~3 weeks (or more) ahead of the markets while almost everyone else is 2~3 weeks behind the markets.  Which side do you want to be on?


CORE COMPETENCE

53 years experience in researching and trading makes analyzing the complex and ever-changing financial markets a natural process. We have a simple and highly effective way to provide our customers with the most convenient, accurate, and timely market forecasts available today. Our stock and ETF trading alerts are readily available through our exclusive membership service via email and SMS text. Our newsletter, Technical Trading Mastery book, and 3 Hour Trading Video Course are designed for both traders and investors. Also, some of our strategies have been fully automated for the ultimate trading experience.

Over the past few weeks, we’ve been telling our members and the general public that the markets have established a bottom and that prices should begin to advance near the week of May 7th and beyond.  Many people may have been skeptical of our analysis, given that so much market noise is out there and that the markets have been under pressure for many weeks.


FINANCIAL SECTOR ETF TRADING

This week, our members were alerted to the likelihood of an “apex volatility”, a washout low price rotation (called in our pre-market morning video on May 3. Members were alerted to get long FAS at $59.93 during the panic selloff Thursday morning and FAS has since rocketed over 7% already.


CRUDE OIL ANALYSIS POSTED YESTERDAY

Oil is particularly interesting to us because we believe the rotational top in the US Dollar will result in support solidifying in Oil near or above $66 and launch Oil into a new upside rally to well above $70.  It makes sense to us that weakness in the US Dollar with the corresponding upside pressure exerted on commodities will present an easy upside move in Oil for traders who see this move coming and are willing to take the trade.

Any Oil price move below $67 is well within our GREEN highlighted support zone and should be considered a BUY ZONE for this trade.  Remember, as this rotational top in the US Dollar plays out, there could be some volatility in both the US Dollar and Oil, so spread out your trades over a couple days to reduce risk.


Please visit our blog some of our recent research posts to see for yourself how we were able to “nail” this move for our members and alerted our followers to these moves in some cases nearly three weeks ago. It seems almost too amazing to consider, but our predictive price modeling systems have been nailing these market moves since the beginning of 2018.

You really owe it to yourself to visit www.TheTechnicalTraders.com to see what we have to offer.  Imagine having a dedicated team of professionals that can assist you in understanding the future market moves, providing daily pre-market video analysis and providing detailed trading triggers for you.  Add into these already fantastic features the ability to have access to our incredible predictive modeling systems that can assist members in seeing into the future and knowing what price should be doing days, weeks and even months into the future.

Want to have access to this level of research continually? Become a profitable technical trader today!

JOIN OUR 1-YEAR SUBSCRIPTION AND SAVE BIG TODAY!

Our recent analysis of the US Dollar has presented a very unique and interesting setup for traders – an opportunity for a general commodity rally with Oil leading the way.

Taking a look at this Daily chart of the UUP (US Dollar Index Bullish Fund) with our Advanced Dynamic Learning Cycles price modeling system applied to it, we can see that the cycle analysis is predicting a rotational top in the US Dollar over the next 2~5+ trading days before a new bearish price trend pushes this US Dollar fund back to below the $24 level.  We have highlighted the Resistance Zone in red and we believe this rotating top will play out fairly quickly as an excellent opportunity for traders.

This general weakness setting up in the US Dollar should translate to strength in a number of commodities; Gold, Silver, Platinum, Oil and many others will likely see a 4~12% price increase if the US dollar contracts throughout this downward cycle rotation.


-SEE OUR EXCLUSIVE PLATINUM PRICE FORECAST – CLICK HERE-


Oil is particularly interesting to us because we believe the rotational top in the US Dollar will result in support solidifying in Oil near or above $66 and launch Oil into a new upside rally to well above $70.  It makes sense to us that weakness in the US Dollar with the corresponding upside pressure exerted on commodities will present an easy upside move in Oil for traders who see this move coming and are willing to take the trade.

Any Oil price move below $67 is well within our GREEN highlighted support zone and should be considered a BUY ZONE for this trade.  Remember, as this rotational top in the US Dollar plays out, there could be some volatility in both the US Dollar and Oil, so spread out your trades over a couple days to reduce risk.


The upside potential for this trade is, in our opinion, 4~7% or more.  Our modeling systems expect a 5.25% upside swing from this move currently and we believe the upside may be a little bit more than this expectation.  We believe this is a solid trade setup and weakness in the US Dollar will be key to this trade playing out as we expect.  Remember, all of this is expected to happen within the next 10 to 20 trading days, so you have time to position your trades and take advantage of this move.

You can receive our daily pre-market analysis with index, oil, and precious metals trade signals by joining our Wealth Building Newsletter.

Chris Vermeulen
email: chris@thetechnicaltraders.com
website: www.thetechnicaltraders.com