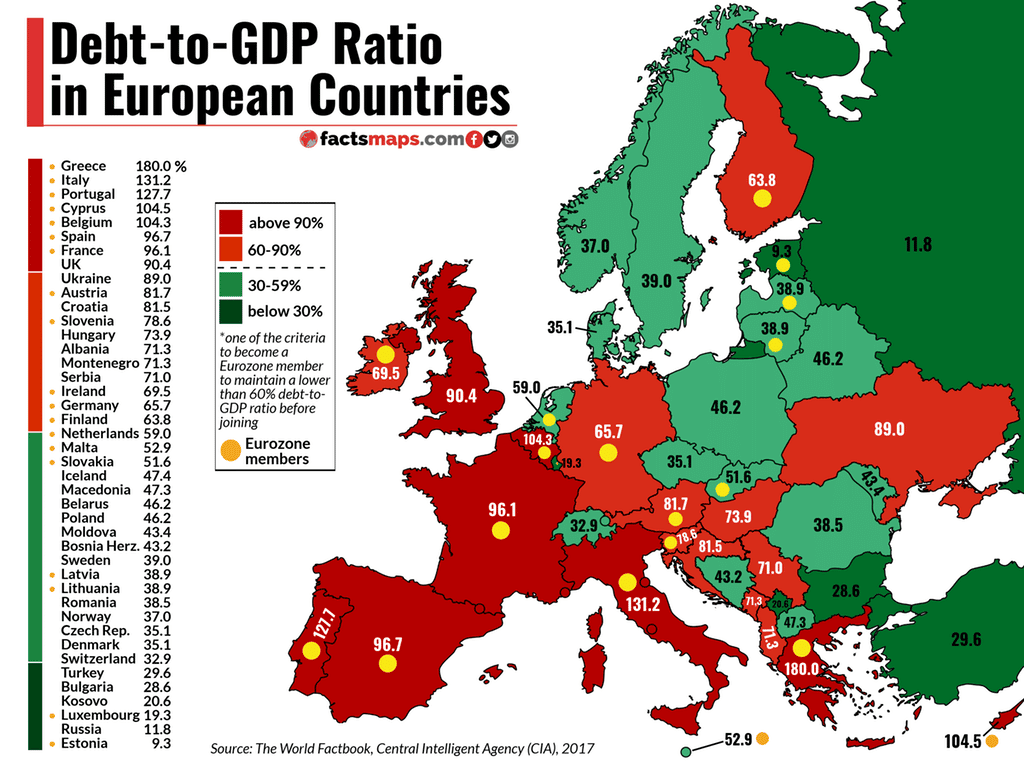
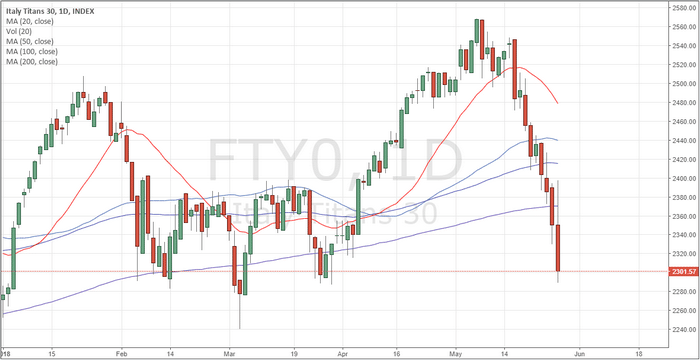
Recent news seems to have everyone concerned about Italy, global debts, Europe and the potential for a debt contagion exploding into the markets.  Yet, our research into price activity says this market is just getting started with an upside swing that could be massive.  Take a few minutes to review our current research to see why we believe the extended level of fear in the markets is related to the recent February price rotation and a generally accepted erroneous Elliot Wave Count.

We, the research team at Technical Traders Ltd., pride ourselves at sticking to our proprietary research and waiting for price to tell us if our analysis is correct or not.  Because of this, our research can sometimes directly opposite to the other analysts out there.  The tricky part of trying to predict the future is that we won’t know if we are correct until the market does what it does in the future.  Still, we believe that price is critical to understanding the markets dynamics at play as well as a core understanding of economic fundamentals as related to capital, debt, expectations and degrees of risk.  Keeping this in mind, let’s get to the charts to show you what we are seeing in the markets right now.

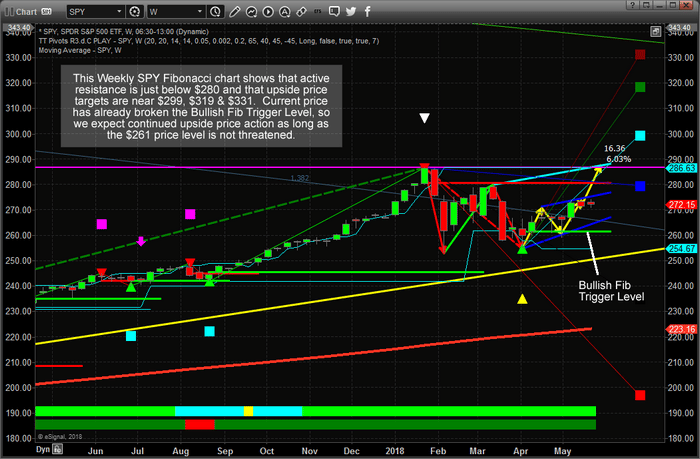
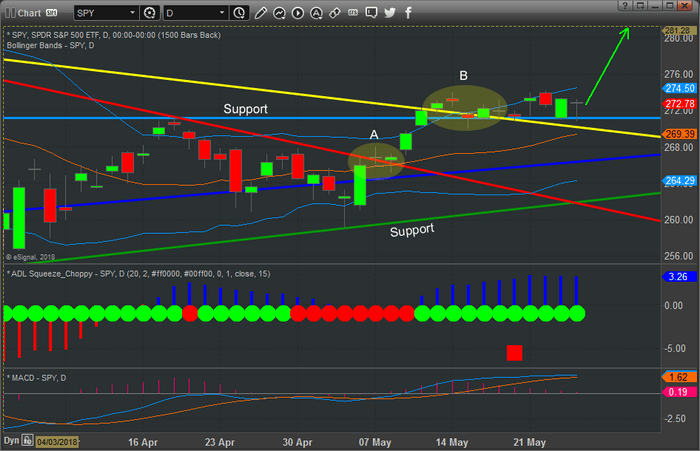
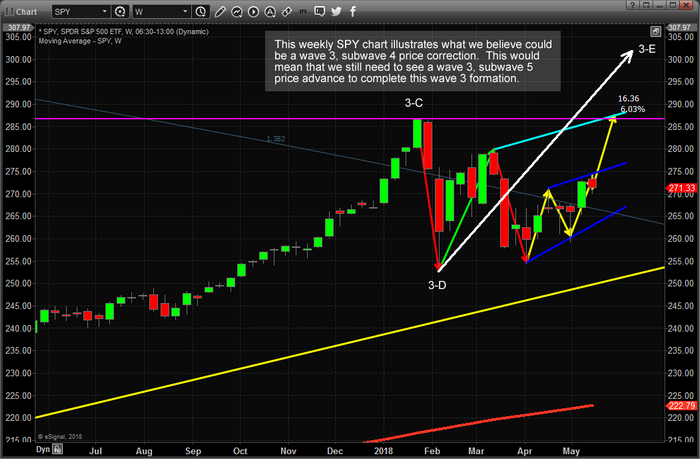
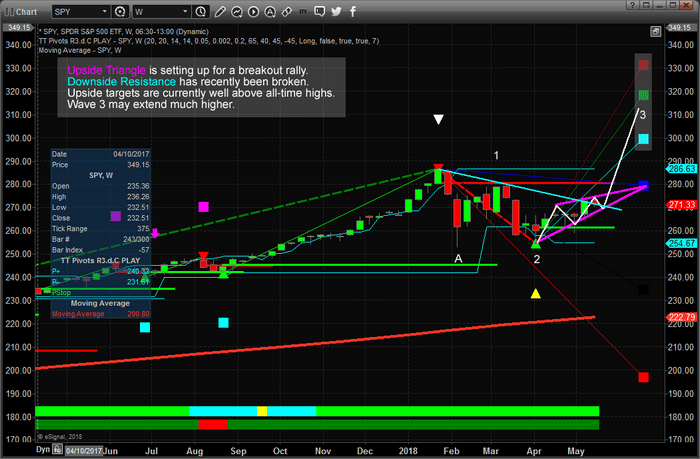
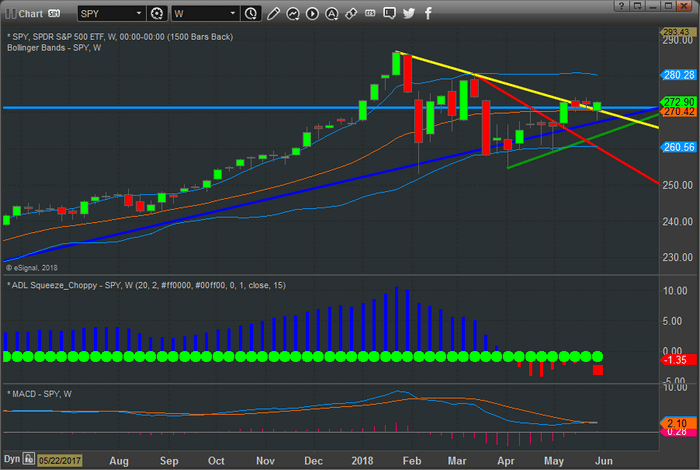
This Weekly SPY chart clearly shows the recent upside price breakout of the RED and YELLOW price downtrend ranges.  Additionally, even though Italy sent shock waves through the markets yesterday, the price recovery today pushed the closing price to well above the key support level near $270.  Pay close attention to the GREEN upward price sloping line near recent lows.  Unless this level if breached/broken, there is no reason for great concern of any downside price move.


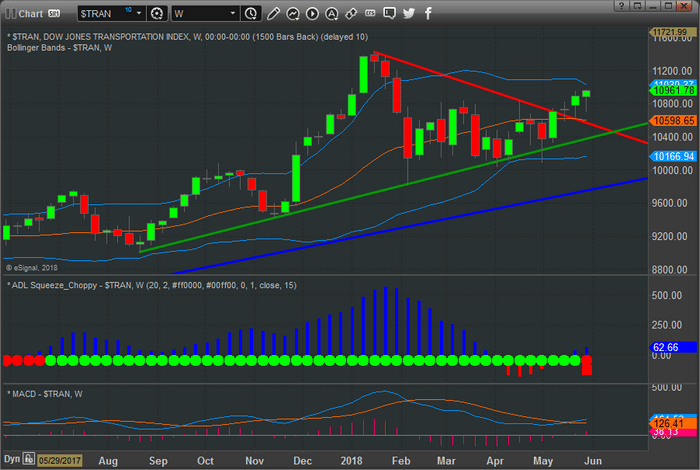
This next chart, the Weekly TRAN (Transportation Index), paints an even clearer picture of the recent price advance.  Weekly, the price lows since the February market lows, have been advancing to higher and higher levels.  The most recent unique low, near $10,100, is the current Fibonacci Key Price Low and as long as the current price does not rotate lower to test that level, we have nothing to worry about in terms of downside price activity.  Yes, price rotation could continue within this range ($10,000 to $11,000), but that unique low price is the key to the support that is holding the markets together and driving price higher.

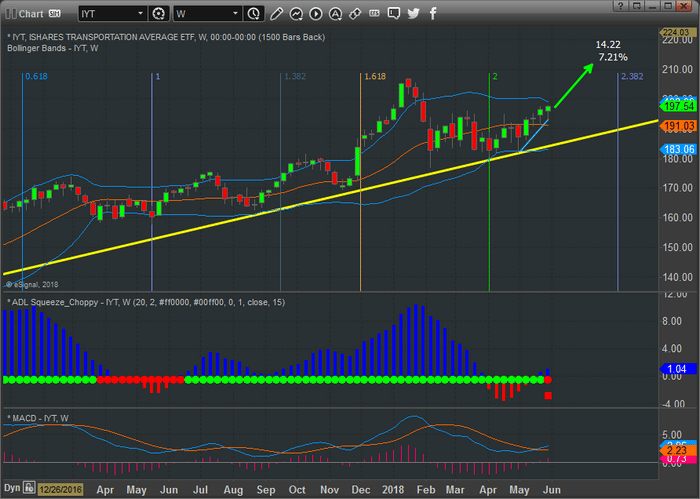
This last chart is a Weekly IYT ETF.  It is very similar to the Transportation Index chart, but still shows a very clear upward sloping price channel and a more recent upward sloping price advance near the right side of this chart.  Pay attention to the MACD levels on each of these charts.  In each instance the MACD has rotated into a bullish indication with the potential for an even greater price advance setting up.

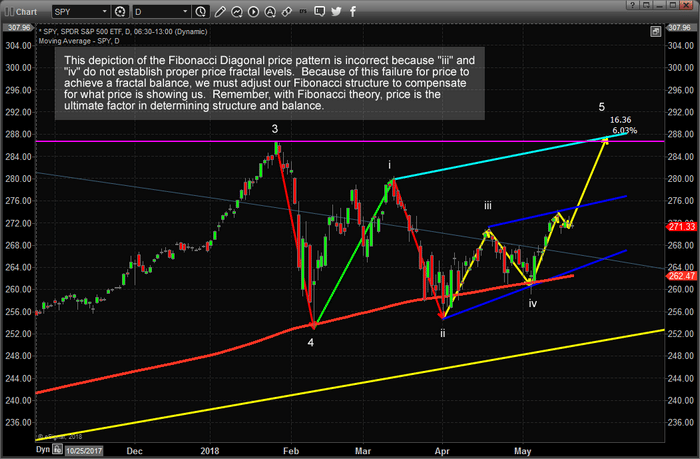
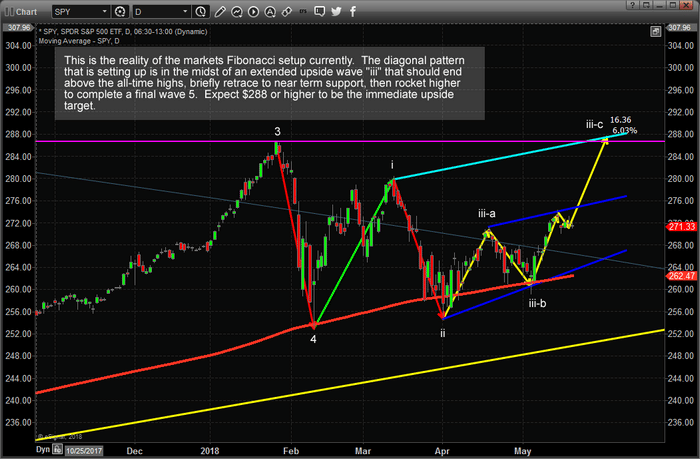
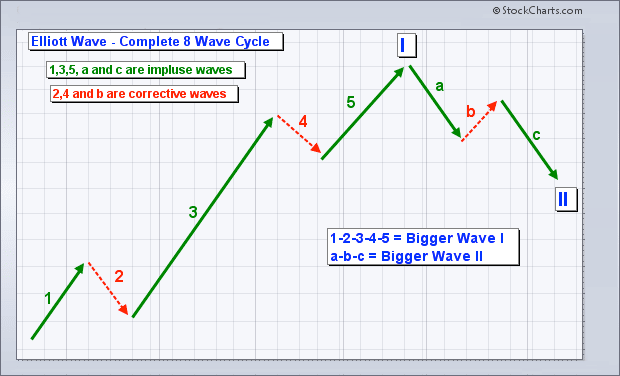
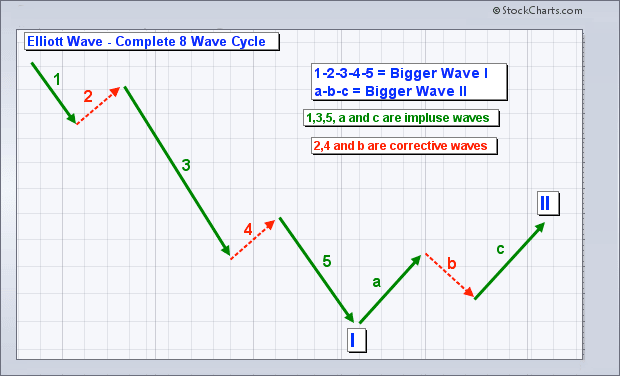
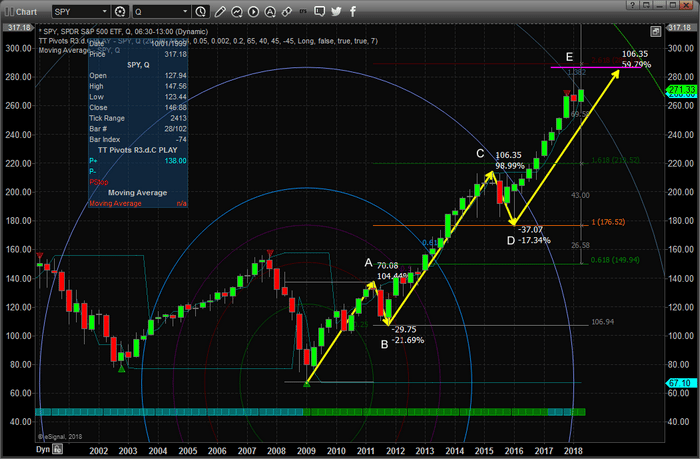
In our opinion, the concern in the market regarding global debt is warranted.  We will post a more detailed research report on this issue in the near future for all our followers.  Yet we believe the fundamentals of the US market is strong and we believe the “completed wave 5 Elliot Wave” analysis that is being proposed by many analysts is erroneous.  We issued our research on this issue a little over a week ago and we are waiting to see if price breaks to new all-time highs to confirm our analysis.

Please don’t get caught off-guard with regards to this price rotation and what it means to the markets.  A massive price expansion pattern is setting up in the US markets that may drive prices much higher all the way through 2019 and possibly further.  We believe many of the major analysts have missed this pattern and we have positioned our loyal members to take advantage of this move in the future.

Visit www.TheTechnicalTraders.com to learn how we can help you stay ahead of this market and stay on the right side of price trends.  You owe it to yourself to learn how we can deliver superior research and trading signals to help you find profits and better manage your trades.

BONUS FREE SILVER ROUNDS!
– Anyone who joins the 2-Year Wealth Building plan during May 30 and 31 will
get one of my new 1oz silver rounds mailed to them!

Limited Time Offer May 30 & 31 Only – Join Now!

After a fairly solid rally took place over the past few weeks in the US majors, fresh concerns originating from Italy roiled the markets early on Tuesday, May 29.  The concern is really related to the formation of a coalition government in Italy and the excessive debt issues plaguing Italy and many other European Union countries.  In our opinion, the European Union has a number of issues that are rearing their ugly heads and most of these are related to disparities between opportunities, capital flows, debt and consumer optimism related to the parity of the EU economic activities.  In other words, the squeaky wheel gets the grease.  Right now, Greece and Italy are the two squeaky wheels with Portugal, Cyprus and Belgium following right behind.

Italy makes up approximately 2.85% of the total global economy and Italy’s debt to GDP ratio in the European Union is second only to Greece.  When one considers the isolation factors that Italy is one country with less than 3% of total global economic output – these issues can be perceived as relatively small.  Yet the issue is much bigger than just one or two countries at the moment.  The lack of economic opportunity is one of the major driving forces these individual countries are dealing with.

Additionally, debt levels and debt repayment concerns are starting to weigh heavily on many of these countries.  The opportunities that the European Union was supposed to allow have turned into the heavy burden of slogging through an extended economic malaise with growing debt obligations and inflation issues.

The current concern revolves around the inability for Italy to form a coalition government.  This translates into concerns that another election event may push Italy further away from the European Union and Italians continue to get frustrated with their debt levels, political leadership and future opportunities.  Another election in Italy may not seem concerning to most, but what hangs in the ballot is the potential that Italy could bail on the European Union, default on debt and throw the EU into a death spiral… sounds fun – huh?

Our opinions regarding this matter are early stage guesses at this point, but we’ll share them with you all the same.  The turmoil that is being created by Italy will likely subside over the next few days and more core economic factors will begin to drive market price activity – especially in more established global markets.  This rotation, although unexpected, is actually a very healthy form of price movement.

If price recovers from this move quickly, then we consider this an “isolated economic event cycle” – much like tossing a rock into a pond.  Without that event, the ripples caused by the evet would typically not be an issue.  Therefore, once these ripples play out, the markets will go back to doing what they were doing to begin with.

Secondly, the European Union needs to address what we are terming the “disparity issues” that are present within the EU.  Without addressing this in a structured and organized format, more of these issues will continue to rise up over the next 8+ years.  The leading economic producers in the EU are capable of reducing these debt levels and structuring some form relief effort to assist in developing greater opportunities for all member nations.  Yet, it appears the EU leaders have not made the decision to address these issues in a positive form.

In terms of the US, UK and Italian markets, expect this rotation to be fairly short lived and, as we suggested earlier, more of an isolated event cycle in the longer term.

Italy will likely continue to see some pricing pressure as this political turmoil plays out. Pay attention to any news events as we could see more concerning news over the next 30+ days out of Italy and the EU.

The DAX reacted in a muted form to this new.  Vastly different than the US markets.  It appears that most of the established EU economies are not very concerned about Italy’s worries.

The US markets were off nearly 2% today – which seems excessive considering the US economic output is nearly 10x that of Italy.  We believe this is a massive price overreaction to a localized situation playing out in Europe.  Yes, there is some concern that it could spread into other nations, but right now this is more of a “what if something terrible happens” type of move.

Over the last week or so, we had a long conversation about what we call the “Global Financial Reset” event and spoke with someone in the EU that has direct knowledge that this type of event is being actively discussed between EU leaders.  How it will play out is anyone’s guess.  What it will likely do is to centralize some debt obligations and default on others – creating a more suitable “reorganization” of the EU for future growth.  Think of this like a reorganization bankruptcy in the US.  The idea is to default on certain debt in a manner that, through reorganization, the nations can emerge stronger, healthier and more opportunistic than before.

Right now, our advice it to be prepared for extended price rotation and the potential for a “capital flight” event (money moving out of fragile economies and into more stable economies).  Watch Gold and Silver as these metals will likely advance as fears materialize, but if the dollar continues its strong climb metals may continue to be muted for the time being.

Our belief is that the US market will be the safe-haven location for a massive capital migration over the next 6+ months.  This means the US markets should continue to melt-up as these global concerns play out.  Why?  Because capital is always searching for the best returns and safest locations to operate within.  Once the EU issues begin to resolve themselves, then capital will move back into these markets for the opportunities available there.

Remember, in the US markets, until the recent February lows are breached, we should continue to see this market with an upward bias. Its impossible to know when big market-moving news will hit, and it can certainly be tough to trade round and big volatility spikes can easily shake us out of good positions.

The key is to step back and look at the bigger picture like in this article. Greece and Italy really are just a few drops in the bucket in the grand scheme of things but we don’t want to start seeing a Domino effect where more countries start to collapse/default.

We have been waiting for these types of events to start bubbling to the surface and this could be the start of a major financial struggle for the world if countries can’t get their debt issues resolved. The good news is that whatever happens there will some incredible opportunities for us as traders and long-term investors with our Wealth Building Newsletter trading service.

Chris Vermeulen
Technical Traders Ltd.

Ever since the deep price rotation in late January/early February 2018, many analysts have attempted to pinpoint the next moves in the markets.  We recall reading the “doom and gloom” reports telling traders this is the big one and to prepare for a much lower price breakdown.  We also read a few research posts that aligned with our adaptive predictive modeling systems suggesting this move would expand into extended bottoming rotation.  We want to point out a few components of this move that most analysts are missing.

As we continue through this article, we want to highlight the similarities of this recent price rotation to the price rotation that took place in 2015/2016 and how prices advanced in staged “legging” patterns that allowed a great opportunity for traders and investors.

Take a look at this first chart below of the recent SPY price rotation on a Daily basis.  It shows the late January price peak and the deep price low that established this range of rotation.  This chart also shows our adaptive Fibonacci price modeling system and the analysis results of this strategy.  You should be able to see the RED and GREEN horizontal levels that are drawn on this chart widening against price levels.  This is indicative of non-trending price rotation as our adaptive Fibonacci modeling system sees this price rotation as “attempting to establish a new breakout trend”.


Now, please compare the SPY Daily chart (above) to the Weekly SPY chart from 2015~2016 (below) and pay attention to the price rotation between July 2015 and last 2016.  The initial price breakdown in August/September 2015 was rather deep and established a price low near $182.50.  After the initial price breakdown, price rallied back to near the previous highs before stalling again and falling to new lows before recovering.  This move is very similar to the current price rotation – two very deep price corrections with wide range peaks and troughs.  What happened next?

Take another look at the chart, below, and pay attention to the upward price move after January 2016.  Notice that the upward price move started to build some upside momentum – establishing new higher low points and, eventually, breaking out to new price highs near August/September 2016?  Take a real close look at this move and compare it to the first chart.  Although these two charts are not exactly the same, our Fibonacci price modeling system, in both instances, developed similar types of Fibonacci target levels and analysis.  The result of the current chart, above, is that we have yet to see a substantial upside price move that would prompt the Fibonacci price modeling system to bias the upside trend into its analysis – but we are close to this happening (very close).

Now, lets take a look at the current Weekly SPY chart that shows how narrow and short this current price rotation really is in comparison to the 2015/2016 rotation.  Currently, the entire price rotation that we are discussing has consisted for only four months – whereas the 2015/2016 price rotation consisted of almost 12 to 14 months total (before new price highs were established).  If the current price rotation continues at this pace, already having established two critical lows and beginning the upside price leg (in 4 months) that took the previous 2015/2016 rotation over 8 months to complete, we could expect a fairly dramatic upside price move in the US majors within the next 30+ days that could equate to the last 4 to 5 months upside activity within the 2015/2016 rotation.  In other words, this entire move is mirroring the 2015/2016 price rotation as a speed that is nearly 3x the earlier rotation.

Now, focus on one thing right now, the current Weekly SPY chart, below, is showing a Bullish Fibonacci price trigger level that has already been breached (near early April 2018).  This key component that is different from the earlier price rotation is a very clear indication that we could see a big move to the upside in the US equities market at a much faster rate than compared to what happened in 2015/2016.

The last chart we want to share with you is this Daily YM chart with our Fibonacci modeling system at work.  The recent price rotation near the right side of this chart has clearly illustrated the Fibonacci Price Trigger Levels and shown us that the upper Price Trigger level has already been broken while the lower Price Trigger levels have acted as a support boundary for price.  One thing to understand about this Fibonacci price modeling system and the Price Trigger Levels is that they are like key targets for price.  If price “crosses” the Fibonacci Price Trigger Levels, then this price level and trend direction becomes ACTIVE.  If not, they act as “boundaries” for price often becoming support or resistance level in the future.

Based on our research and analysis, the bias for the markets is, and has continued to be, bullish.  We are expecting a moderately large upside breakout to happen within the next 5~15 days that may drive prices to near or above all-time highs in the US majors.  We don’t expect you to understand or to be able to read our advanced Fibonacci modeling system like we can.  We’ve been working with this system for many years and this might be your first time viewing these types of charts.  What we want to push into your thinking is that our modeling systems are suggesting a broad market upside breakout is very likely over the next few weeks and months.  As long as key support levels are not breached and the current trend BIAS does not change, our analysis is to get ready for a potentially large upside price move.

If you’ve made it to the end of this article and understand the value of our work researching, coding and developing this content for you to better understand the future of the markets, then we thank you very much for your dedication and focus in reaching this point.  We also urge you to support our efforts in providing you this type of advanced and proprietary research and modeling tools by visiting www.TheTechnicalTraders.com to learn more about how we can help you find and execute success each week in the markets.  Our job is to be your research team, provide you with detailed analysis (both video based and text based) and to provide you with detailed trading signals that are primed for profits.  We take pride in our ability to deliver the best and most innovative market research you’ll find anywhere and our clients love the exclusive member only content and trades.  Please take a moment to see how we can help you achieve greater success.

Our 53 years experience in researching and trading makes analyzing the complex and ever-changing financial markets a natural process. We have a simple and highly effective way to provide our customers with the most convenient, accurate, and timely market forecasts available today. Our stock and ETF trading alerts are readily available through our exclusive membership service via email and SMS text. Our newsletter, Technical Trading Mastery book, and 3 Hour Trading Video Course are designed for both traders and investors. Also, some of our strategies have been fully automated for the ultimate trading experience.

BECOME A PROFITABLE TECHNICAL TRADER TODAY

WITH OUR WEALTH BUILDING NEWSLETTER!

This week presented some interesting price rotation after an early upside breakout Sunday night.  The Asian markets opened up Sunday night with the ES, NQ and YM nearly 1% higher this week.  This upside breakout resulted in a clear upside trend channel breakout that our researchers believe will continue to prompt higher price legs overall. Our researchers, at Technical Traders Ltd., have issued a number of research posts over the past few weeks showing our analysis and the upside potential in the markets that should take place over the next few weeks.

We expected a broad market rally this week, yet it has not materialized as we expected this week.  We consider this a stalled upside base for a new price leg higher.  Take a look at this Daily SPY chart to illustrate what we believe the markets are likely to do over the next few weeks.  There are two downside price channels that have recently been broken by price (RED & YELLOW lines).  Additionally, there is clear price support just below $272.00 that was recently breached.  These upside price channel breakouts present a very clear picture that price is attempting to push higher and breakout from these price channels.

Current price rotation has tested and retested the price support level near $272.00 and we believe this recent “stalled price base” will launch a new upside price rally driving price well above the $280.00 level.

With the holiday weekend setting up in the US and the early Summer trading levels setting up, it is not uncommon for broader market moves to execute after basing/staging has executed.  This current upside price action has clearly breached previous resistance channels, so we continue to believe our earlier research is correct and the US majors will mount a broad range price advance in the near future.

The VIX, on the other hand, appears poised to break lower – back to levels below $10 as the US major price advance executes.  The VIX, as a measure of volatility that is quantified by historical price trend and volatility, should continue to fall if our price predictions are correct.  If the US major markets continue to climb/rally, the VIX will likely fall to levels well below $10.00 and continue to establish a low volatility basing level – just as it did before the February 2018 price correction.

A holiday weekend, the start of lighter Summer trading and the recent upside breakout of these downward price channels leads us to believe the market will continue to push higher over time with the possibility of a massive upside “melt-up” playing out over the next 2~6+ weeks.  We believe this move will drive prices to new all-time price highs for the US majors and will surprise many traders that believe the recent price rotation is a major market top formation.

Our exclusive Wealth Building Newsletter provides detailed market research, daily market video analysis, detailed trading signals and much more to assist you in developing better skills and greater success in your trading.  One of our recent trade in natural gas (UGAZ) is already up over 26% and we believe it will run another 25-50% higher from here! We provide incredible opportunities for our member’s success.  We urge you to visit www.TheTechnicalTraders.com to learn how we can assist you in finding new success.

Our 53 years experience in researching and trading makes analyzing the complex and ever-changing financial markets a natural process. We have a simple and highly effective way to provide our customers with the most convenient, accurate, and timely market forecasts available today. Our stock and ETF trading alerts are readily available through our exclusive membership service via email and SMS text. Our newsletter, Technical Trading Mastery book, and 3 Hour Trading Video Course are designed for both traders and investors. Also, some of our strategies have been fully automated for the ultimate trading experience.

Become a Profitable Technical Trader Today

With Our Wealth Building Newsletter!

At this point, all we can say is “Wow – did you see that breakout?”.  If you have been following our analysis, you already know we’ve been predicting this upside price move for over 4 weeks with our specialized price modeling systems, cycle analysis models and other specialized trading tools.  Last weekend, we posted very detailed analysis of the Elliot Wave and Fibonacci price levels that suggest we could see another upside price move that no one is expecting.

Please take a minute to read our two recent Elliot Wave research posts before you continue reading this post.  We want to make sure you understand the components of this price setup and what we believe will be the most likely outcome.

The upside breakout in price on Monday actually originated with an upside gap Sunday night.  This upside gap was likely the result of a combination of factors, yet it supported our analysis that the US major markets are poised for a dramatic upside price move soon.  Our Elliot Wave analysis suggested we could be setting up for a Wave 3-d upside price move that will end with a corrective price move sometime in early/mid 2019.  In order to confirm this analysis, we have to see new all-time price highs established before the end of 2018 with a solid upside price rally in place.

While the YM (DOW) was the only US major to show a clear upside price breakout, we believe the other US major markets will follow along soon enough.  We have highlighted what we believe is a critical support zone on this YM chart to try to illustrate that price rotation is normal.  We expect to see a 1~2% price rotation throughout this upside move that is completely natural and healthy for the markets.


Again, this is completely natural as the YM (Dow Jones index) is tied to the DOW Industrials and the Transportation Index which are breaking out this week. A breakout move like this in the YM suggests that the overall US economy is strengthening and that the future expectations are good that increased levels of transportation of goods will unfold. In our next post we will go into detail on these two sectors and show you some new opportunities emerging.

Additionally, we wanted to show you this NQ chart that is waiting for breakout confirmation from price.  Sometimes, the US majors do not always move in unison.  There are times when the S&P or the Nasdaq will move with greater velocity while the other US majors appear to move in a more muted manner.

The NQ, being tech-heavy, relies more on earnings and revenues from the FANG group.  A move higher in the NQ would indicate that future earning and revenue expectations are strengthening.  This is something we believe will happen in the near future as we expect the NQ to follow the YM with an upside price breakout very soon.

We are still very early in this trading week and we have lots of time for this move to unfold.  We can help you find and execute better trades with our advanced market timing and trade setups for active traders.  Our members already know what our predictive modeling systems are suggesting for the next 5+ weeks.

Our 53 years experience in researching and trading makes analyzing the complex and ever-changing financial markets a natural process. We have a simple and highly effective way to provide our customers with the most convenient, accurate, and timely market forecasts available today. Our stock and ETF trading alerts are readily available through our exclusive membership service via email and SMS text. Our newsletter, Technical Trading Mastery book, and 3 Hour Trading Video Course are designed for both traders and investors. Also, some of our strategies have been fully automated for the ultimate trading experience.

Become A Profitable Technical Trader Today!

Click Here

There is nothing more exciting to us than reading the price action of the charts to see what will happen in the future.  It becomes even more exciting when we find something that everyone else seems to have missed.  Right now, traders need to pay attention to our research because we believe we have correctly identified a breakout pattern that is setting up in the US majors – and everyone seems to have missed it.

Recently, our research team began a quest to properly identify the Elliot Wave structure of the US majors in relation to the recent price congestion after the February 2018 price collapse.  You can read our earlier research post to better understand our conclusions.

Our research shows that price could be setting up in a very unique extended Wave C pattern that would indicate the recent price correction in the markets could be a Wave D price rotation setting up a “Diagonal Price Breakout” pattern.

How is this analysis important to all traders and investors?  It is critical to understand that if the majority of market analysts believe this is a Wave 5 Top Setup, believing this is an ultimate top, when the reality is this is an extended Wave 3 (2.618 x Wave 1) and possibly the Wave 3-d formation, the long-term analysis is dramatically different. Instead of an “ultimate top” setup, this analysis now becomes a “price correction in a longer-term upside trend with much greater upside potential to go”.

Let’s get into the details of this analysis to better illustrate our thinking.

Without going into the details of how Elliot Wave theory works or the fractal price rotation balance that is essentially correlated to Fibonacci price theory, we want our readers to focus on this “Ending Diagonal” that is common near the end of wave 3 or “always in wave 5 of a motive wave sequence”.  The source for this information and image below is from World Cycles Institute.


BULL MARKET MOTIVE ENDING DIAGONAL PATTERN

The Bull Market Motive Ending Diagonal pattern is the one that caught our attention as we attempted to better understand the current market price structure in the SPY chart.  Pay very close attention to this pattern because we strongly believe most of the major analysts have completely missed the structure of price in relation to the upside potential within the US markets.  As you are likely aware, our advanced predictive modeling systems have been warning of a price bottom and much higher price predictions over the past 30+ days.  This prediction does not settle well with many traditional analysts because they seem fixated on the Wave 5 ultimate top analysis.  We believe they are wrong and we will show you why – keep reading.

This type of Ending Diagonal is very common near the end point of a larger Wave 3 formation – often setting up a Wave 5.  This type of Ending Diagonal is rarely seen as a wave C. (source : http://elliottwavepredictions.com/wave-notes/).

Remember, we believe most of the best analysts on the planet have missed this setup and believe the early February price top is the “ultimate wave 5 peak” setting up a much broader downside price move.  Here is why we believe these analysis are wrong.


INCORRECT SPY DAILY CHART ANALYSIS EVERYONE IS USING

This SPY Daily chart shows what most analysts would identify as a proper Elliot Wave count if they understood the Ending Diagonal pattern that was setting up.  This is incorrect because the lower price rotation (iii and iv) are structurally invalid based on Fibonacci time/price structure.  We believe this is one reason why so many analysts have misinterpreted this current price pattern.


CORRECT SPY DAILY CHART ANALYSIS

The correct analysis of this pattern is shown below.  The difference, in our opinion, is that wave “iii” is still in the process of forming and will ultimately breakout to new highs before forming a short retracement and rocketing much higher to complete the ultimate wave 5.

Please take notice of the CYAN price line drawn by our researchers.  Structurally, this price level must be reached in order to complete a wave “iii”.  We believe once this “new price high” level is reached and the market price retraces, the retracement level will likely be about 3% and stall near the upper BLUE wedge resistance line (near $278).  The current price consolidation, over the past 4+ days, is nothing more than temporary resistance before the upside breakout to complete the “iii-c” price peak.

Ultimately, as we suggested in our earlier research post Elliott Wave Prediction for US Stocks, the final Elliot wave analysis of this rotation may take many more months to conclude with any degree of accuracy.

The point of this article is that this Ending Diagonal pattern is common near the end of wave 3 and near the beginning of wave 5 – yes, we understand this point.  Yet, our question remains “is this the end of a 5-leg sub wave 3” or “the end of a major 5 leg (ultimate peak)” formation?  Our belief is that the answer is this is the end of an “extended wave C” that will likely result in much higher price activity over the next few months/years.

3

There is one key to understanding our analysis and our future expectations – recent price lows in the SPY must not be breached for our analysis to remain valid.  These recent low-price levels are $254.67 & $252.92.  If our analysis is incorrect, these low-price levels will be the first levels to be breached on a market price reversal.  If our analysis is correct, price will never come near these levels and will continue to accelerate higher as a new wave 5 is created.  If we are correct, there will be a lot of short sellers that get caught in this failed analysis and this move could be explosive and trigger that signature blow off/capitulation topping spike in price that ends most bull markets.

If you like our work, want our trade alerts, and want to support our efforts, please visit www.TheTechnicalTraders.com to learn how we can help you stay ahead of the markets.  We live for this type of work, research and helping our members find profits in the markets.  We believe our research is top-tier and we know we provide value to our loyal members.

Recently, an interesting concept was discussed among our research team – a very interesting concept about the markets.  As many of you know, part of the process or research is to test conclusions that may lie outside common thinking.  While we were discussing the Fibonacci and Elliot Wave structures of the US market using longer-term charts, one item kept intriguing our research team.  This one item could change everything in terms of how we are thinking about the US markets and Global markets.

Almost everyone knows that Elliot Wave (EW) theory consists of Five Waves to complete a major EW Cycle.  The most common form of EW price cycles is A, C & E (or 1, 3 & 5) waves advancing and B & D (or 2 & 4) waves declining for an uptrend.

Chart courtesy of stockcharts.com

The opposite is true for a downtrend.  It is relatively common knowledge these types of price formations make up almost all of the markets price moves.

Chart courtesy of stockcharts.com

Yes, there are variations that can sometimes come into play, like Triangle formations, Zig-Zag formations, Regular, Expanded, Contracting and other rarities.  Yet, many people don’t understand the mathematics requirements that apply to EW and Fibonacci as a method of constructing proper EW structures.

The question proposed by one of our research team was “what if this recent move higher (from 2011 to current) is nothing more than an extended wave 3 and not a wave 3-4-5 formation.  What if this 166.94% rally in the SPY is nothing more than an extended Wave 3?  This question began a quest within our team of research to try to identify if this concept had any validity – and the results are surprising.


Basic Concepts of Major and Minor Wave Formations

Before we continue, allow us to explain some of the basic concepts of major and minor wave formations as defined by Ralph Nelson Elliot and Robert Prechter.

  • The basic 8 wave form is fractal in nature. It is operating at all degrees (chart timeframes) simultaneously.
  • In most impulses, there is a 5-wave pattern which unfolds adhering to the following rules:
    • Subwave 2 does not overlap the start of wave 1
    • Subwave 4 does not overlap the extreme of wave 1. Also, as a strong guideline, it is not advisable to assign a wave 4 label if there is any overlap of the territory of wave 1 during the 4th
    • Subwave 3 is not the shortest of 1, 3, & 5.
  • Impulses are typically bound by parallel lines
  • In impulses, one of the waves 1, 3 or 5 will likely extend substantially in comparison to the other two. In the stock market, wave 3 is most likely to extend, whereas, in commodities, wave 5 is the more likely to extend.
  • Rarely, a wedge-shaped diagonal appears as wave 1, A, 5 or C. It is sometimes referred to as a diagonal triangle.  In a diagonal, both trendlines slope/tilt in the same direction (both up or both down).  Most often, the trendlines converge (get closer together) as they extend.  Sometimes they diverge (get further apart with time). Concepts courtesy of Elliott Wave Predictions


One aspect of the EW rules that intrigued us the most is that “Subwave 3 is not the shortest of 1, 3 & 5”.  This facet of EW in combination with the concept that retracement waves typically contract to 38.2% of the previous impulse wave provided our research team with an impetus to consider alternative wave counts.

What if, this chart below, showing a completed EW 5 wave cycle where wave 3 & 5 are nearly identical in length is structurally incorrect.


What if the real EW count is as we are showing in the next chart below – where the current upside wave (originating near the end of 2011) is nothing but an extended wave C setting up a push higher.  Remember, wave 3 (in this case wave Ciii) can’t be the same length as wave Ci.  In the chart, below, the yellow arrows drawn for Ci and Ciii are identical in length.  It could be concluded that, if our hypothesis is correct, wave Ciii is not completed yet and will extend further to the upside (if it develops into a complete 5 wave structure) or wave Ciii may be near an end because it is already 2.618 x wave A and has completed a structurally relevant ABC formation.  Traditionally, wave 3 is the longest wave of the ABCDE wave formation.

The one aspect of wave C in our research that confounds us is that neither of the corrective waves (wave Cii or the current pullback near wave Ciii) come close to the 0.382% pullback expected by corrective waves.  This one component of our research is leading us to believe the upside in the US majors may be dramatically underestimated by most market analysts.  If our research is correct, then this current market pullback, or corrective wave, may be a “combination sideways minor correction of wave C”.


Our predictive analysis is clearly indicating US majors should continue to push higher over the next few months.  This analysis is counter to a completed EW 5 wave cycle.  In other words, the US market should not attempt to target new highs if this recent high is the completion of a total EW 5 wave cycle.  Therefore, it is our opinion that we are looking at an extended (2.618x) EW wave 3 move that will result in a correction at some point in the future (forming wave 4).

We will follow up this research article with another, more detailed, one soon.  We believe we have accurately understood the EW pattern formations that are currently setting up in the market and we believe there is a strong potential for an upside breakout to attempt near all-time highs in the market before any start to a corrective wave.  We believe far too many people have failed to understand the structure of this major EW pattern and have concluded this is an EW wave 5 completion.  There are going to be a lot of short sellers getting caught in any upside move as the Upside Triangle breaks and prices push higher.

One condition for all of our analysis is that the low at corrective wave 2 (@ $254.67) must hold as price support.  Failure for the price to hold above this level means we have a failure in our proposed analysis and we would fall back to a potential that this corrective move could fall further to complete a 0.382% (or greater) wave pattern.  It all depends on price and our predictive modeling systems are showing us that price should advance over the next few weeks, thus we believe our analysis is correct.

As we close out this research post, think about what this means to us as traders.  A large portion of the globe may be setting up for a massive market top formations – setting up short positions and leveraging their positions for what they believe could be a massive downside move.  Yet, if our analysis is correct, this downside move may be over and we could be setting up for a broad upside move in the US markets to create a further extended wave C or a new wave E.  If we are correct, the pressure put on these short sellers is going to be tremendous and the markets could skyrocket higher.

We’ve been discussing “capital migration” recently to highlight how fragile certain foreign and Emerging Markets are and how capital will quickly move into more stable economies/markets that can generate solid returns.  It may be that we are setting up for a massive wave of capital migration into the US equities markets and the US Dollar that everyone is failing to understand or foresee.  Time will tell if we are correct.

If you want to know how we are helping our members and the specialized proprietary research we offer to keep them ahead of this market, please visit www.TheTechnicalTraders.com. Last weeks trade resulted in a +18% profit for our members.  Once you realize that we have been calling these market move perfectly over the past few months, you’ll understand that our membership costs are very nominal compared to the benefit and information we provide to you each day.

Our articles, Technical Trading Mastery book, and 3 Hour Trading Video Course are designed for both traders and investors to explore the tools and techniques that discretionary and algorithmic traders need to profit in today’s competitive markets. Created with the serious trader and investor in mind – whether beginner or professional – our approach will put you on the path to win. Understanding market structure, trend identification, cycle analysis, volatility, volume, when and when to trade, position management, and how to put it all together so that you have a winning edge.

Chris Vermeulen

Our research team has been following the energy sector quite intensely with Oil and Natural Gas making an impressive move.  A little known seasonal pattern in Natural Gas has setup recently and we have alerted our members to this play which is already up over 16%.  Our advanced price modeling systems and Adaptive Dynamic Learning Cycles have recently triggered another buy entry point which we share in this article but first look at the seasonal chart showing the month which Natural Gas is generally strong.

This seasonality table refers to particular time frames when commodities are subjected to and influenced by recurring tendencies that produce patterns each year.


It is our belief that Natural Gas will continue to climb higher moving well above the $3.00 level before the end of this month as well as potentially pushing well above the $3.20 level on continued price advances in energy.

Quite a bit of concern globally is driving energy supply fear that is pushing energy prices higher.  This unique seasonal pattern indicates the potential for some strong upside price moves.  We believe smart traders were already positioned for this move weeks ago, yet there is still quite a bit of opportunity from the recent entry point. See the left side of chart; below with oversold pullbacks.


A price move from current levels to above $3.00 would reflect an additional 4~6% price gain and a advance above $3.20 would reflect a 11% price advance.  Again, our predictive price modeling systems and cycle modeling systems are showing us this has the potential for quite a bit more, but we can only estimate the $3.00 to $3.20 level is a sufficient upside target for this initial move.

If you would like help finding trade triggers like this and help knowing what to expect each day in the markets visit us at www.TheTechnicalTraders.com. We’ll help you to understand the market dynamics as the markets move, we’ll provide you with a comprehensive daily market video to show you what to expect and we’ll continue to provide you with this simple yet highly effective market research and analysis to help you stay ahead of the market moves.  Our current trade in UGAZ is up 16% and likely going much higher.  It just takes one or two of these types of trades to pay for your membership for years.

Our 53 years experience in researching and trading makes analyzing the complex and ever-changing financial markets a natural process. We have a simple and highly effective way to provide our customers with the most convenient, accurate, and timely market forecasts available today. Our stock and ETF trading alerts are readily available through our exclusive membership service via email and SMS text. Our newsletter, Technical Trading Mastery book, and 3 Hour Trading Video Course are designed for both traders and investors. Also, some of our strategies have been fully automated for the ultimate trading experience.


The 30-minute chart price pattern with a large gap down in price on Tuesday morning created what we call a “Gap Window”. Almost all gaps in the SP500 get filled eventually, and both the top and bottom areas of a gap window become short-term resistance or support.

A three-wave a-b-c correction is generally what causes stop orders to be run, panic selling, and creates a pivot low. This is displayed with a red line on the chart.

If this very short-term pattern unfolds it would create fantastic entry point because several different types of analysis come into play at the same time and price. The green 20-day simple moving average and our short-term cycle projection would act as support and a cycle low.

Our articles, Technical Trading Mastery book, and 3 Hour Trading Video Course are designed for both traders and investors to explore the tools and techniques that discretionary and algorithmic traders need to profit in today’s competitive markets. Created with the serious trader and investor in mind – whether beginner or professional – our approach will put you on the path to win. Understanding market structure, trend identification, cycle analysis, volatility, volume, when and when to trade, position management, and how to put it all together so that you have a winning edge.