
Archive for month: March, 2018
Early signs that the US Fed may be pushing the envelope of rising rates and creating pressure on banks and borrowers are starting to show up more prominently now. One component of our research at Technical Traders Ltd. is to find data that may be overlooked or ignored by some other researchers. We believe that any pressures or hardships related to general consumers will be seen first in discretionary debt (credit cards, autos, and entertainment/activities). When consumers feel the debt pressure starting to build, they react by cutting back on certain discretionary spending – focusing their purchasing/paying abilities on essential items like food, human necessities (toiletries and other essentials) and maintaining essential components of their lives.
One of the first things to watch is the delinquency rates for credit cards and autos. Additionally, watching for early signs of weakness in the larger metro real estate can assist us in understanding the health and dynamics of regional economies. Months ago, the levels of Foreclosures and Pre-Foreclosures were dramatically lower in major metro locations. Pre-Foreclosures are early stage Foreclosures where borrowers are behind in their mortgage payments and the banks have issued an “intent to foreclose” notice unless the borrower repays delinquent amounts.
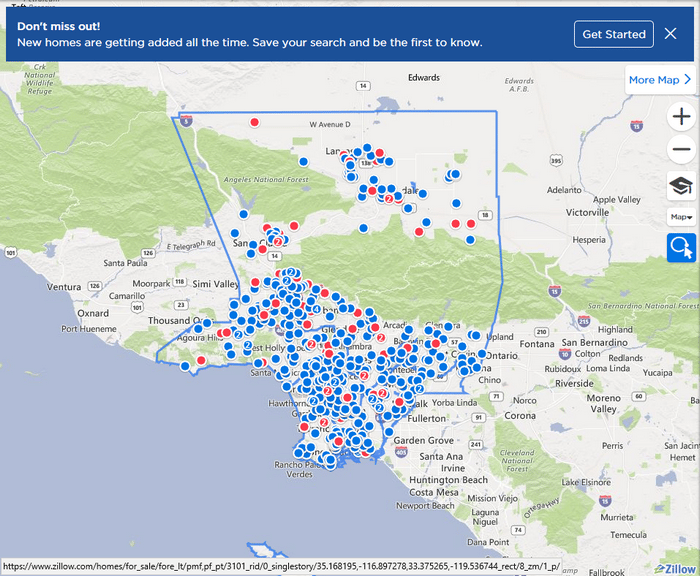
The Los Angeles metro is one of the largest and more diverse economies in the world. California is rated the 6th largest economy in the world if it considered a unique country. The ability to earn and spend efficiently within this metro is essential as it is ranked the 8th most expensive city in the world (Source March 2016 SCPR.org). There is a fine line between the balance of being able to afford to live in an area while creating opportunity and success and being priced out of an are because of constricting economic fundamentals. We believe this balance is beginning to skew towards a massive unraveling process.
The BLUE dots on this image below are Pre-Foreclosures. The RED dots are Foreclosures. Our research concludes that this early stage development of increased foreclosure activities and strains on the economic fundamentals related to this large metro are showing that pressure is building for an eventual market top similar to what we saw in 2008. We may still be many months or a year away from an eventual peak in the stock market, but the signs are starting to become more evident that pricing pressures are driving many borrowers into the foreclosure process while the regional real estate markets are about to be flooded with distressed property.
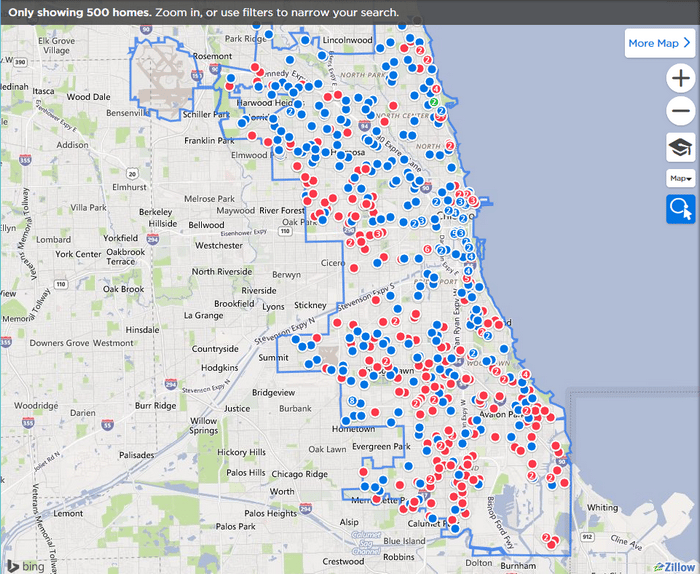
The Chicago metro area is showing similarities to the Los Angeles area. One clear visual difference is the larger number or RED dots showing active foreclosures.
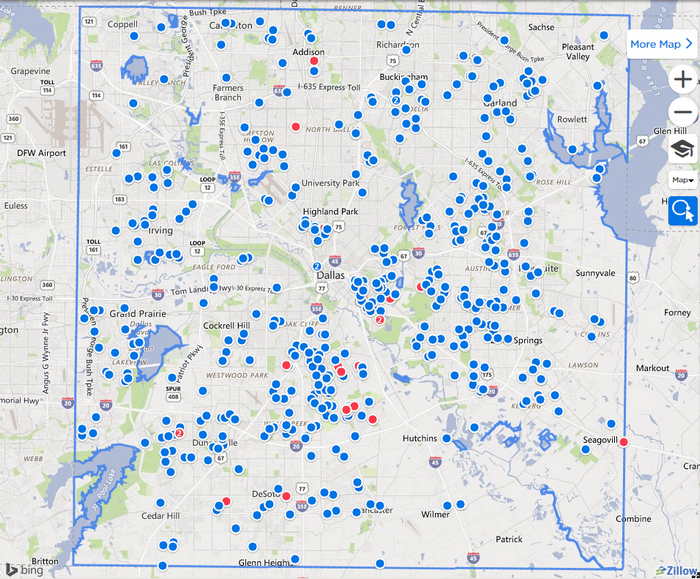
The Dallas, Texas metro is also showing signs of distress. As thousands of people have relocated to Texas over the past 14+ years and specifically since the post-2010 economic recovery, Texas has been a hot destination for business relocation because of favorable taxation policies and cheaper real estate. Given this continual demand for property by people moving to Texas following their employers, it appears that the fundamentals of the real estate market are changing and putting more pressure on borrowers.
The US lending giant, Freddie Mac, reported a $3.3B loss for Q4 2017 – Source. It is our opinion that multiple factors are driving increased pressure for lenders and borrowers. Currently, Adjustable Rate Mortgages equate to about 6~8% of all borrowing within the US. We also believe the extended pressures related to the Affordable Care Act (Obamacare) and the US Fed raising borrowing rates are driving a fundamental shift in US economics. Specifically, the combination of these factors, as well as relatively narrow wage growth, are pushing many borrowers over a financial cliff.
We believe the resulting wave of economic pressure will result in a dramatic opportunity for traders to capture spectacular gains from the resulting moves in specific stocks. We believe the US and global markets could be setting up for a massive rotational move down as these economic pressures continue to froth. As traders, we urge all investors to pay specific attention to the often-unknown economic factors at play in the markets.
One of the most important aspects of our service to is to share our analysis so that you have some real predictive analysis data for research and review. We are not always 100% accurate in our modeling systems predictions or accuracy, but you can spend a little time reading our research reports through most of this year to see how we’ve been calling these market moves since well before the start of 2018. Visit www.TheTechnicalTraders.com to see what we offer our subscribers and learn how we can assist you in finding great trading opportunities. In fact, pay attention to the market moves as they play out over the next few weeks to see how accurate our research really is. We’re confident you will quickly understand that we provide the best predictive analysis you can find and are proud to offer our clients this type of research.
In closing, don’t fall for the fear and panic articles. Stay aware of the evolving market conditions by relying on expert research and analysis like ours. Yes, the market is extended. Yes, the market may correct sometime in the future. Yes, the Fed has likely created a massive bubble. But it’s not over yet and the real trade is market segment rotation that is setting up. Hope to see you in our member’s area where we can share more data and research to help you profit from these moves – visit www.TheTechnicalTraders.com to learn more.
Volatility setting up like 2014/2015, Get ready for some interesting range rotation and price swings.
Our recent research shows that the current US markets are setting up for what could become a very interesting price range rotation as well as increased volatility. Our team of researchers at Technical Traders Ltd. have identified a number of key elements that appear to be in place similar to 2014/2015 where the market setup an initial deep price rotation, followed by a deeper price rotation only to end with an advanced price rally on the news that the US Fed would continue buying US debt.
Let us take a look at the 2014 price activity first. You may not be able to see the similarities like our team of researchers, and I will confess, these charts have a lot of analysis on them making it a little noisy and hard to sort through, but if you focus on the September 2014 date range, you may notice a similarity to right now in the use markets (primarily the NQ). The focus of this article is to alert you that the market dynamics are evolving quickly and you need to stay aware of the changes as they happen. There is a huge amount of capital at play in the US markets and if our analysis is correct, our advanced price modeling tools will assist you in understanding what to expect in the near future.
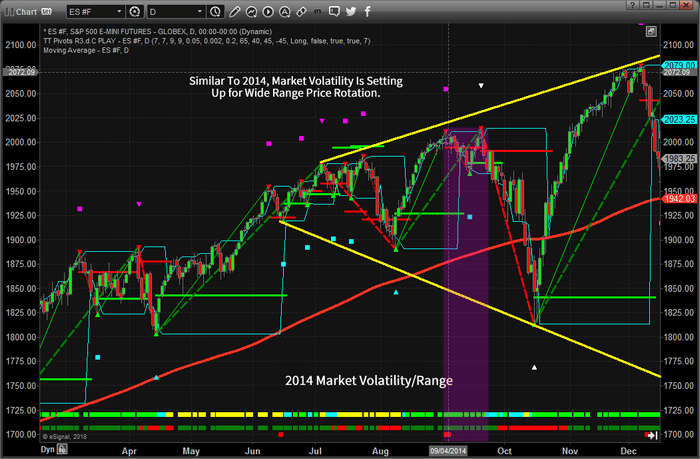
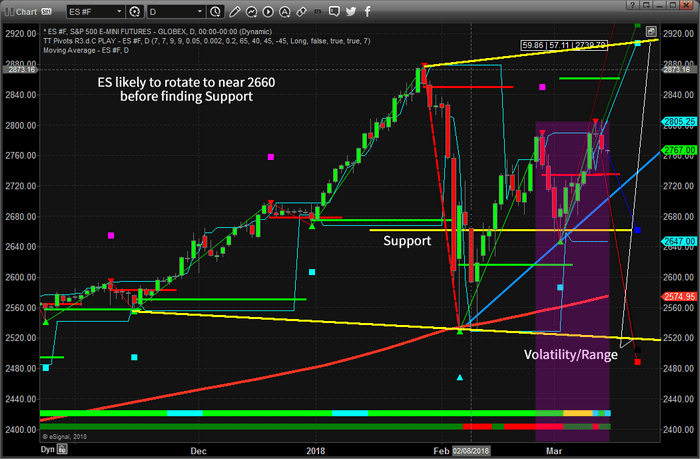
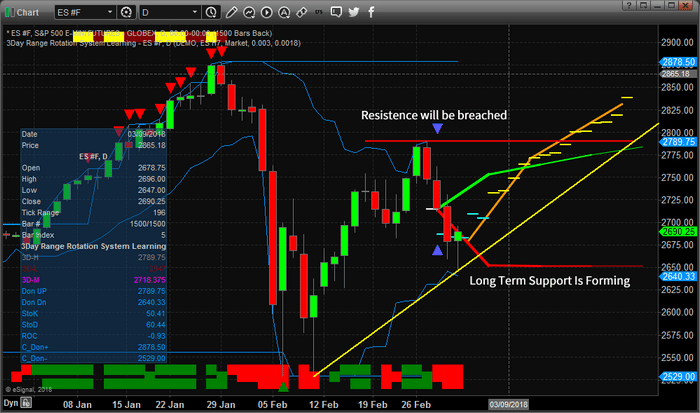
This next chart shows us the ES (S&P) chart as of today. It is clearly a different setup from the 2014 price setup – but still similar enough for our modeling systems to catch this event. The volatility range of price is increasing in a sideways channel. This could be a good thing for traders like us. The volatility could present some real issues for trend followers like Hedge Funds and other modeling systems as they are not likely to see this price pattern setting up.
We believe the ES will rotate lower over the next few days to attempt to retest support near 2660 before attempting another short rally likely ending near, or just above 2800. This would represent a failed price rotation with a new double top or higher high price level very similar to the second top near the end of September 2014. We believe this second top could produce another deeper dive in prices sometime in early April 2018. Still, the 2660 level is support and we would have to be cautious near those levels.
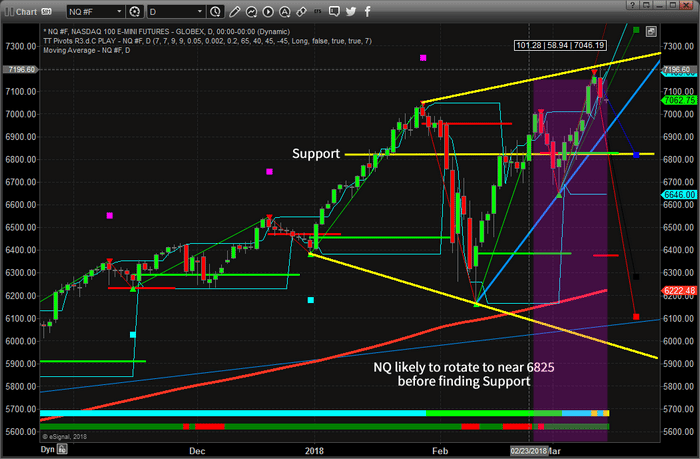
This next chart is the NQ (NASDAQ) and is showing a pattern that is much more similar to the 2014 ES chart. Support at 6820 is our critical price level and we are expecting a downside market price move immediately to retest this level as well as the upward price channel (in light blue). You can see the range expansion levels drawn in YELLOW and if you study this price rotation to the 2014 price chart, you’ll see some strange similarities.
What is happening is that price is lacking direction and is attempting to hammer out peaks and valleys in an attempt to find support and resistance. The chance of a deeper price move as well as increased volatility is quite high the further this pattern continue to form. Any price move lower will likely cause the VIX to increase back above 20 and any price swing below 6600 on the NQ will likely cause the VIX to spike well above 25 again. As you can see, the downside price volatility range is near 5900.
In fact, we called this rally nearly to the day over a month ago completing the bullish outlook portion. Now, the question is if our current analysis and our 6-week old prediction are correct with a big selloff.
See this near perfect stock market prediction we posted the day the market bottomed!
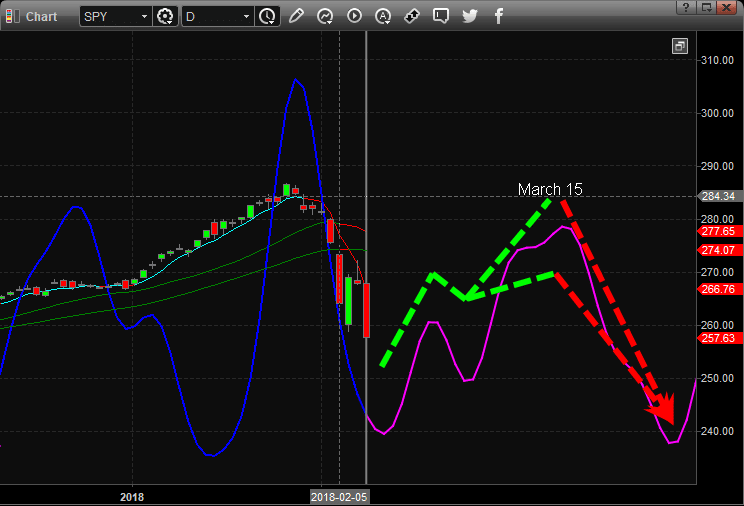
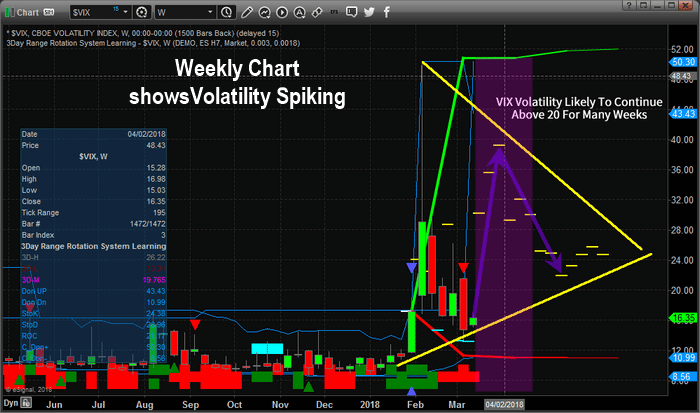
Our Adaptive Dynamic Learning (ADL) price modeling system is showing the VIX is setting up for a massive increase over the next two to three weeks. VIX is currently trading near 16 and could spike to as high as 40 within just a few weeks. The only way the VIX could attempt a move like this is with a moderately deep downward price move that would take out or test our support levels. This is part of the analysis we conduct on a Daily basis at www.TheTechnicalTraders.com. It is not just about one or two charts – we look at all the puzzle pieces to see how they all fit together to give us a very clear picture of what is likely to happen in the future.
This could set us up for a good short volatility trade much like the last one in Feb where we shorted UVXY for a quick 42.5% profit.
Want to know what you should be trading and how you can profit from these setups? First thing to do is to understand this is a “trader’s” market and that you probably need some help understanding these moves. Second thing to consider is how will you identify opportunities from this move while protecting your investment capital? The last thing to consider is if http://www.thetechnicaltraders.com/#video is the right solution to assist you moving forward to help you navigate these markets and stay aware of these opportunities?
We believe our research is as beyond compare. We don’t believe you can find any other firm that can accurately predict what is going to happen in the future and that our advance price modeling systems and predictive analysis models assist us in keeping our clients keenly aware of future moves and relatively safe from unexpected events. Want to know how we can help you, visit www.TheTechnicalTraders.comand review some of our recent research reports and see how well we’ve been nailing these market moves for 2018. We hope to see you in our members area so we can share more insight with you.
Chris Vermeulen
53 years experience in researching and trading makes analyzing the complex and ever-changing financial markets a natural process. We have a simple and highly effective way to provide our customers with the most convenient, accurate, and timely market forecasts available today. Our stock and ETF trading alerts are readily available through our exclusive membership service via email and SMS text. Our newsletter, Technical Trading Mastery book, and 3 Hour Trading Video Course are designed for both traders and investors. Also, some of our strategies have been fully automated for the ultimate trading experience.
GET CHRIS’ TRADE ALERTS
DELIVERED TO YOU PHONE & EMAIL
CLICK HERE
Our articles, Technical Trading Mastery book, and 3 Hour Trading Video Course are designed for both traders and investors to explore the tools and techniques that discretionary and algorithmic traders need to profit in today’s competitive markets. Created with the serious trader and investor in mind – whether beginner or professional – our approach will put you on the path to win. Understanding market structure, trend identification, cycle analysis, volatility, volume, when and when to trade, position management, and how to put it all together so that you have a winning edge.
Get This Video Every Day Before the Markets Open!
Click Here
The analysis we have been conducting regarding the US and global markets shows one very interesting component that many people are overlooking – the pricing pressure in precious metals. Our research team at Technical Traders Ltd. has attempted to understand and this pricing pressure in relation to the strong international demand exhibited by China, India, Russia, and others.
The below chart showing top gold reserves being accumulated by countries.
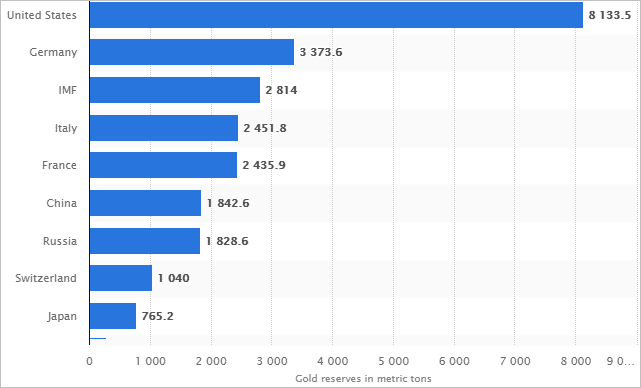
The United States holds the largest gold reserve of any country on the planet. Yet, China, India, and Russia have all been increasing their reserves dramatically over the past few years. We believe this is a move to support their currencies and economies by moving away from fiat currency and preparing for an eventual massive price advance in precious metals.
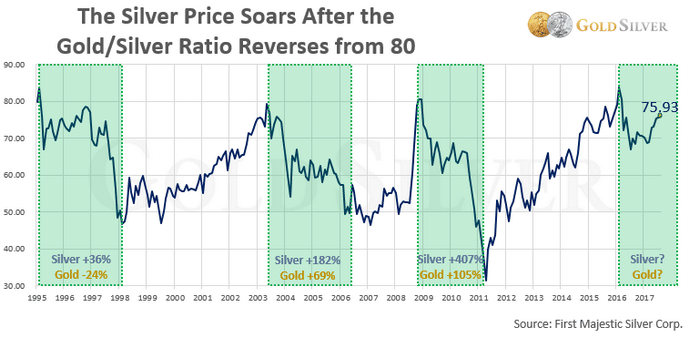
Comparatively, the Gold to Silver ratio is indicating that it would take nearly 79.66 ounces of Silver to equal 1 ounce of Gold (in terms of price comparison). This level typically indicates that Silver is dramatically undervalued compared to Gold. Yet, as we believe the price of Gold is about to launch to new highs and potentially push much higher into the future, this would indicate that opportunities for investment in either Gold or Silver could be substantial.
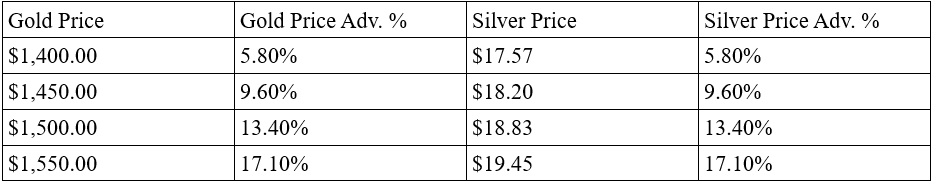
Currently, the price ratio between Gold and Silver points to the opportunity that Silver will advance in price faster than Gold, yet we believe these ratios could remain relatively stable as both price levels advance substantially. Should this ratio level remain relatively constant between both Gold and Silver, projected price levels should be as follows:
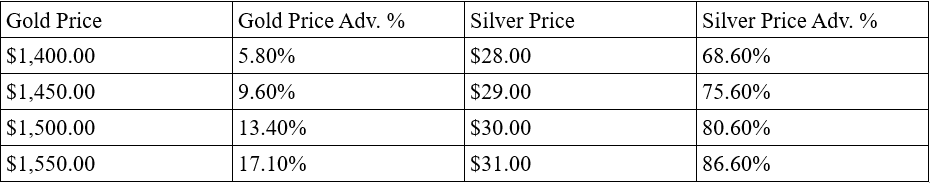
Should a similar disparity in price advance occur as it did in 2009~2010 moving from near 80 to near or below 50, then the price advance in Silver will become dramatically more pronounced.
We believe this type of move will likely become more evident as any greater market crisis event becomes more visible to global investors. In other words, there is a massive opportunity right now for strategic investments in physical precious metals as well as select equities that correlate to these potential moves.
Just recently, we profited 20% from the gold miner’s pullback taking advantage of our downward prediction. Now, we are looking at what could be the beginning of a new bullish leg upwards.
Our predictive modeling system is showing a very strong likelihood that Gold will rally to near $1380 within just a few weeks and continue to rotate near this level for a period of many weeks. This move, establishing a new recent high price level as well as potentially prompting a rising fear level in global investors may prompt a disparity in the Gold to Silver price ration resulting in a much more dramatic price advance in Silver.
Investors should prepare for a moderately strong price advance in the precious metals that may be associated with a US Dollar price decline as well as a moderate price advance in certain commodities. Now is the time to think about how you can profit from these moves and the potential disparity in the Gold/Silver price ratio.
We share our analysis so that you have some real predictive analysis data to research and review. We are not always 100% accurate in our pricing or timing modeling systems predictions, but you can spend a little time reading our research reports through most of this year to see how we’ve been calling these market moves since well before the start of 2018. Visit www.TheTechnicalTraders.com to see what we offer our subscribers and learn how we can assist you in finding great trading opportunities. In fact, pay attention to the market moves as they play out over the next few weeks to see how accurate our research really is. We’re confident you will quickly understand that we provide some of the best predictive analysis you can find and we are proud to offer our clients this type of research.
In closing, don’t fall for the fear and panic articles. Yes, the market is extended. Yes, the market may correct sometime in the future. Yes, the Fed has likely created a massive bubble. But it’s not over yet and the real trade is this 80%+ rally that is setting up in Silver while Gold is setting up for a 10~20% rally. Hope to see you in our member’s area where we can share more data and research to help you profit from these moves – visit www.TheTechnicalTraders.com to learn more.
Chris Vermeulen
We’ve been warning about the future moves in the metals markets for a week to our members and readers. Our most recent work showed the metals needed to decline a bit before any new advancement leg could properly setup. Just recently, we profited from the Gold and Silver pulled back taking advantage of our downward predicting, which should setup a strong leg higher which is starting to unfold now. Yes, this could be the beginning of a new bullish leg that metals bugs have been waiting for.
Before we get into the details, we want to alert you that his new advancement leg should be the beginning of a new Wave 3 price advance. This type of price advancement should last many months and consist of multiple price rotations. All we are highlighting today is the eminent price advance that should take place before the end of March. Our more timely and detailed research, which is typically only shared with our subscribers.
In fact, on Friday we sent all the subscribers who joined our 1 or 2-year Wealth Building Newsletter plans our newest book “The Crash of 2018-2020 – How You Can Profit” which is exclusive to those member’s and we look two years into the future and what we should be aware of.
GOLD DAILY CHARTS
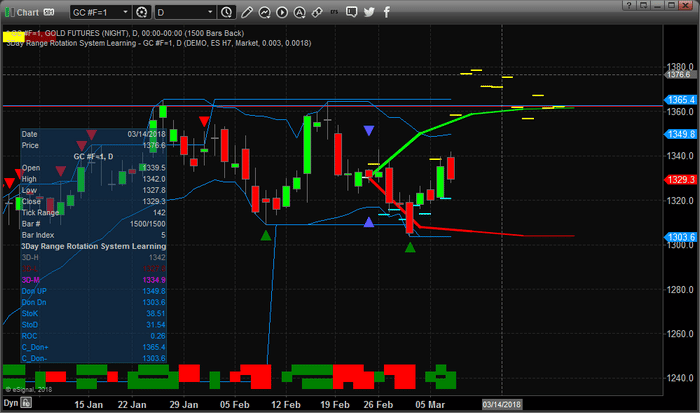
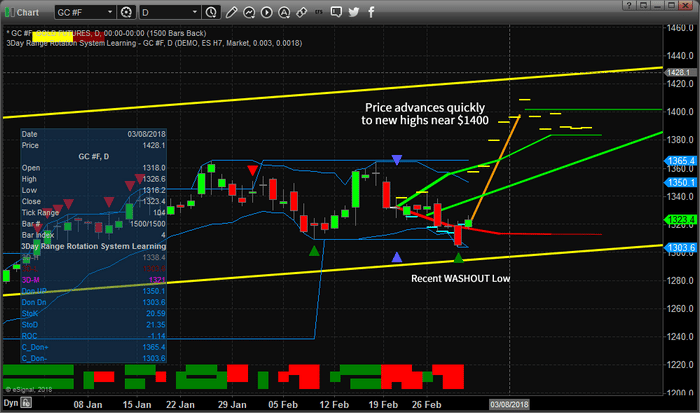
First chart of gold: Take a look at our adaptive price modeling system on this Daily Gold chart. This analysis is showing the price advance in the Gold should start with a strong move on March 5th and continue for at least a week – breaking recent highs and advancing towards $1400 before March 12th. After this move completes, a short period of congestion near $1400 should be expected before any further advance. Get ready if you want to take advantage of this $80 advance in Gold. We’re calling this move on March 3rd – so you have lots of time to get setup for the run.
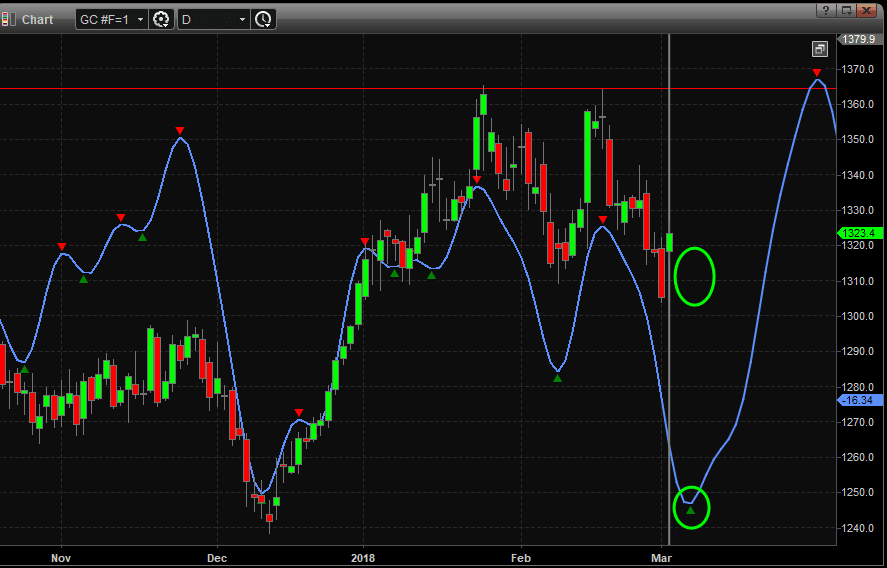
Second chart of gold: This chart shows a different type of analysis, which is based on the most recent and most recurring time cycles at play in gold.
SILVER DAILY CHARTS
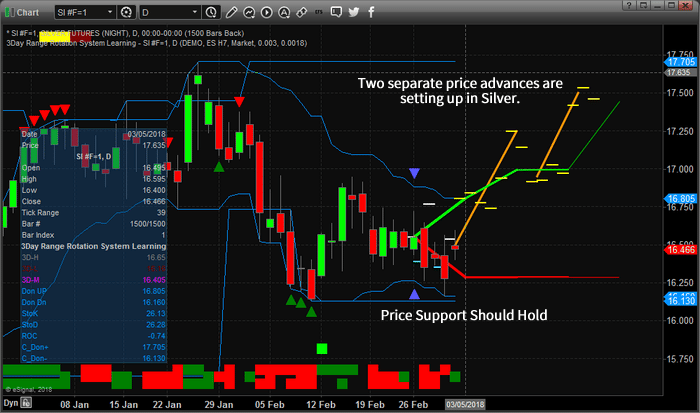
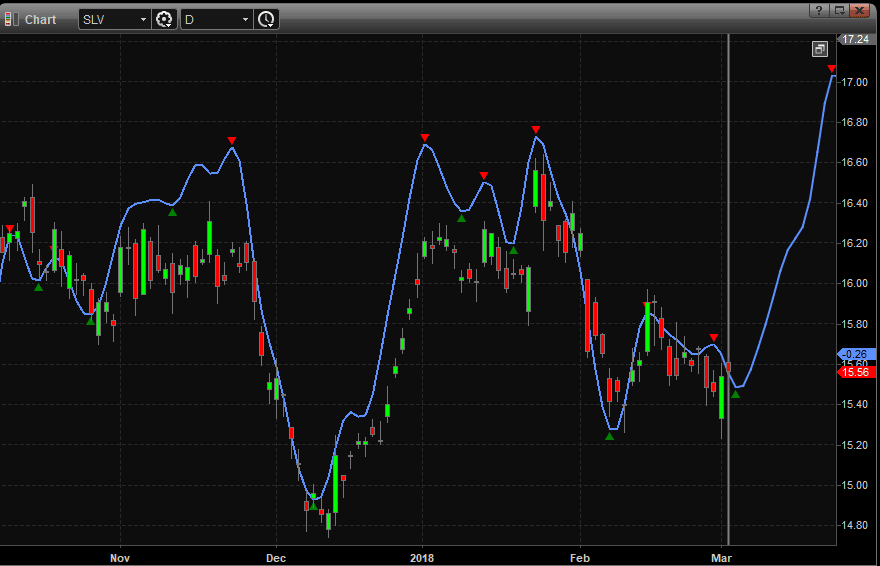
The setup in Silver is even more interesting because our adaptive price modeling system is showing two unique advanced in prices over the next few weeks. This means, as traders, we will have two unique opportunities to trade these advances.
The first move appears to start very early on March 5th with a moderate price advance early in the week, followed by 2 or 3 days of stalled prices. Prices then continue an aggressive move higher near the 9th or 10th of March. Shortly after that peak, prices will retrace to just below $17.00 for a few days – setting up a fantastic buying opportunity for the second advancement to near $17.50.
For traders, this is a fantastic setup. The first leg higher represents $0.60~0.70 rally in silver. The second leg represents a $0.40~0.50 rally. Combined for a $1.00~1.20 total in two quick trades. And, YES, we know about these moves because of our adaptive predictive price modeling system – which is capable of showing us the highest probability price outcomes many days or weeks into the future.
Second chart of silver: This chart shows a different type of analysis, which is based on the most recent and most recurring time cycles at play in silver.
We share this analysis so that you have some real predictive data to work with through March. We are not always 100% accurate in our modeling systems predictions or accuracy, but you can spend a little time reading our research reports through most of this year to see how we’ve been calling these market moves since well before the start of 2018. Visit www.TheTechnicalTraders.com to see what we offer our subscribers and learn how we can assist you in finding great trading opportunities. In fact, pay attention to the market moves as they play out over the next few weeks to see how accurate our research really is. We’re confident you will quickly understand that we provide the best predictive analysis you can find and are proud to offer our clients this type of research.
Get ready for this move and don’t miss the future ones. We’ll keep our members aware of all of these moves going forward so they can take advantage of these opportunities to generate profits. Hope to see you in our member’s area, as well, where we can share more data and research to help you profit from these moves – visit www.TheTechnicalTraders.com to learn more.
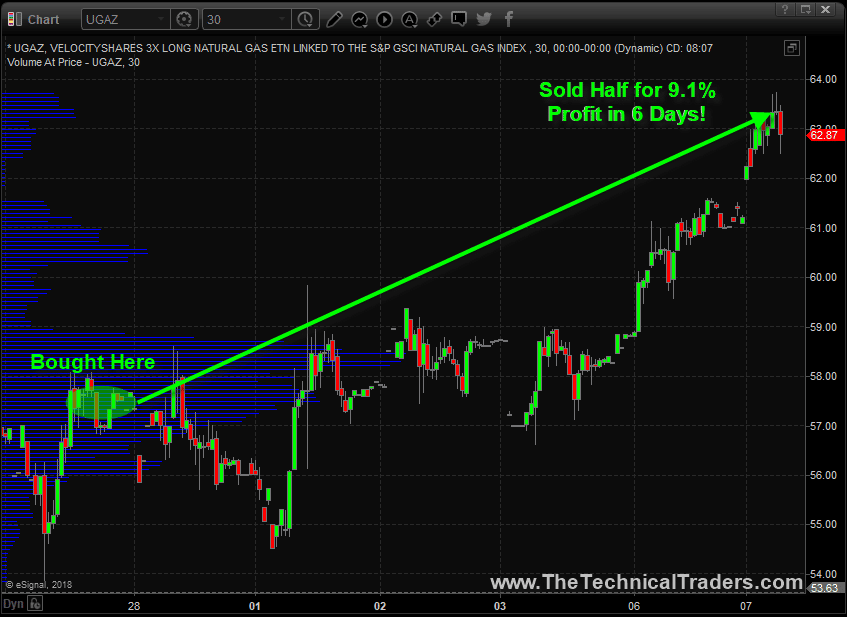
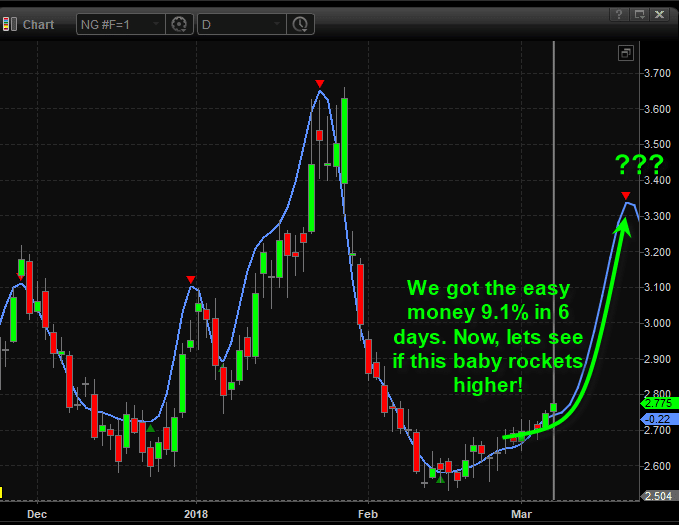
Last week we identified a prime chart pattern in natural gas that matched our technical analysis and cycle price prediction system. This type of setup is our favorite as it leads to quick juicy profits and the last setup we had like this in natural gas I think we pocketed 74% return in 12 days using the ETF UGAZ.
Charts speak for themselves so let me show you what myself and our subscribers are into right now. We are long UGAZ and today (Wed March 7th) we locked in 9.1% profit with UGAZ on half the position. Our stops are now at breakeven, and we are looking for the final blast off stage, which may or may not happen, but we are ready!
We share this analysis so that you have some real predictive data to work with through March. We are not always 100% accurate in our modeling systems predictions or accuracy, but you can spend a little time reading our research reports through most of this year to see how we’ve been calling these market moves since well before the start of 2018. Visit www.TheTechnicalTraders.com to see what we offer our subscribers and learn how we can assist you in finding great trading opportunities. In fact, pay attention to the market moves as they play out over the next few weeks to see how accurate our research really is. We’re confident you will quickly understand that we provide the best predictive analysis you can find and are proud to offer our clients this type of research.
Get ready for this move and don’t miss the future ones. We’ll keep our members aware of all of these moves going forward so they can take advantage of these opportunities to generate profits. Hope to see you in our member’s area, as well, where we can share more data and research to help you profit from these moves – visit www.TheTechnicalTraders.com to learn more.
Recently, quite a bit of news has been published warning of a massive market correction or top that may scare you. Our research shows this is not the case. We want to set your mind at ease with regards to these fears they may be experiencing with some real research and price modeling that has proven to be extremely accurate over the past 5+ months.
The research team at www.TheTechnicalTraders.com has continued to publish market research documents that have contradicted many of the largest research firms on the planet. Our small, but dedicated, team of analysts and researchers have spent years developing modeling systems that assist us in knowing what the markets will do in the future. In some cases, many weeks in advance. This helps us time our trades and select market sectors that are about to rotate well before the moves begin.
In fact, on Friday we sent all the subscribers who joined our 1 or 2-year Wealth Building Newsletter plans our newest book “The Crash of 2018-2020 – How You Can Profit” which is exclusive to those member’s and we look two years into the future and what we should be aware of.
In this post, we are going to highlight and illustrate why the fear that you may be reading about should be discounted – at least temporarily.
Near the beginning of 2018, we were warning that a market pullback would take place after a strong early start to the year. We called this correction almost perfectly and we called the recovery almost to the exact bottom. We recently warned the US majors needed to pull back a bit before the next upside leg could begin, and this recent market rotation to the downside is the outcome of that prediction.
Now, we believe the upside leg will begin in earnest and may surprise quite a few analysts and researchers. Many are expecting a retest of recent lows, yet our predictive modeling systems are telling us the US majors will move much higher, much quicker than many believe could ever happen.
This first chart of the ES (E-Mini S&P) clearly shows our advanced predictive modeling system, the ADL system, is predicting much higher prices over the next few weeks. Follow the DASH lines to the right of the current price to see what our price modeling system is predicting. When you do, it becomes easy to see that we should expect a few more days of price rotation near the current levels before a new advance begins near March 8th or later. After this price advance begins, our predictive modeling system is clearly illustrating a moderately aggressive upswing towards recent highs before a bit of consolidation near March 16~20. Shortly thereafter, an additional push higher should be expected with a continued price advancement well into the end of March.
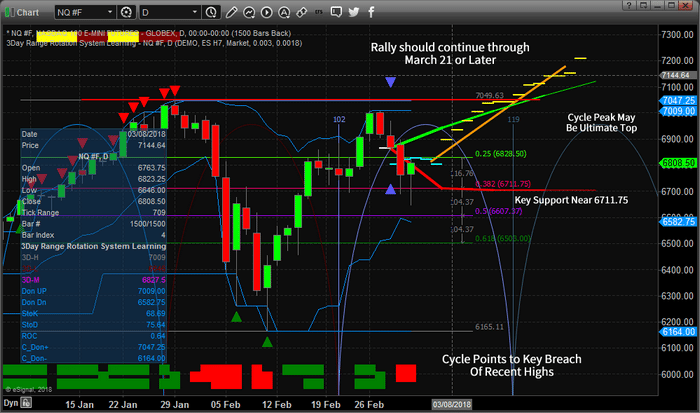
The adaptive price modeling system shows even clearer detail on this Daily NQ chart. We’ve added a Fibonacci Retracement of the most recent price rotation to this chart to help our readers understand key price levels and how they relate to price action. Remember, the adaptive price modeling system is attempting to identify and correlate the highest probability outcomes from price action and technical indicator patterns. It does not care about Fibonacci or other types of price analysis techniques. The fact that the price modeling support levels (the heavy red lines being drawn to the right of current prices) are aligning with the Fibonacci 6711 level shows us that this level is likely key support going forward.
The adaptive price modeling system is showing price advancement similar to that of the ES chart. A brief price rotation early next week, followed by a strong price advancement towards recent highs where price is expected to stall for a few days. Shortly thereafter, the price will begin to advance again to new highs. All of this is taking place within a similar time window as the ES chart analysis. Price will advance to recent highs near the March 15~20 and stall for a few days. Then the price will continue to advance above 7150 in the NQ before the end of March.
Yes, we are predicting a 350 point advancement in the NQ for those that are paying attention. Might be a really great trade sitting right in front of you if our research plays out again as expected.
We share our analysis so that you have some real predictive analysis data for research and review. We are not always 100% accurate in our modeling systems predictions or accuracy, but you can spend a little time reading our research reports through most of this year to see how we’ve been calling these market moves since well before the start of 2018. Visit www.TheTechnicalTraders.com to see what we offer our subscribers and learn how we can assist you in finding great trading opportunities. In fact, pay attention to the market moves as they play out over the next few weeks to see how accurate our research really is. On Friday morning before the market opened, we showed subscribers a quick intraday trade that on the SP500 index that lasted only 3 hours and netted $650 profit to end the week. Bottom line, we’re confident you will quickly understand that we provide some of the best predictive analysis you can find and we are proud to offer you and members this type of research.
In closing, don’t fall for the fear and panic articles. Yes, the market is extended. Yes, the market may correct sometime in the future. Yes, the Fed has likely created a massive bubble. But it’s not over yet and the real trade is this 350+ point rally that is set up. Hope to see you in our member’s area where we can share more data and research to help you profit from these moves – visit www.TheTechnicalTraders.com to learn more.
This morning we sent out a spike alert to subscribers and all three of those price targets have now been reached.

If this type of trade excites you to learn more click here and see examples and explainer video of how to trade them.
53 years experience in researching and trading makes analyzing the complex and ever-changing financial markets a natural process. We have a simple and highly effective way to provide our customers with the most convenient, accurate, and timely market forecasts available today. Our stock and ETF trading alerts are readily available through our exclusive membership service via email and SMS text. Our newsletter, Technical Trading Mastery book, and 3 Hour Trading Video Course are designed for both traders and investors. Also, some of our strategies have been fully automated for the ultimate trading experience.
Chris Vermeulen
Chief Investment Strategist