Our previous three segments of this research report detailed not only the history of the Chinese economic activity but also detailed some of the capital flow issues that have been active in presenting this unique instance in time as it relates to a potential implosion of economic activity in China and most of Asia.  We, the research team at Technical Traders Ltd., have attempted to clearly illustrate all of the components and facets that have existed to make up a very unique scenario where traders may be able to experience a once or twice in a lifetime trade that could result in massive returns.

Within our previous posts, we attempted to disclose what we believe to be one of the most critical and potentially damaging economic events in our future.  We urge all readers to review (Part I, Part II, Part III) of this multi-part research report to bring everyone up to speed with our thinking.  Please take a moment to our earlier posts before continuing.

In this section, we are going to explore the ongoing relationship between debt levels, shadow economic functions, global equity price levels and global economic activity all coincide at this very unique time to present a potentially massive and unprecedented event in human history – a massive economic collapse across dozens of nations and resulting in a potentially cataclysmic economic outcome.  We are certain you might be asking, “how could this happen again?”.  Well, in some ways the recovery process in the US, Europe and other areas could have prompted a very unique and dangerous setup in China, India and the general Asian region.  Why are these areas uniquely at risk?  The reason is because China has become a major economic driving force in the region and has become responsible for much of the areas economic advancement.  This has been the case since the late 1990s.

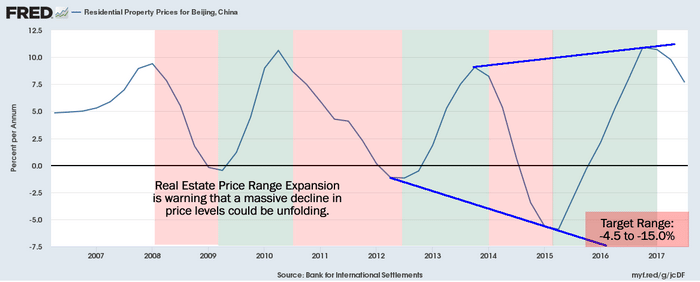
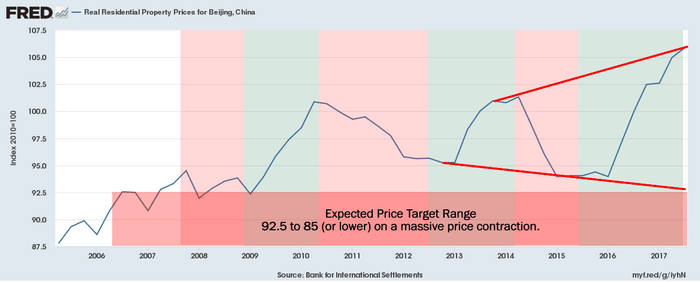
In the previous section, we hinted that a downturn in the Chinese property market between 2015 till 2016 in combination with an equity price decline in excess of -15% to -20% and an outflow of capital from the Chinese economy resulting in a massive, $1 trillion, decrease in the Chinese capital reserves.  How could something like this result in a total of $1 trillion in reserves to be depleted?  The answer is that pressures on the economy at that time resulted in a number of general and corporate debt failures that, if left alone, would have pressured the entire Chinese financial/banking system into a possible crisis.  Therefore, the Chinese had to make the problem go away and they did this by diving into their reserves to wash away the debt issues while continuing to prop up their economies and banking institutes.  This $1 trillion reserve decrease was the “patch” that was needed to make sure the economic collapse was averted.

We have been watching the news and related investment research for years attempting to stay on top of these moves and keep our members aware of the potential for a market correction/reversal.  Part of our research is now warning us that we need to begin to prepare for the eventual crumbling of the economic footing of the global markets and we believe China/Asia will play a massive role in the next big move.

Chinese debt to GDP is massive compared to the US or other developed nations.

And China’s debt just keeps rising…

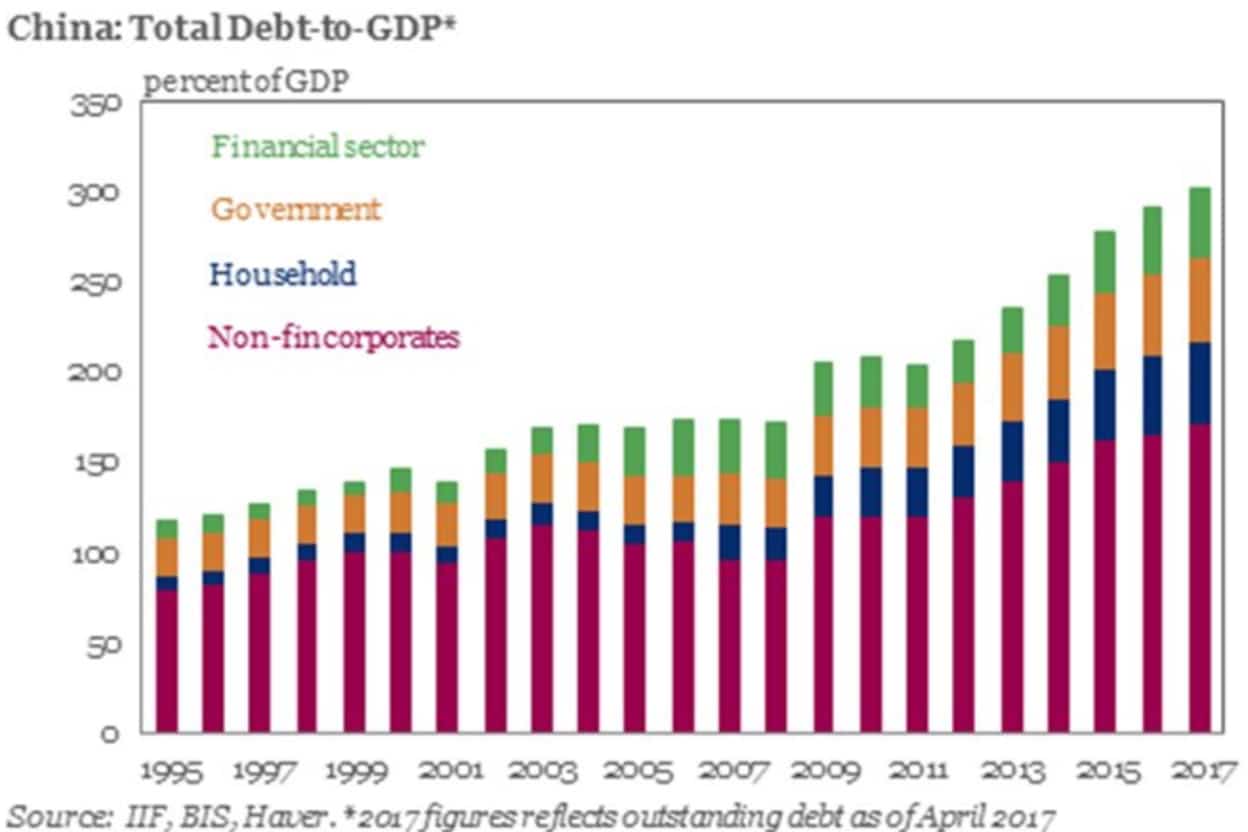
By our estimates, the current Chinese debt to GDP levels have increased by nearly 100% (to somewhere above 350% of total annual GDP.  Additionally, current levels are well in excess of 200% to 300% of levels found near 2005 to 2007.  If we consider 2014 levels alone, the time just before the massive $1 trillion reserve decrease, debt levels today are nearly 45% larger than debt levels in 2014.  Therefore, the fragility of the Chinese economy in terms of debt constrictions related to any proposed property market price rotation and/or any capital/equity market price correction, particularly if they happen at the same time (like before), could present a very unique collapse event.  It is our opinion that the current debt levels make the fragility of the Chinese economy even more sensitive to property market and/or equity market disruptions.

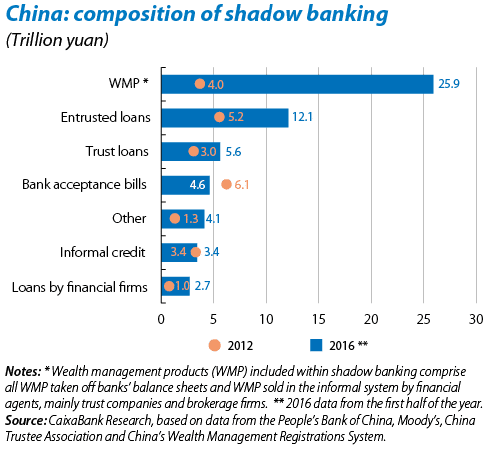
China’s shadow banking, particularly WMP (Wealth Management Products), Entrusted, Trust and loans by Financial Firms present a huge issue in regards to stability of the Chinese credit markets.  Over 4~5 short years, over $30 Trillion Yuan in these types of loans have been originated – a massive 400% increase on average.  The individual component levels range from a 100% increase to well over 650% increase.

Remember, these financial (credit) instruments are rooted in the projections that borrowers have the ability and capability to repay these loans, or that the projects they back will result in substantial real value at some point.  The loan origination data, below, shows a decent increase just after the US Presidential elections and we are certain this recent rally in the US and global markets has eased some pressure away from the Chinese and other Asian markets.  Yet, the recent price rotation (February and March 2018) could be “just enough” to crush the floor in the Chinese/Asian markets waiting for that last pin drop to start the crumbling process.

It is our belief that any contraction in any single market, Chinese property, Chinese equities or Chinese debt could likely be contained as long as the contraction range is less than 15~25% from the most recent highest valuation points.  Our range of 15~25% is just that, a range that should be considered extremely dangerous for the Chinese and Asian markets.  Should two or more of these market react in a similar manner, decreasing by 15~25% over an extended 12~24 month period, we believe the pressures of this type of move could be catastrophic for China and parts of Asia.  The simple fact that two, or more, capital markets that experience this type of valuation decline would likely put an additional $1 to $2.5 trillion (or more) in reserve pressure on the Chinese and local markets.

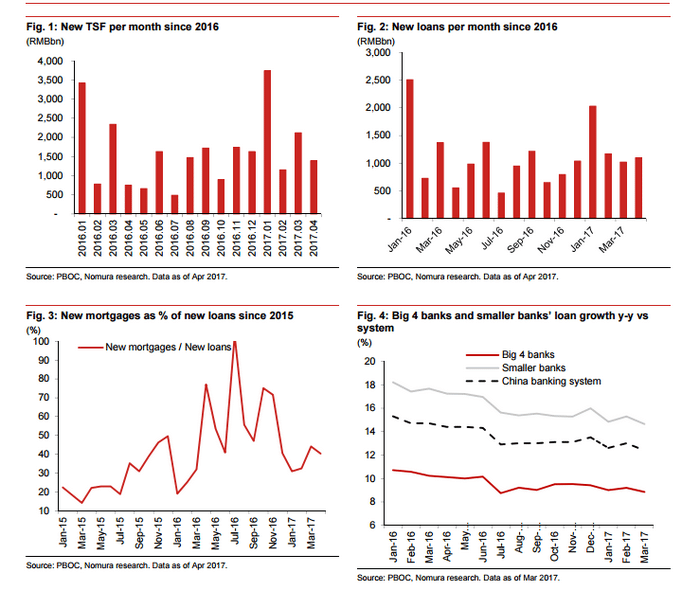
Additionally, this type of valuation pressure would likely result in liquidations of foreign assets at near fire-sale prices to move these asset into cash as quickly as possible.  This type of market action is called a “death spiral” for a reason.  As panicked sellers dump assets to get into cash, they are driving the property and equity valuations even lower in the process – causing others to become panicked sellers and perpetuating the cycle.  A death spiral event is one that sparks up overnight, causes runs on banks as people try to get as much cash as possible and causes wildly unreasonable price valuations simply because people are desperate to unload assets that could destroy their balance sheets.  It is better to sell it for X than to hold onto it and watch it destroy any existing capital I may currently have.

Now that we’ve gone through quite a bit of detail in describing what could happen, allow us to go into just a bit more detail with our next article showing the current equity markets and the current property markets in these regions in addition to more of our predictions.

53 years experience in researching and trading makes analyzing the complex and ever-changing financial markets a natural process. We have a simple and highly effective way to provide our customers with the most convenient, accurate, and timely market forecasts available today. Our stock and ETF trading alerts are readily available through our exclusive membership service via email and SMS text. Our newsletter, Technical Trading Mastery book, and 3 Hour Trading Video Course are designed for both traders and investors. Also, some of our strategies have been fully automated for the ultimate trading experience.

If you like what we offer, please visit to learn more about our trade alert services and research.  We put these types of research posts out to the public because we believe it is our duty to alert and warm traders of opportunities and risks that others may not be talking about.  We try to make it simple, but in this case, the details are more complex and require a bit more effort on our part.  We welcome you to join our valued members and become part of our team of professionals while we navigate these markets and find opportunities.  Please visit www.TheTechnicalTraders.com to learn more.

Thank you for following our multi-part research (Part IPart II) into the possibility of a China/Asia market collapse and our hypothetical analysis of what that event might consist of and how it may play out.  So far, we have discussed the Chinese housing market rotation as well as the recent trends within the past 7+ years, expansion and foreign investments made by many Chinese and successful Asian investors.  All of this research raises some interesting questions for us to consider.

  • Just how much risk exposure have these Asian/Chinese investors set themselves up with?
  • How deep of a property price or equity price decline would be enough to set off a panic mode?
  • How tightly are the assets in China/Asia associated with equity/debt that was used to explore foreign investments and additional debt?
  • How varied and deep do these “debt rabbit holes” go in terms of derivative assets, layered debt and more?
  • How has the expansion of credit/debt in China expanded out into other foreign markets?
  • How has the US and other central bank easing policies fostered a risk-taking role in Asia over the past 7+ years?

And finally, the BIG question:

What would it take for China/Asia to move from an investments/risk-taker mode to a protectionist/crisis mode?

One of the first things we need to consider is the expansion of credit that originated after the global market credit crisis (2008 to 2010) was still evident in China and Asia – although not quite as deep in form and structure as it was in the US, Canada, Europe and others.  Our previous research reports show that China’s property market and equities markets were not subject to the types of deep declines the US and other established economies experienced.  This was likely because China, at the time, was still experiencing a middle stage economic expansion period where China could continue to fund and export enough raw and finished materials to keep their economy running at 6%+ without much issue.  Of course, after 2015~2016, China was able to accomplish this by devaluing their currency, expending billions in reserves to build and product excess cities and finished material as well as foster and finance hundreds of large-scale projects throughout the globe (Africa, Europe, Asia, Mexico and South America).

In other words, the growth that China is experiencing is almost a shadow of the real growth because it has been enacted by shadow banking, shadow debt and leveraged expenses based on reserves while decreasing the Yuan valuation in order to maintain this economic shell game.  As long as their markets don’t contract more than a certain amount and investors are able to continue rolling their capital into this shadow banking system without any fear – nothing will likely change.  But when it does change, it should be very dramatic and quick.

Recent Chinese economic expansion has been partly a result of renewed global economic activity as well as the capacity of the Chinese government to use capital reserves to support their economic transition process – as evident by the $1 trillion in capital reserves that vanished between 2015 and 2017.

When one considers the recessionary economic cycles chart, above, as well as the US Presidential election cycle, one could explain this contraction as a general global contraction in relation to the uncertainty of a US election.  Yet, the size and scope of the capital reserve decline (over $1 trillion) within the scope of an expanding global economy, as well as expanded investment projects within China, means only one outcome could result in this reserve decline – reserves were used to support banking and finance facilities in an effort to avoid a collapse of credit/debt mechanisms.

These are tell-tale signs that the Chinese, and likely other Asian/Indian countries, are trapped in an expansive credit/debt environment that is likely very similar to what happened in the US/UK to set off the 2008~2010 global credit crisis.  The only difference this time is that it appears to be the Chinese have run themselves into this debt trap and the fragility of their economic footing is showing signs of cracking.

What would it take to cause the floor to crumble under the Chinese/Asian economies?

A deep (-32%) price correction occurred between 2015 and early 2016 that coincides with the reserve decrease as well as the property market price decline.  As our research shows, this also coincides with a mass exodus of capital from within China to outside sources (USA, Canada, UK and elsewhere).  If a decline of this nature in equities that was also associated with a property price decline resulted in a $1 trillion decline in China’s reserves, think about the potential chaos that could be associated with a new property price decline associated with an equity market decline.

The next portion of this report will explain the magnitude of this potential move in very clear relative terms and explain why we believe all traders should be aware of this move as it is setting up.  We hope you are enjoying this research and the detail in which we are bringing this to you.

53 years experience in researching and trading makes analyzing the complex and ever-changing financial markets a natural process. We have a simple and highly effective way to provide our customers with the most convenient, accurate, and timely market forecasts available today. Our stock and ETF trading alerts are readily available through our exclusive membership service via email and SMS text. Our newsletter, Technical Trading Mastery book, and 3 Hour Trading Video Course are designed for both traders and investors. Also, some of our strategies have been fully automated for the ultimate trading experience.

We believe this move will present tremendous opportunities for all traders and we believe www.TheTechnicalTraders.com is the only source for this type of detail and success.

53 years experience in researching and trading makes analyzing the complex and ever-changing financial markets a natural process. We have a simple and highly effective way to provide our customers with the most convenient, accurate, and timely market forecasts available today. Our stock and ETF trading alerts are readily available through our exclusive membership service via email and SMS text. Our newsletter, Technical Trading Mastery book, and 3 Hour Trading Video Course are designed for both traders and investors. Also, some of our strategies have been fully automated for the ultimate trading experience.


We believe this move will present tremendous opportunities for all traders.

Our articles, Technical Trading Mastery book, and 3 Hour Trading Video Course are designed for both traders and investors to explore the tools and techniques that discretionary and algorithmic traders need to profit in today’s competitive markets. Created with the serious trader and investor in mind – whether beginner or professional – our approach will put you on the path to win. Understanding market structure, trend identification, cycle analysis, volatility, volume, when and when to trade, position management, and how to put it all together so that you have a winning edge.

Get His Wealth Building Trade Alert Newsletter Today!
Click Here

In our previous article regarding the potential China/Asia Economic Implosion, we illustrated how the property market cycles in China (Beijing) are in the early stages of a potentially topping and a massive drop in value.

Today, we are going to try to expand on this analysis a bit further by illustrating how the US and other global established economies may have inadvertently setup certain emerging markets for another global crisis event.  Our research team at Technical Traders Ltd. has developed a unique set of skills in sourcing and evaluating current market events and predictive price modeling systems that allow us to attempt to determine future events with relative certainty.  Within this post, we will attempt to provide further evidence and supporting data as it relates to our belief that we are in a very late stage economic expansion cycle and about to enter a very early stage economic contraction cycle.  As we continue to disclose our research and findings within this multi-part article, we will close this research out by explaining how and why we believe smart investors will be able to create massive opportunities over the next 12 to 48 months from our research.

Please review our previous research post (Part I) of this detailed research report before you continue reading if you have not already read it.  It is important that you continue reading this post with the context of the previous research post.  Thank you.

You should recall from our first post that we illustrated the expanding real estate cycle events in Beijing and how they related to a downside price cycle that appears to be in the very early stages of rotation.  Today, we want to illustrate how the US market has been driving much of this expansion and speculation in China.  Below, we have highlighted the same Beijing pricing cycles over a US Real Estate Equity chart.  The point of this analysis is to clearly show that real price/equity expansion in the US market did not begin to occur until late 2012 and into early 2013.  This was the time that real estate values in the US began an upward trajectory and real equity was being earned again.  Prior to this, from roughly 2006 to the end of 2011, real estate price equity was declining or basing – with no real attrition or increase.

Now, if you open up Part I of this article in a separate window, you’ll see that the real price expansion in the Beijing real estate market also began in mid to late 2012 and peaked in 2014.  Our analysis and belief is that many Chinese investors were jumping into the US and global real estate markets at this time and that the increase in prices in Beijing assist them in diversifying assets across the globe by buying foreign assets.  We believe this assumption is supported by the price decline in Beijing between mid-2014 through early 2016.  We believe the previous price advance allowed Chinese investors to leverage their gains into outside/foreign assets while chasing the easy credit allowed by many foreign central banks.

It was also evident that many Chinese were moving capital outside China in an attempt to source new revenue growth.  We believe this transition to outside assets was in full swing by 2013 to 2016 – when China finally started clamping down on capital flowing outside it boarders.

For your reference, here are a few resources to support our findings:

NYTimes : February 13, 2016: Chinese Start to Lose Confidence in Their Currency

The Strait Times: February 15, 2016: China’s rich move money our of country, joining capital exodus

The Wall Street Journal: December 2, 2016: China Clamps Down on Exodus of Cash


It is obvious from the data that Chinese investors and wealthy individuals were hungry for returns in an environment where their stock markets had recently declined more than 30% while their real estate markets were experiencing a multi-year price decline of well over 10%.  What were these people to do but find outside sources for returns and move their money into foreign investments that could allow for continued revenue growth. And what better place to move their money than the US and Canada – which were experiencing massive real estate price advances.

Take a look at this chart of the Canadian real estate price advances over the past 15 years.  Incredible.

But, think about this for a minute, now that many of the Chinese were investing in Chinese and foreign assets and property while at the same time investing in China ‘s shadow government, corporate and derivative investment schemes, what are they to do with all this capital tied up in markets that are nearing or entering a contraction phase?  What is their exit plan and how can they move to the sidelines fast enough to avoid the risks associated with collapse?

We’ll cover that in Part III of our research.

Our research team at www.TheTechnicalTraders.com has been actively following these trends and global market indicators for years.  We specialize in developing advanced price modeling systems that assist us in determining what may happen in the future and we attempt to capitalize on these moves with our members/subscribers.  Our members receive advanced warnings of these types of setups and we alert them to critical trade setups in real-time – as they happen.  We urge you to visit our website to learn more about our services and products and we hope you find our research informative and relevant to current market events.  If you want to be ahead of the markets with our continued research and content, please consider becoming a valued member at www.TheTechnicalTraders.com

GET OUR TRADE AND INVESTMENT SIGNALS HERE

PART I

Recent news of the US enacting $60 billion in economic tariffs on China as well as reactionary tactics from China have everyone spooked.  The US stock markets and global markets tanked last week as this news hit the wires.  At www.TheTechnicalTraders.com, we have been warning of a massive upside move in precious metals as well as global market concerns for the past 12+ months.  Our recent research shows just how fragile the global markets are to external factors as well as strengths in the US and other established economies.

This multi-part special report will delve into the immediate and future risks that are associated with the fundamental and economic likelihoods of credit market contractions and economic rotations within the China, India, South East Asia markets in relation to recent news events.  We hope to clearly illustrate the opportunities and risks that will likely play out over the next 12 to 48+ months for investors and traders.  Let’s start by trying to keep it simple with some very clear examples of what has transpired over the past 4 to 5 years and how we believe things will change in the near future.

This chart of property price cycles (advancing price cycles vs. declining price cycles; highlighted for your convenience) in Beijing, China, clearly illustrates the expansion and contraction cycles experienced in the capital city/region of China.  One can clearly see the expansion of the peaks vs. troughs as these price cycles have played out over the past 10 years.

What we find interesting about this chart is that the upper boundary appears to reside within the +8.5% or slightly greater expansion range, while the price contraction cycles continue to explore deeper and broader downside boundaries over this same range.

This leads one to consider the possibility that Real Estate prices and cycles in China may be much more speculative in nature than we may have considered in the past.  It also points to the concept that the Global Credit Crisis (2008 through 2010) may have created a consumer mentality that wealth can be created by speculating on real property throughout these cycles.

Additionally, we see some correlation to the real price valuations of Beijing property in the following chart.  Any analyst can clearly see that prior to 2008, the rotational price levels were much narrower than after 2008 (roughly 2~3% in range vs. 7 to 15% in range).  This volatility in pricing is one key factor that is leading us to our conclusion that the current downward price cycle (see the above chart) may lead to a substantially lower downside price target range in Beijing (and other areas of the world).  Our analysis leads us to believe this early stage price rotation is an excellent opportunity for investors and traders to prepare for and begin to execute trades to attempt to profit from these events.

Recently, we posted an article regarding the massive increase in pre-foreclosures in most US metros.  Our intent was to illustrate just how dynamically this price cycle is changing and to highlight the potential for investors to be prepared for a move.  Our current research into the potential for a China/Asia market implosion is based on the assumption that the past years of easy money, quantitative easing, support for property markets across the globe and massive support for an expansion cycle are nearing an end event.  If our analysis is correct, this end event cycle will present incredible opportunities for smart investors by attempting to capitalize on early and middle stage market events.

This current data, as shown above, clearly illustrates this price cycle event is very early in the rotational process and this presents a huge opportunity for investors.  Our research team at Technical Traders Ltd. has been actively following these trends and global market indicators for years.

We specialize in developing advanced price modeling systems that assist us in determining what may happen in the future and we attempt to capitalize on these moves with our subscribers.  These members receive advanced warnings of these types of setups and we alert them to critical trade setups in real-time – as they happen.  We urge you to visit our website to learn more about our services and products and we hope you find our research informative and relevant to current market events.  If you want to be ahead of the markets with our continued research and content, please consider becoming a valued member of our Wealth Building Newsletter.

With 53 years experience in researching and trading makes analyzing the complex and ever-changing financial markets a natural process. We have a simple and highly effective way to provide our customers with the most convenient, accurate, and timely market forecasts available today. Our stock and ETF trading alerts are readily available through our exclusive membership service via email and SMS text. Our newsletter, Technical Trading Mastery book, and 3 Hour Trading Video Course are designed for both traders and investors. Also, some of our strategies have been fully automated for the ultimate trading experience.

Chris Vermeulen
Technical Traders Ltd.

As you likely know, the stock market, trading, and even long-term investing are not easy. That’s why in this post we want to make the complex simple for you. We will do this in a way that will give you that “Eureka!” moment regarding knowing what the stock market is doing now, and where it is headed over the next 12-36 months.

Last August we spotted trends in the underlying financial system that are very early warning signs that the bull market in stocks will be coming to an end, along with this growing economy. There is a ton of data taken into account for this information, but we have broken it down into simple bite-size points that simply make logical sense, from a technical analysts perspective.

FIRST WARNING 

Back in April 2017, we posted an article showing the first set of data that most traders and investors do not see or follow, mortgage delinquency rates. Delinquency rates in Single Family Residential Mortgages and other Consumer Loans began to climb through the second half of 2016 and continue to rise today.  We shared with readers a way to take advantage of this using the Real Estate Bear Fund (DRV). This fund is now up over 20% and climbing as it rises when real estate falls.  The rise and timing of this delinquency rate increase coincide almost identically with the Fed when they raise rates. And the problem is not just mortgages defaulting, the same is happening with commercial loans, and credit card debt.

Just look at what has the fed being doing like a mad-man of late? Ya, jacking up rates like they are going out of style!

The graph below shows a red line which is the fed rate, and as that rises so do loan delinquency rates (blue line). You will also see the grey shaded areas on the graph, and these are bear markets (falling stock prices). It’s obvious that we are headed towards financial issues once again with debt and the stock market.

MORTGAGE RATES AND DELINQUENCY RATES ON THE RISE

On March 18th 2018 we post an update showing how real estate foreclosures are starting to rise dramatically! Subscribers to our Wealth Building Trading Newsletter took advantage of this as we got long SRS inverse real estate fund which jumped over 5% in the first two days of owning it.


SECOND WARNING – ASSET AND BUSINESS CYCLES

Because we are traders and investors our focus is on making money, so we are only looking at the blue wave/cycle on the diagram below. The blue cycle is the stock market, and the numbers posted along that cycle indicate which stocks/assets should be the most in favor, rising.

As you can see the numbers 9 and 11 at the top are both commodity based (precious metals and energy). And knowing that commodities typically perform well just before a bear market in stocks unfolds, we are on the cusp of a new trade that could last a few months and post significant gains.

COMMODITY PRICE INDEX

Take a look at the commodity index chart below. Without getting to deep in to stage analysis I will just say commodities have formed a very strong “Stage 1” and are primed and ready for a multi-month rally.


THIRD WARNING – PSYCHOLOGY OF THE MARKET

This market appears to be in a EUPHORIC “wonderland” moment driven by the fact that the global central banks have created a waterfall event of cheap money that is driving all of this asset valuation recovery.  And, as capital is continually searching for the best environment for ROI, it is moving into the best areas of the global economy for survival purposes which we feel should soon be commodity-related assets, then eventually cash once the bear market takes hold.

STOCK MARKET CONCLUSION:

In short, as long as the capital continues to flow into the securities (stocks) and commodities in search for the best return on investment, we will continue to see markets hold up. But, stay cautious because when the markets turn and money is no longer looking for the next top performing sector or commodity, but rather just wants to exit investments as a whole and convert to cash (cash is king), that is when the bear market starts, and it could be very quick and violent.

Additionally, as we’ve shown with these charts and graphs today, we are entering a frothy period in the markets, and we would urge all investors to be critically aware of the risks involved in being blind to these facets of the current stock market and housing bubbles.

With 53 years experience in researching and trading makes analyzing the complex and ever-changing financial markets a natural process. We have a simple and highly effective way to provide our customers with the most convenient, accurate, and timely market forecasts available today. Our stock and ETF trading alerts are readily available through our exclusive membership service via email and SMS text. Our newsletter, Technical Trading Mastery book, and 3 Hour Trading Video Course are designed for both traders and investors. Also, some of our strategies have been fully automated for the ultimate trading experience.

Chris Vermeulen
Technical Traders Ltd.

Cory Fleck, from The Korelin Economics Report joins me for his insights into the US markets and the oil market.

Click the download link to listen on this device: Download and Listen to Show Here

53 years experience in researching and trading makes analyzing the complex and ever-changing financial markets a natural process. We have a simple and highly effective way to provide our customers with the most convenient, accurate, and timely market forecasts available today. Our stock and ETF trading alerts are readily available through our exclusive membership service via email and SMS text. Our newsletter, Technical Trading Mastery book, and  3 Hour Trading Video Course are designed for both traders and investors. Also, some of our strategies have been fully automated for the ultimate trading experience.

GET CHRIS’ TRADE ALERTS HERE

With the news today from the US Fed and the rate hike, we should all be asking ourselves “where are we in the market cycle” so that we can prepare for and identify proper trades that may set up in our future.  One thing is for sure; we are not in the perpetual easing environment of the past 7+ years.  The Fed indicated they are expecting at least two more rate increases are expected this year and also hinted that a forth may be possible depending on the economic activity.

Our research team at www.TheTechnicalTraders.com is always trying to identify trends and opportunities before they happen for our members and partners.  We have a pretty good track record at calling the markets for 2018 and have called many of the markets moves weeks in advance.  Please review some of our recent market research to see for yourself how well we’ve been picking apart this market.  Today, we are going to illustrate where we believe the US markets are in relation to a typical market cycle and what we should be watching for in our immediate future.

A typical market cycle can often be identified by watching two components of the economy: the Bonds and Commodity prices.  When Commodities rise and Bonds fall, the market cycle is considered middle to late stage expansion and traders should be playing any continue bullish price moves as late-stage opportunities in a bullish trend.  When Commodities fall and Bonds rise, the market cycle is considered middle to late stage contraction and traders should be playing early bottom picking trades as well as late stage bearish trend trades.

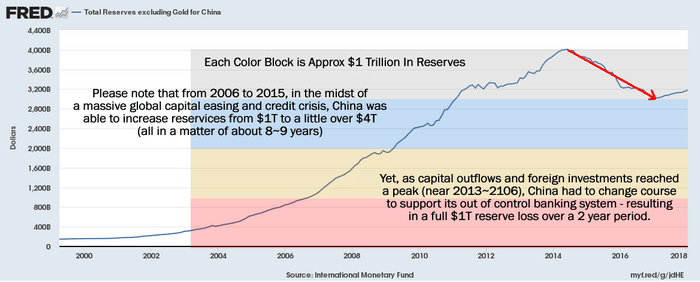
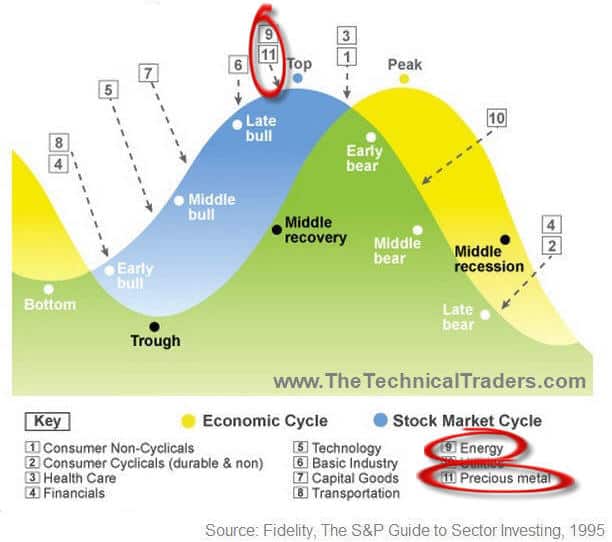
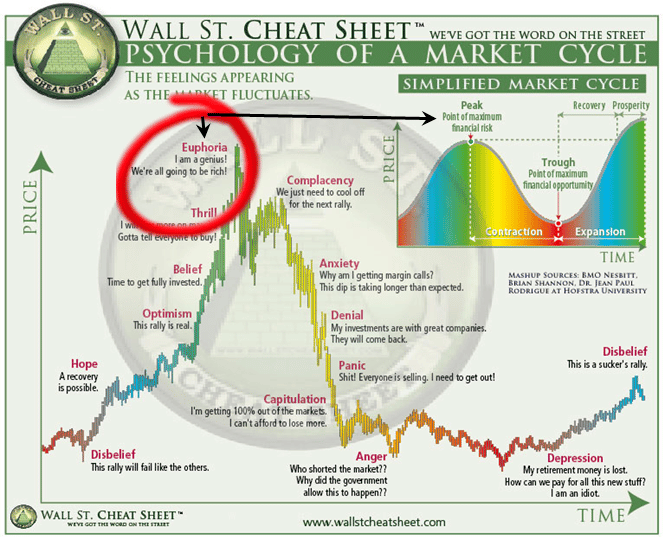
One can see from this simple Economic Cycle that Market Tops are typically preceded by moves in Commodities and Bonds.

When we look at the global commodity price valuations going back many years, we will quickly see that commodities have recently been historically low and this could result in a dramatic increase in commodities in the future which would be one of the primary signs of late stage expansion.  The expansion in global commodity prices rotated lower in late 2014 as oil fell to recent lows and as the global central banks eased off the quantitative easing and money printing.  Recently, just before the US elections in 2016, the global commodity price index reached the lowest level since 2004-05 and started climbing higher.

Therefore, we have already begun to experience one of the key components of a market cycle top – rising commodity prices.  We would watch for Bonds to decrease as well as Capital Goods, Basic Materials and Energy sectors to rotate out of a historical price channel.

Of unique interest is that late stage economic rallies are often identified by a rally in the precious metals markets as fear of a top or of late stage corrections become more pronounced.  Over the past few months, we’ve been warning of a potential Wave 3 leg higher in both Silver and Gold.  Many people may not understand the scope of this potential move and the potential it may have on your trading.  The size of this move could be substantial.  The last rally in the metals that originated after the prior to the 2009 market crash resulted in a price advance from roughly 78 to nearly 435 – a 557% increase in just under 7 years.

What would a similar move in the metals look like today?  Could it happen?  Would it be as dramatic?

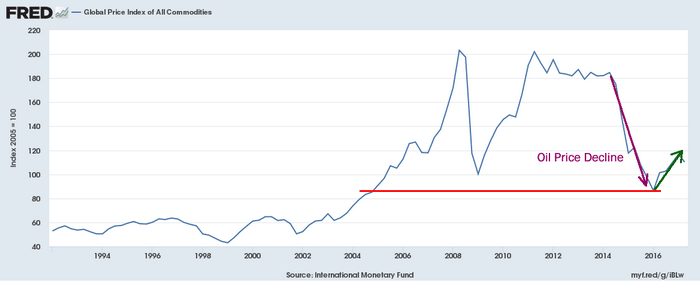
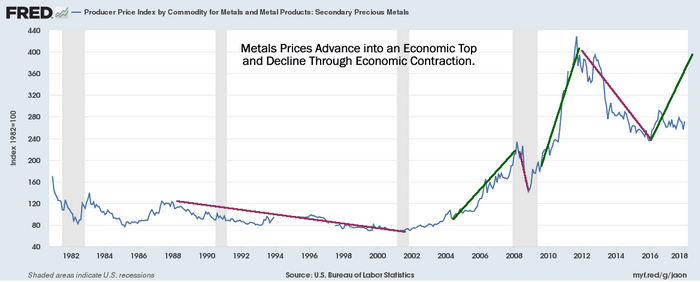
Gold closed $1332.50 today.  A 250% increase would put gold at $3331.25.  A 350% increase would put gold at $4663.75.  A 450% increase would put gold at $5996.25.  So, is a $6000 price for Gold reasonable?  Possibly, give certain market setups that prompt a similar price advance as we had seen after 2002.  It would all depend on how this new market top unfolds and the level of fear that resides in the global markets.

The last precious metals signaled a trade was in February we profited 20% in only 7 days profiting from falling prices. The next trade setup could be much larger.

As the US fed pushes rates higher, more and more consumers will be pushed to their financial limit that will drive some level of economic contraction.  It is almost like the US fed has no understanding of supply and demand functions as related to their policies.  As they push the rates higher trying to front-run inflationary concerns, they don’t understand that many borrowers can’t sustain raising rates at this pace.  In the process, many borrowers will be pushed into foreclosure and possibly bankruptcy as the fed attempts to normalize rate levels.

As traders, our job is to find the opportunity that exists and to try to capitalize on price movements and from swings in valuations that occur throughout this game.  The US fed and global central banks will do what they do – we really don’t have any control over them or their decisions.  As traders, our job is to be ahead of these central banks and take advantage of the opportunities they provide to us.

We likely still have many months of preparation to further understand and develop our strategies for these future moves.  We invite you to visit www.TheTechnicalTraders.com to learn what we do and why we believe we offer the best research and analysis available to traders.  We are in the trenches just like you are.  We live and breath this stuff and we use our advanced skills and technology to try to keep our members aware of what is going to happen days and weeks in advance.  Please review some of our most recent research report to see how accurate we are.

Our articles, Technical Trading Mastery book, and 3 Hour Trading Video Course are designed for both traders and investors to explore the tools and techniques that discretionary and algorithmic traders need to profit in today’s competitive markets. Created with the serious trader and investor in mind – whether beginner or professional – our approach will put you on the path to win. Understanding market structure, trend identification, cycle analysis, volatility, volume, when and when to trade, position management, and how to put it all together so that you have a winning edge.

We invite you to join our other members in preparing for and profiting from the opportunities the markets generate.  Our most recent trades are already performing quite well – hope to see you in the member’s area.

BECOME A TECHNICAL TRADER OR PROFIT FROM OUR ANALYSIS AND TRADES!
JOIN US TODAY!