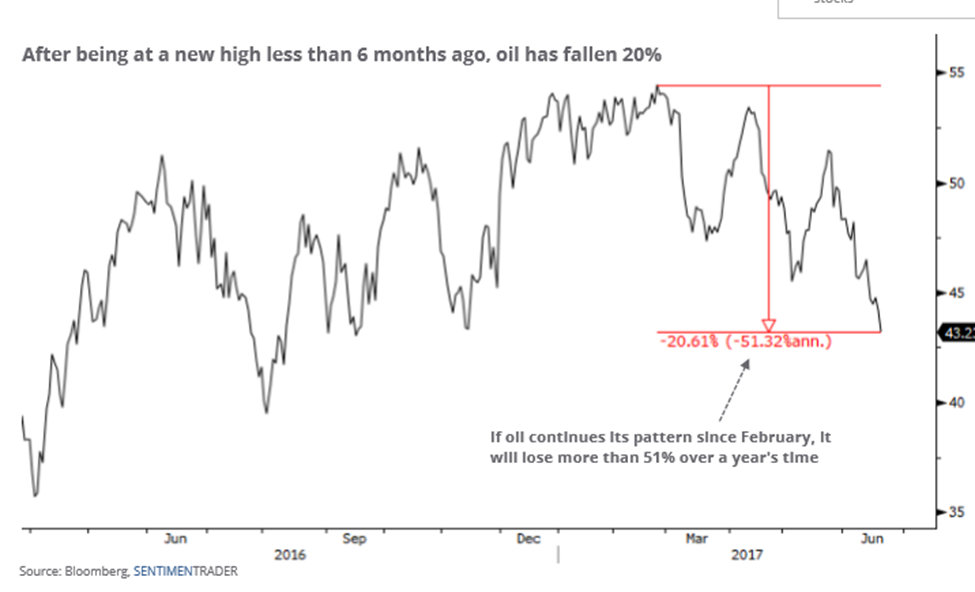
The newest bear market is in crude oil. The definition of a bear market is when an ‘asset class’ is down more than 20% from its recent high: (Bear Market Rally Definition Investopedia). It has been more than five years since the market fell so hard so fast from its’ high. Two months later, it was even lower. During the past 20 years, the SPX has struggled when oil fell into a bear market!
Oil prices broke to a fresh seven-month low on June 21st, 2017, with WTI Crude Oil dropping to $42 per barrel. The renewed and heightened pessimism over the pace of rebalancing has sunk in as O.P.E.C., is struggling to reduce its’ inventory. U.S. shale continues to grow production. There are large volumes of supply back in the market at the worst possible time!
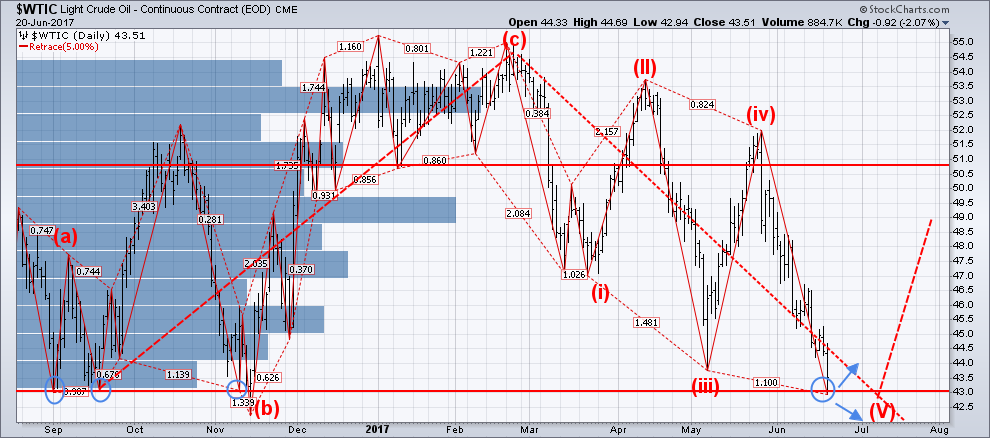
WTI Crude Oil Now Technically Bearish
Most oil companies are now adjusting to “lower for longer.”
The Wall Street Journal reports that “most in the oil industry are resigned to low prices for years to come, recognizing that a range of $50 to $60 might be a semi-permanent equilibrium.”
Between 2014 and 2015, 105 oil producers and 120 oilfield service companies went through bankruptcy.
Conclusion:
In short, these extreme price movements and key support levels can provide some fantastic opportunities to trade oil like my last trade in SCO for a 21% move a couple weeks ago. If you want to get involved in the next oil ETF trade subscribe here: www.TheGoldAndOilGuy.com
Chris Vermeulen
https://thegoldandoilguy.com/wp-content/uploads/2014/06/oilwti.png179273adminhttp://www.thegoldandoilguy.com/wp-content/uploads/2014/11/tgaoglogo.pngadmin2017-06-26 09:47:382017-06-26 09:49:41Crude Oil In A New Bear Market?
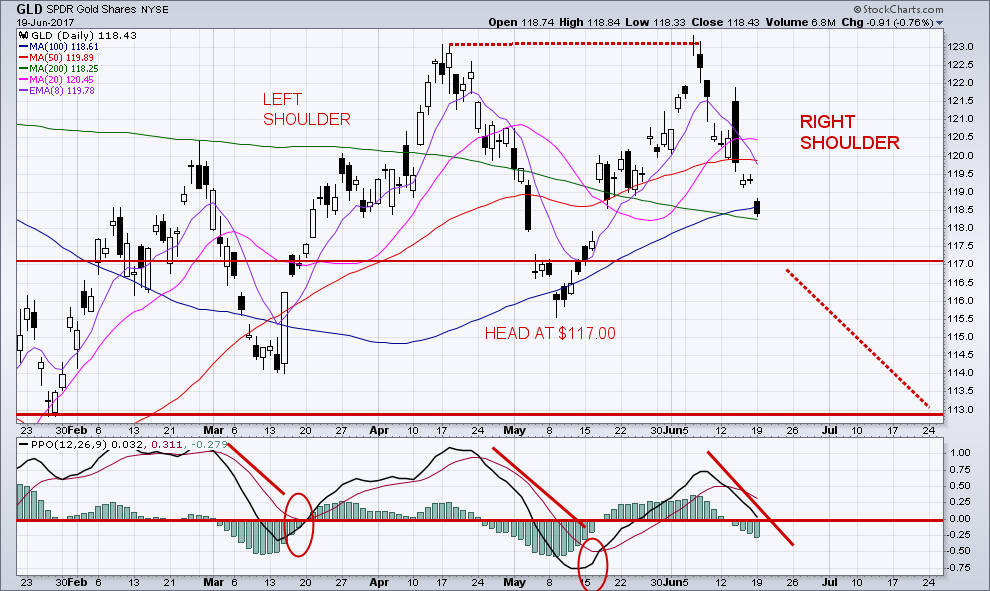
The dollar gained strength, after the FED raised rates by 25 basis points raised interest rates as expected from 1% to 1.25% last Wednesday, June 14h, 2017. This, in turn, dragged gold prices sharply lower. Gold is locked in a seasonally-low time of the year.
Don’t Ignore Technical Analysis If You Are Trading GOLD!
GLD continues to drop in its bearish pattern. The current Head and Shoulders pattern on GLD suggests a critical test of support at $117.00 A break below $116 could likely indicate a further decline to the $110 area.
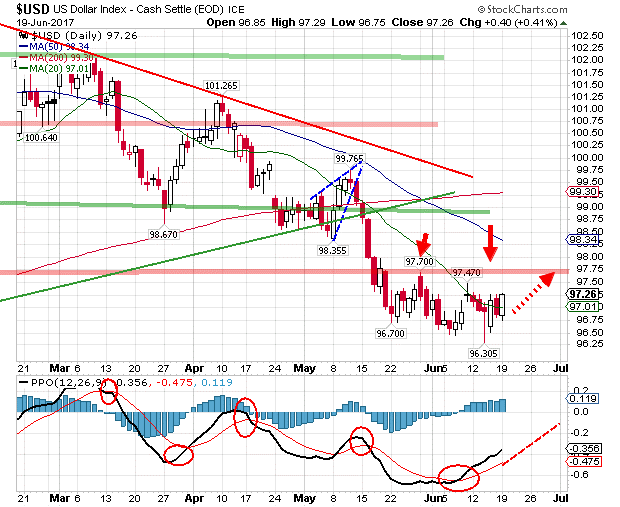
Dollar firms!
The dollar gained strength after the FED increased the policy rate by 25 basis points. The FED also announced its plan to begin trimming its balance sheet this year.
This move was broadly expected by the market, the dollar index fell initially after the outcome of the FED meeting. The index fell to a low of 96.31 on Wednesday, June 14th, 2017, but recovered sharply from that point.
Immediate support for the dollar index is in the 97-96.9 region, which could limit the downside in the near term. A break below 96.9 looks less probable. A from this support may see the dollar index moving higher to 97.50 levels. A further break above 97.50 can take it higher to 97.85 or 98. This potential rise in the dollar index may continue to keep gold prices under pressure. There is the possibility of gold prices falling further in the coming weeks ahead.
If the dollar index fails to break above 98, a pull-back move to 97.5 or 97 is possible once again. The index can remain range-bound between 96.45 and 98 for some more time. A breakout on either side of 96.45 or 98 will determine the next trend.
Targets above 98 are 98.6 and 99.2. On the other hand, 96 and 95 are the levels that can be targeted if the dollar index declines below 96.45.
Conclusion:
In short, we should continue to expect a stronger dollar and weaker gold for the next 2-4 weeks. When the time comes, plan to load up on metals and miners…
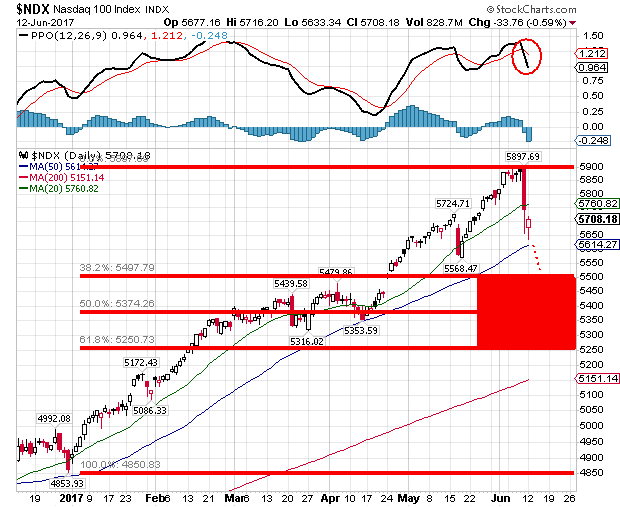
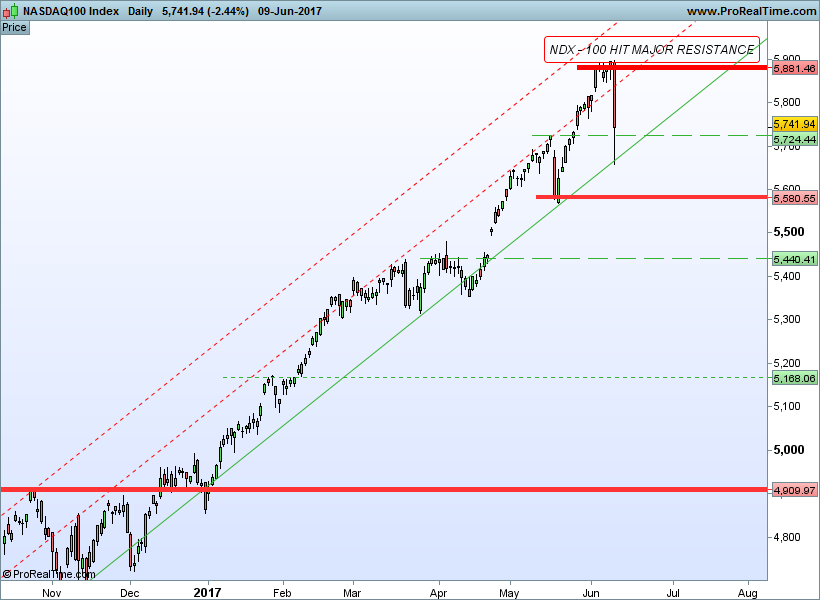
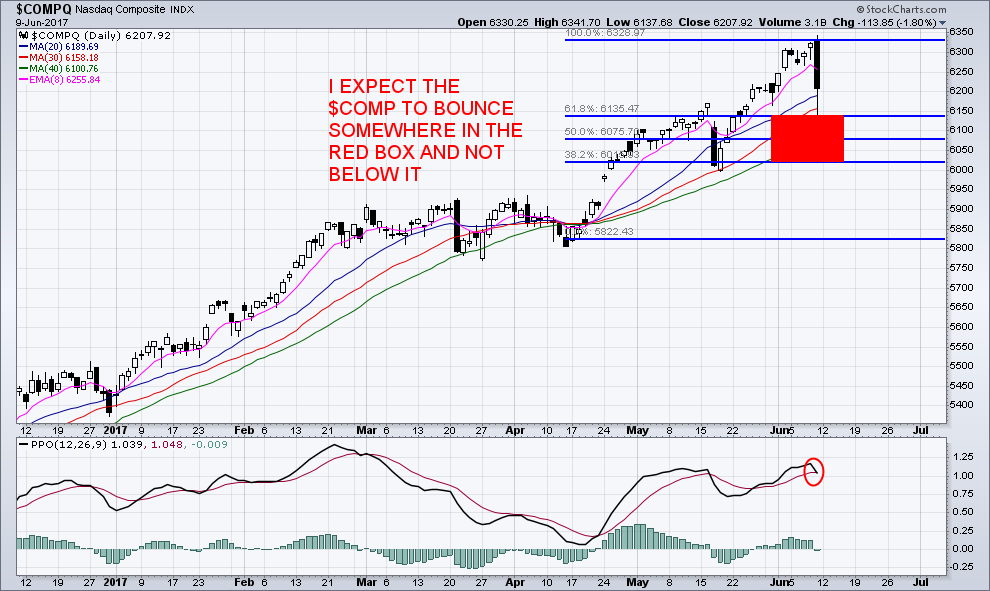
Last Friday’s, June 9th, 2017, decline of the tech sector continued into Monday, June 12th, 2017. I expect the NDX to test the range, as illustrated within the red box in the below chart, before continuing higher, but not closing below the red box.
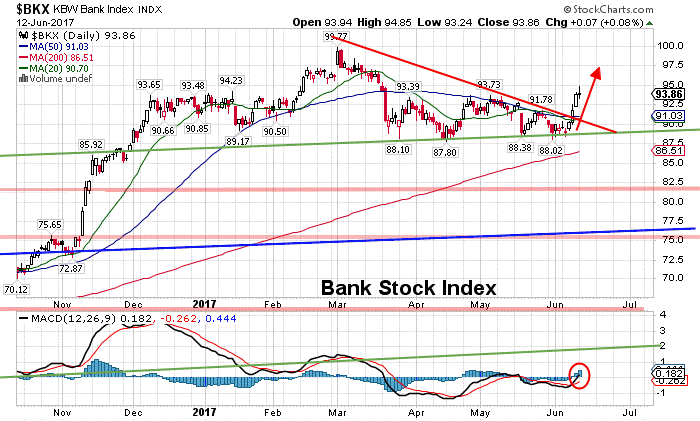
The banking stocks were among the beneficiaries of the tech slump, with BAC, GS and JPM all defying their head and shoulders break-down setups.
The volume in the QQQ fund has been excessive. Last Friday, June 9th, 2017, it was 8 standard deviations above its’ normal average volume. On Monday, June 12th, 2017, it was more than 6 standard deviations above its’ normal average volume. It set a new record since back in 1999.
Goldman Sachs sent a memo out to its’ clients late last week. Goldman worries that the boom has created an “valuation air-pocket,” similar to the ridiculously high valuations for tech stocks during the Dot-Com boom.”
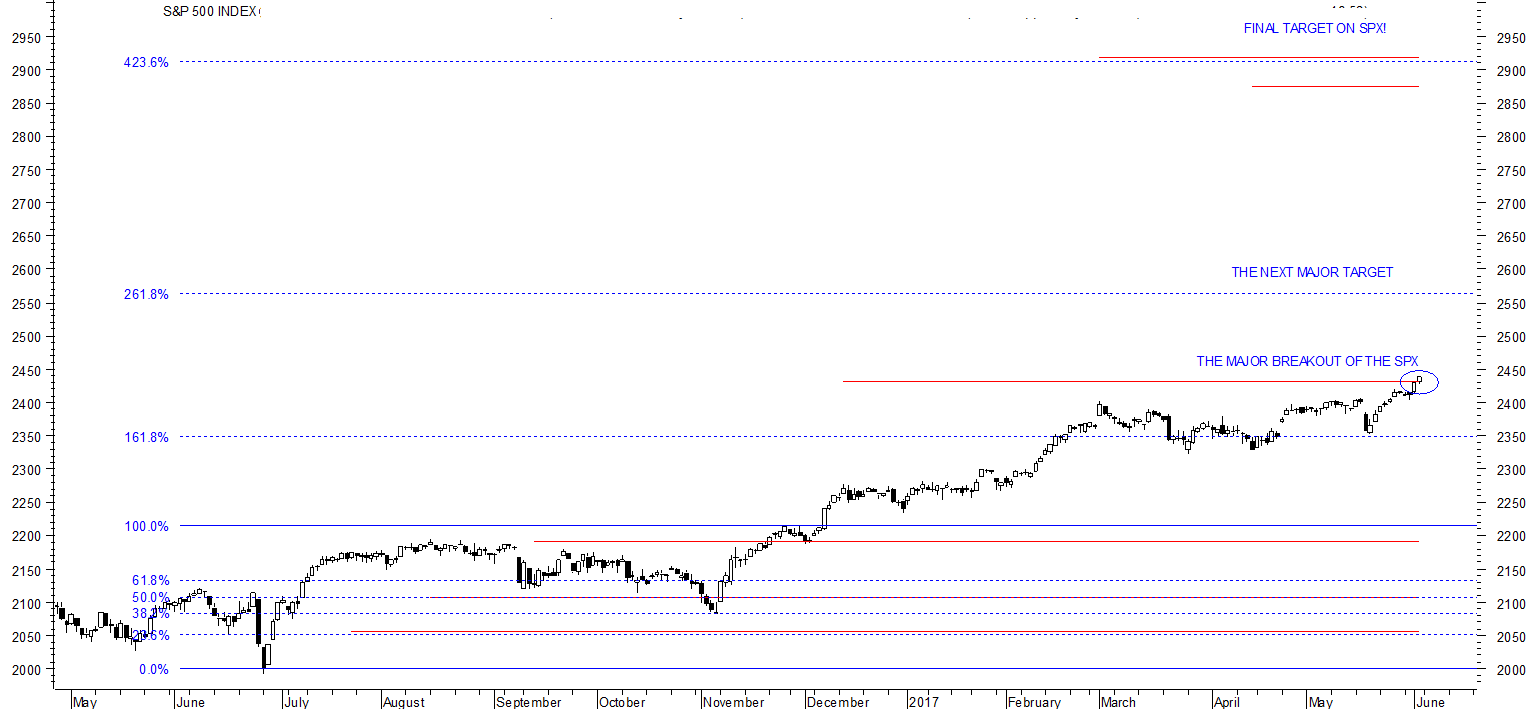
The SPX Trade!
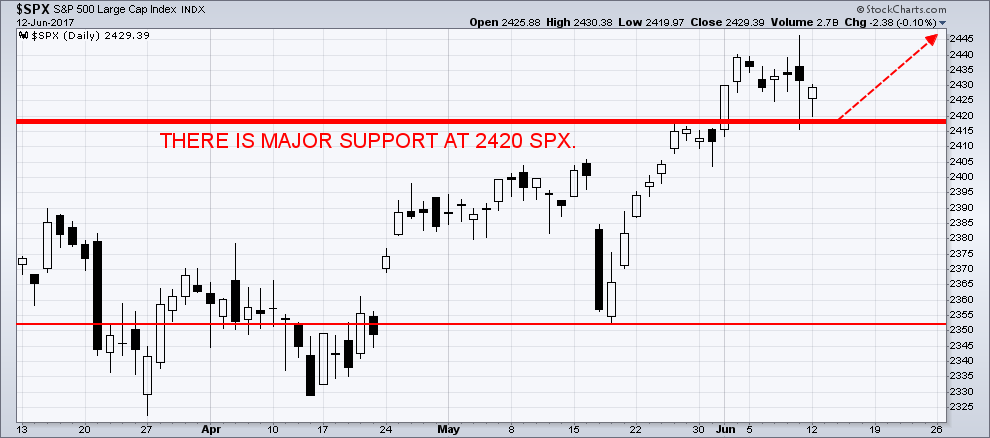
The market is in a very bullish posture if we remain over 2420 in the SPX. There is NO market crash in sight. Tune in every morning for my video analysis and market forecasts at TheGoldAndOilGuy.com to know where the main ‘asset classes’ Gold, Oil and SP500 are headed tomorrow, this week and next month. This daily forecast service closed out an oil trade in SCO on June 8th for a quick 21% profit!
As this bullish pattern continues to rise throughout the summer, we should then prepare for the next correction in the SPX. This next pullback can take us from the 2500 – 2550 SPX region and potentially back down towards the 2300 SPX. The next buying opportunity should occur in the fall of 2017, approximately sometime during the Thanksgiving Day holiday.
How A ‘Market Crash’ Stops:
‘Circuit breakers’!
Stock exchanges attempt to ease ‘panic selling’ by taking certain steps to halt trading. These moves are called ‘market circuitbreakers’.
The purpose is to prevent a market or stock price ‘free-fall’ by trying to rebalance buy and sell orders. ‘Circuit breakers’ halt trading on the nation’s stock markets during dramatic drops and are set at 7%, 13% and 20% of the closing price for the previous day. The ‘circuit breakers’ are calculated daily.
Level 1 halt (7%):
Trading will halt for 15 minutes if the drop occurs before 3:25 p.m. (ET)
At or after 3:25 p.m. (ET) — trading shall continue, unless there is a Level 3 halt.
Level 2 halt (13%):
Trading will halt for 15 minutes if the drop occurs before 3:25 p.m. (ET)
At or after 3:25 p.m. (ET) —trading shall continue, unless there is a Level 3 halt.
Level 3 halt (20%):
At any time during the trading day—trading shall halt for the remainder of the trading day.
The De-regulation of ‘RED TAPE’ in the Financial Industry Will Place the Markets at a Greater Risk!
The Trump Administration hopes that by unshackling businesses from all the ‘RED TAPE’ regulations, renegotiating trade deals and by cutting tax rates, that this will help the economy to grow faster. The administration hopes that these changes will create new jobs.
Last Thursday, June 8th, 2017, The House of Representatives (http://www.house.gov/) approved legislation to erase the core financial regulations implemented in the Dodd-Frank Act of 2010. Republicans moved a step closer to delivering on their promises to eliminate rules that have been perceived as strangling small businesses and stagnating the economy. The non-partisan Congressional Budget Office estimated that the bill would reduce federal deficits by $24.1 billion over the next decade.
This bill will reverse most of the protections put in place since “The Great Financial Crisis Of 2017”.
The Choice Act would exempt some financial institutions which meet capital and liquidity requirements from many of Dodd-Frank’s requirements that limit risk taking. It would also replace Dodd-Frank’s method of dealing with large and failing financial institutions. This is known as the orderly liquidation authority — which critics say reinforces the idea that some banks are too big to fail — with a new bankruptcy code provision.
This new legislation would weaken the powers of the Consumer Financial Protection Bureau. The bill would also eliminate the Labor Department’s fiduciary rule which requires brokers to act in the best interest of their clients when providing investment advice about retirement.
TRADES IN MAY:
FOLD, up 18% in 6 Weeks
TNA, up 5.9% in 11 Days
ERY, up 4.75% in 2 Days
SLV, up 3.2% in 5 Days
MOBL, up 15% in 7 Days
FOLD, up 9.5% in 40 Days
NUGT, up 81% in 27 Days
UGAZ, up 74% in 14 Days
https://thegoldandoilguy.com/wp-content/uploads/2016/01/charts.jpg300580adminhttp://www.thegoldandoilguy.com/wp-content/uploads/2014/11/tgaoglogo.pngadmin2017-06-17 09:55:092017-06-17 09:55:09Rotation out of the tech and into financial
Last Friday June 9th, 2017, Robert Bouroujerdi, a Goldman Sachs analyst, “warned that the $600 billion outperformance by the 5 biggest tech stocks known as ‘FAAMG’ — Facebook, Amazon, Apple, Microsoft and Alphabet — had contributed about 42 percent of all stock market gains over the last year. Goldman worries that the boom has created an “valuation air-pocket,” similar to the ridiculously high valuations for tech stocks during the Dot-Com boom.”
Goldman Sachs comments “market’s over-reliance on FAAMG for growth and appreciation has created positioning extremes, factor crowding and difficult-to-decipher risk narratives.”
Almost like the Dot-Com bubble, investors are piling into the tech stocks with the belief that these companies will continue to generate billions in revenues and branch out into other enterprises to drive innovation and growth. I talked about this two weeks ago; “The Fourth Industrial Revolution, which will be referred to as: Tech Hypergrowth”
The QQQ’s were trading at $140.15 per share last Friday, June 9th, 2017, but by afternoon, they were down $3.42 (-2.38%). Year-to-date, the QQQ’s have gained 18.29% versus an 8.75% rise in the SPX index during the same period. The heavy losses were focused and contained. It was an orderly coordinated profit taking day!
There was a sector rotation in The Dow Industrials which closed at a new high. Prior to the past year, the last two times that the Dow Jones closed at a high, while the Nasdaq sold off hard, was back in 1999 and 2007.
The Tech sector has been driving the general market yet higher since November of 2016. I keep scanning the horizons in every direction and I just cannot see anything that would trigger more than a minor correction day. Of course, a minor correction could deliver outsized impacts, given the heavy weighting of a few stocks. as well, as passive index investing.
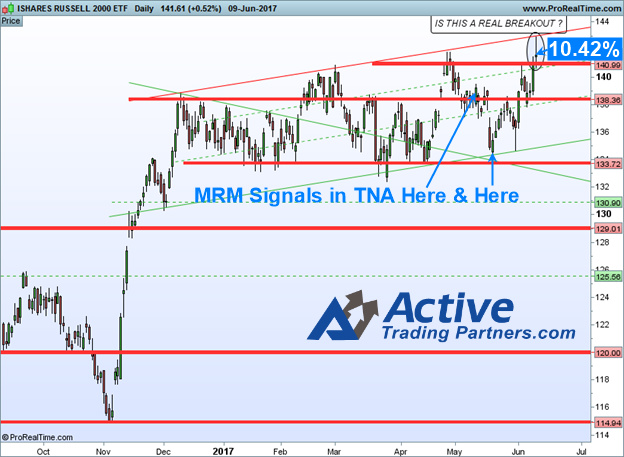
Are the Financials and The Small Caps Back?
Small Cap stocks, IWM, vaulted all the way up to $139, and it has had a strong follow through on Friday, June 9th, 2017, well above $140. That is a nearly 4% move from trough to peak since Wednesday June 7th, 2017, in a dramatic “V-shaped rally” in Small-Cap stocks.
The DOJI candlestick on the breakout is a sign of INDECISION! I am currently waiting for a re-test of 138.50 before entering this trade. According to decades of studying historical seasonal chart patterns, the month of June almost always closes lower than its’ open. Its’ worst days are June 15th to June 18th. MRM Traders played TNA for the recent run-up in price.
In the SPY, impressive asset flows have hit SPY lately, topping more than $6 billion in this move higher in the past week.
Dr. Ed Yardeni discussed why:
“So far, the current bull market has marched impressively forward despite 56 anxiety attacks, by my count. They were false alarms. I remain bullish. My long-held concern is that the bull market might end with a melt-up that sets the stage for a meltdown. The latest valuation and flow-of-funds data certainly suggest that the melt-up scenario may be imminent, or underway.” Article
In the aftermath of “The Great Financial Crisis of 2017”, Global Central Banks began to buy stocks and bonds and other financial assets in very large quantities and they continue to do so! It is estimated that they will continue to buy $3.6 trillion dollars during 2017. They continue to pump up the global stock markets. This is their response in correcting the forces of past excesses. Their financial engineering may be able to keep this bubble growing bigger and bigger for many years to come. They have reached a point of no return and have no plans to unwind balances sheets.
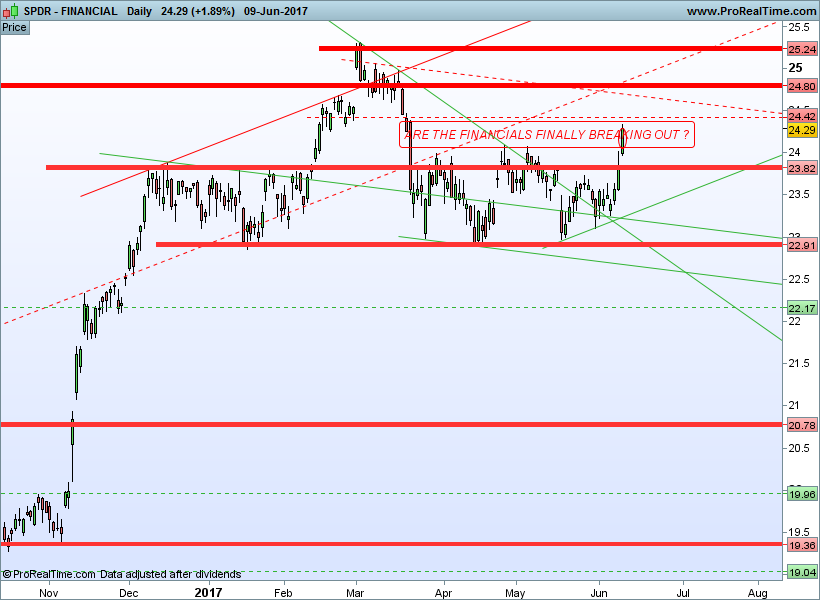
Will the Financials Lead the Market Higher?
The banking stocks were among the beneficiaries of the tech slump, with BAC, GS and JPM all defying their head and shoulders setups at this time. The XLF, is suggesting further near-term gains for the financial sector while heading into this coming week’s FOMC meetings on June 13th and June 14th, 2017.
Trade Your Way To Success!
On May 25th, 2017, I issued a trade alert, to my membership, a couple of hours before the opening bell!
If understanding why the markets move they way they do, and where they are headed tomorrow is something you want to know, become a member and have access to my premium pre-market video forecasts to have the necessary insights that you require to build your trading account!
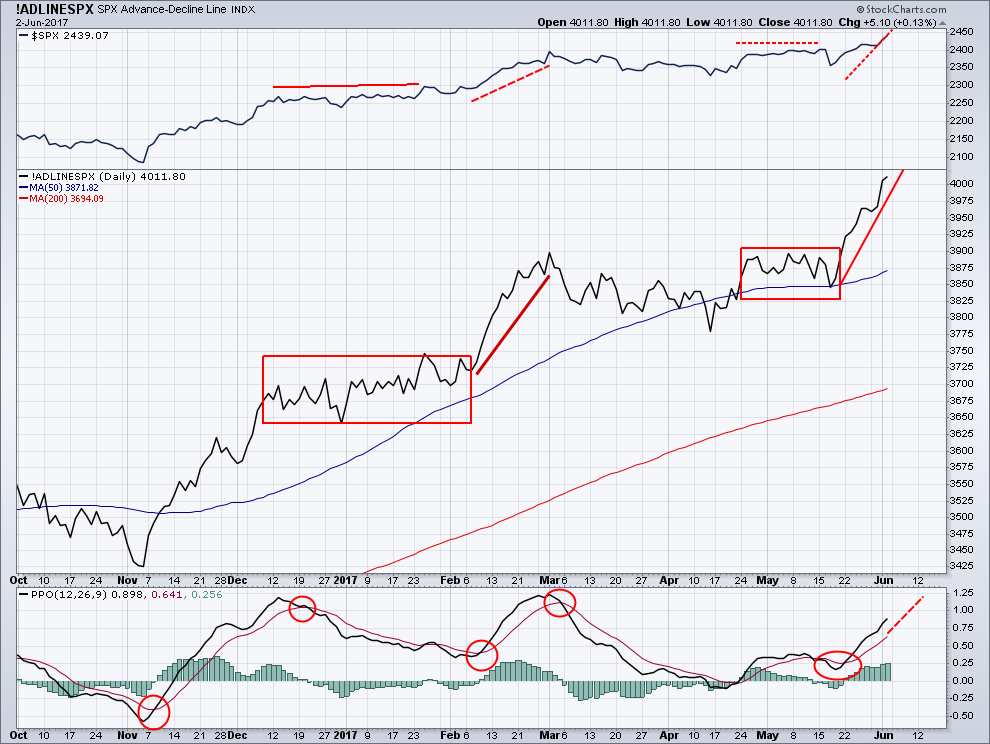
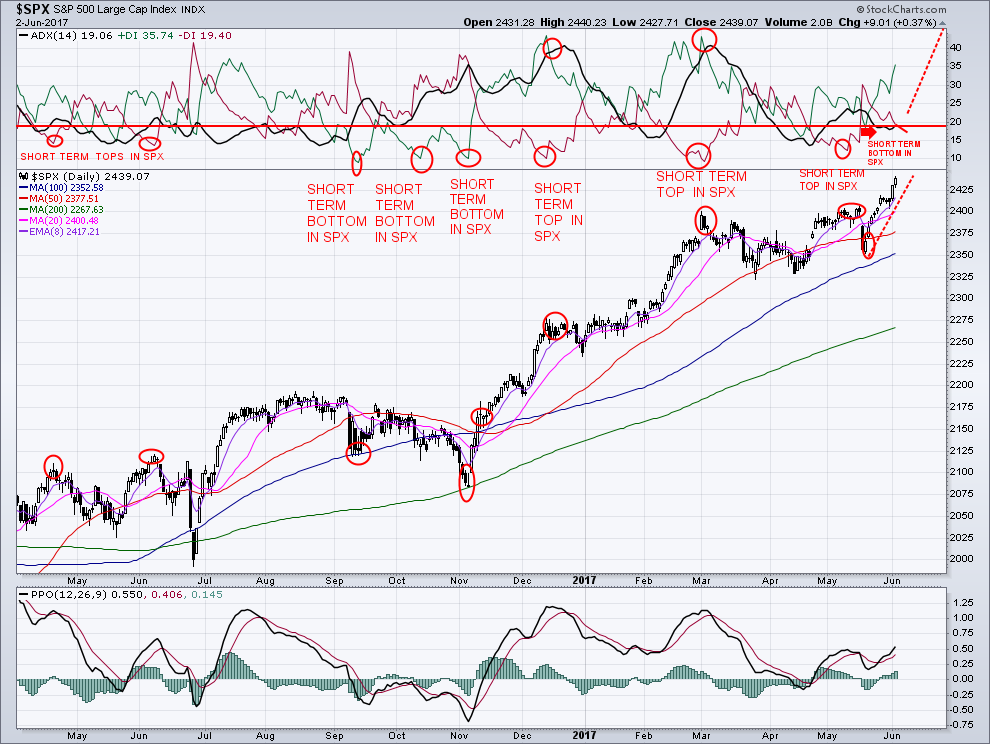
U.S. Stock Markets just keep going higher and higher! How much higher will they go? I am FORECASTING another 25% higher for U.S. Stocks! The ‘bullish trend’ from the breakout continues, as expected. Breadth has become strong, once again, including a new all-time high on the SPX Advance/Decline line to match the new all-time high for the SPX. My breath thrust index reissued another buy for the SPX on May 31st, 2017! Once the markets wake up and realize that there will be no U.S. tradewars, they will then begin their assent.
THE BIG PICTURE!
The Fourth Industrial Revolution, which will be referred to as ‘Tech Hypergrowth’, will be the enabling attribute of technology’s new central role within the global economy. Through technological innovation and investment, in developing infrastructures, companies are heading into an all new frontier.
Harnessing technology so as to realize undeveloped opportunities is a hallmark of ‘tech hypergrowth’. This approach leads to the now quite familiar phenomenon of innovation. Tech Hypergrowth Companies are employing both existing and recently developed infrastructures for growth. These new opportunities lie in ongoing and recent technology shifts, industry transformations and demographic and societal changes. Research indicates that ‘tech hypergrowth’ companies are highly data-driven and that data is enabled to adjust the fit between the technology, the business and its’ customers.
‘Emergency Stimulus’ Is Now Permanent!
Last Friday, June 2nd, 2017’s Jobs Report supported the number of new jobs that are now expected. If the economy continues to contract, the FED, in alliance with the Trump Administration, will increase their money printing which will, in turn, push gold higher. This explains why gold prices rallied in response to the disappointing jobs report. There is NO market crash on the horizon. In last weeks’ article, May 26th,2017, I wrote (that) “When short-term sentiment becomes pessimistic, it creates a new ENTRY SIGNAL to re-enter the SPX long!This is exactly what occurred on May 25th, 2017”. We still remain extremely bullish with a stop/loss at 2400. There is major support at the 2400 level. This level used to be strong resistance, then became major support in the May 2017 breakout.
Historically, the best sectors were dominated by staples, utilities and health care which had shown consistent positive returns.
Understanding correlations in complex financial systems is crucial in the face of turbulence, such as the continuing ongoing ‘financial crisis’. The strong breath and new highs support the advance of the SPX as it continues on its’ gains.
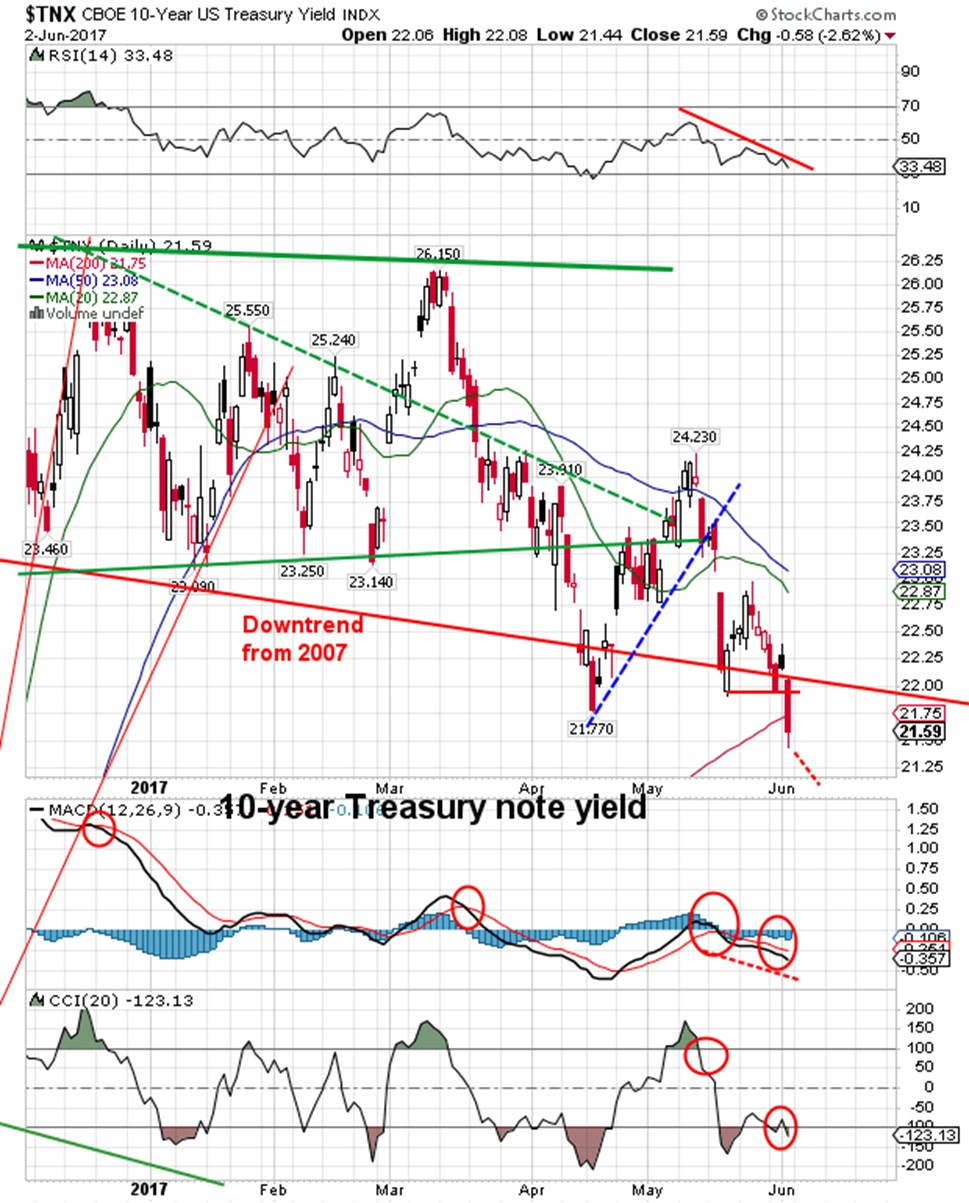
The New Bear Market Of Interest Rates!
In recent decades, this has led to a further decline in interest rates, almost every time, along with a rally in the more defensive sectors of the stock market.
Over the past 36 years, the ten-year Treasury Note Yield has preceded a new downtrend in interest rates, virtually every time,when they have reached major support. Yields dropped an average of a 11% over the following year and declined 9 out of 11 times.
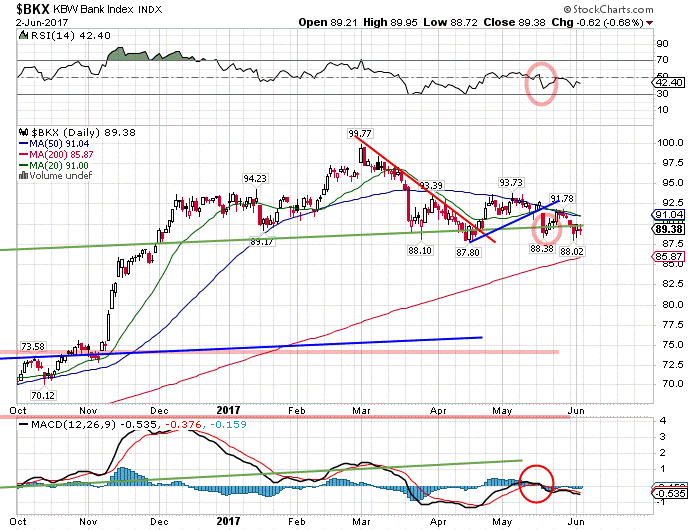
As interest rates continue to decline, it is great for bond funds, but not good for banks. The SPX Banks SPDR, (KBE) is near its’ 2017 low as depicted in the chart below.
The U.S. dollar index closed last week at a new low for the move at 96.67, down 47 basis points on Friday, June 2nd, 2017 (0.48%). The dollars’ trouble came when the government jobs report announced only 138,000 new jobs were created last month! This fell short of economist’s expectations and lower than that of April of 2017. Dropping yields are a driver of currency exchange rates and forecast future lower interest rates.
The U.S. dollar clearly took a hit from the May jobs report with expectations of the FED raising U.S. interest rates beyond June. From a technical standpoint, the Dollar Index is bearish on the daily charts. With the lack of confidence that the FED will NOT take any action beyond June, has pushed the dollar further into a new bear market territory but price is nearing critical support and I do feel a short term bounce in dollar is near.
The Decoupling Of Correlated Asset Classes!
In financial systems, correlations are not constant, all the time, but rather, vary over time. Reliable estimates of correlations are necessary to protect a portfolio. I find that the result that the correlation among different ‘asset classes’ scales ‘linearly decouple’ with market stress.
Consequently, the diversification effect, which should protect, melts away in our current financial times. If my empirical analysis is consistent with the interesting possibility that one could anticipate diversification breakdowns.
In our very leveraged financial markets, the ‘leverage effect’ can decouple the traditional relationships correlation between the asset classes.
It is crucial to understand the fundamentals of the capital processes that are currently in play! President Trump is preparing for a major shake-up at the FED. There are three vacancies coming up at the FED’s Board of Governors. President Trump is preparing for a series of new appointments to the FED. He is considering a former Federal Reserve Economist, who advocates the implementation of negative interest rates. The administration has been saying that it plans to deregulate the old rules that were imposed on Wall Street in the aftermath of “The Great Financial Crash of 2007”.
In January 2018, the term of FED Chairwoman Janet Yellen will expire! The president is undecided whether he will reappoint her or seek a new appointee for this position.
In my opinion, President Trump wants a weaker dollar which in return boast profits in U.S. corporation.
The Anatomy of a Winning Trade!
Tune in every morning for my video analysis and market forecasts at TheGoldAndOilGuy.com to know where the main ‘asset classes’ Gold, Oil and SP500 are headed tomorrow, this week and next month. This daily forecast service closed out an oil trade in SCO June 8th for a quick 21% profit!
Short-term aggressive traders may want to look at my premium newsletter ATP in which we alert our clients to weekly opportunities in small cap stocks and attempt to keep our members aware of new trade setups by using our proprietary (MRM) Momentum Reversal Method trading strategy, which just locked in $590 in TNA, and another $1800 from FOLD on June 6th.
TRADES IN MAY:
FOLD, up 18% in 6 Weeks
TNA, up 5.9% in 11 Days
ERY, up 4.75% in 2 Days
SLV, up 3.2% in 5 Days
MOBL, up 15% in 7 Days
FOLD, up 9.5% in 40 Days
NUGT, up 81% in 27 Days
UGAZ, up 74% in 14 Days
https://thegoldandoilguy.com/wp-content/uploads/2017/06/83.png744990adminhttp://www.thegoldandoilguy.com/wp-content/uploads/2014/11/tgaoglogo.pngadmin2017-06-08 10:38:202017-06-08 12:37:12U.S.Bond and Small Cap Stock Soaring Together?