I cannot stress strongly enough the importance of understanding where the markets are currently technically located, with regards to different time frames and which help to guide all my trading and investing decisions.

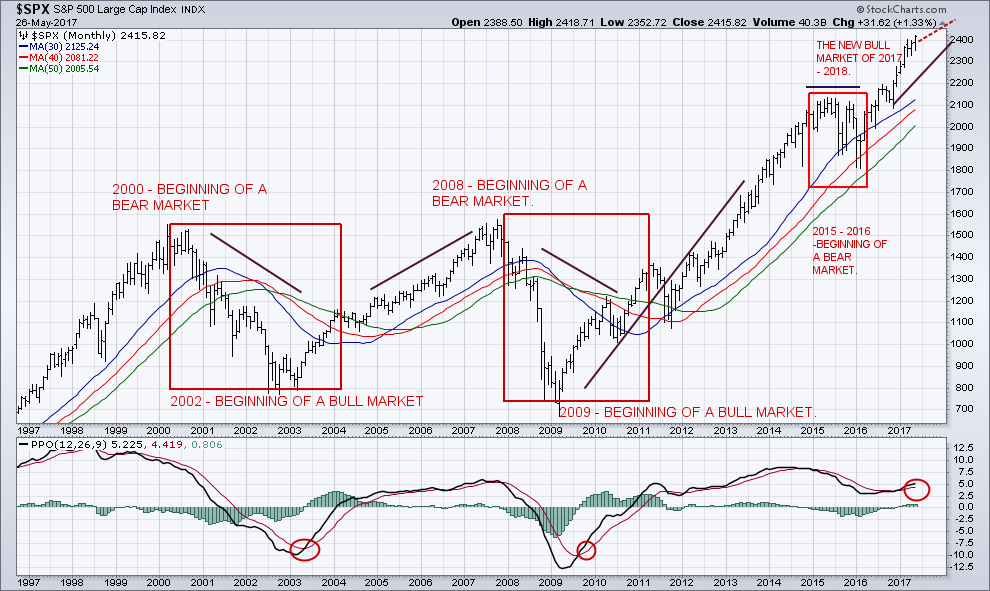
The longer that the SPX is inside a ‘consolidation pattern’ and going sideways, the bigger the ‘Break Out’. There is a very strong bullish posture on all time frames within the markets. A unique ‘Sentiment Indicator’ has now been reset from being overbought to oversold, therefore, there is huge potential to the upside. Momentum has been reset!  In my market article review, from last February 28th, 2017, I discussed that the “Stealth ‘Bull Market’ In Stocks Is Still In Progress!”.

nb1

Additionally, I also wrote about how “Elliott’s theory is based on the Dow theory in that stock prices move in waves. Because of the “fractal” nature of markets, I have broken them down so that you can trade a daily complete wave count”.

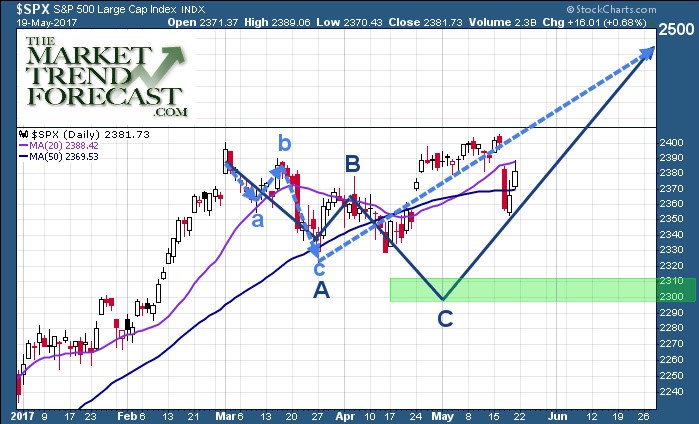
The below chart was originally posted in April of 2017 with the potential price paths for the SPX to reach the next price target of 2500. The overall forecast points to higher prices this summer with the potential of a major top forming in late July or August.

nb2

Courtesy of  TMTF website.


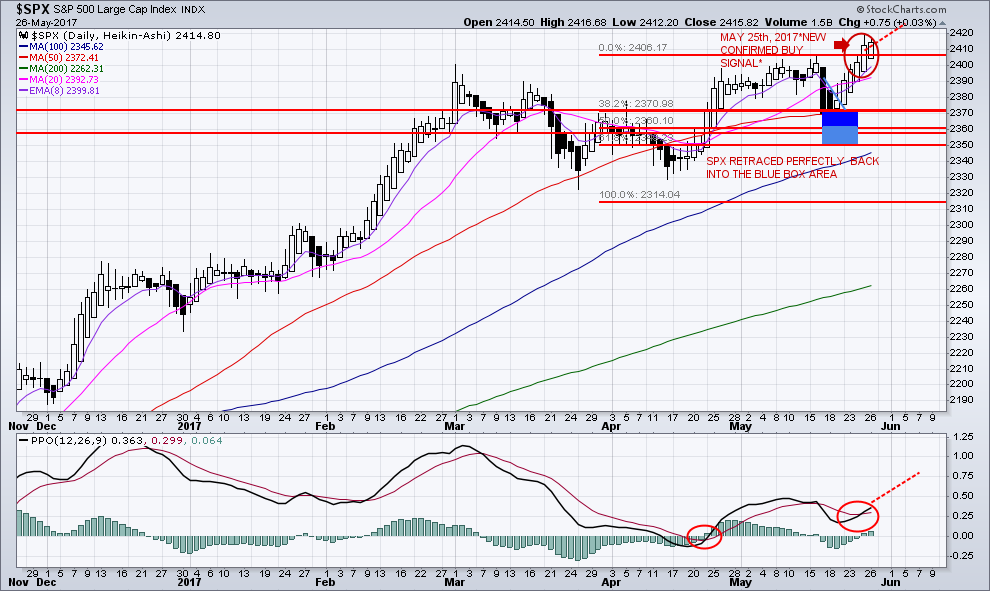
A close above 2424, of the SPX, would trigger a NEW ENTRY POINT, as well as indicating the continuation to the SPX 2500 level. The next potential target is 2430.

 nb3

Have The Markets Changed?

The “FAANGS” describe five major stocks in the index: Facebook, Apple, Amazon, Netflix, and Google. The “FAANGS” could create a huge ‘Melt Up’ in our current stock market environment! The “FAANGS” and other large technology stocks will send the SPX much higher.

The U.S.-listed ETFs had inflows of $7.8 billion during the week ending Thursday, May 25th, 2017.  The year-to-date inflows are $188.6 billion.

These five stocks (FAANGS) represent 9.25% of the SPX index. They also represent 31.45% of the NDX – 100.


Stocks Have a Long Way To Go!

The Bank of Japan (BOJ) and the European Central Bank (ECB) are sending the SPX to even newer highs. Easy money policies, and provide cash to invest into the markets, while adding more liquidity.

Therefore, we are in a “risk on” environment.  This is fueling the ‘market bubble’ and will continue for some time yet.  The markets have been resilient as traders “buy the dips”!

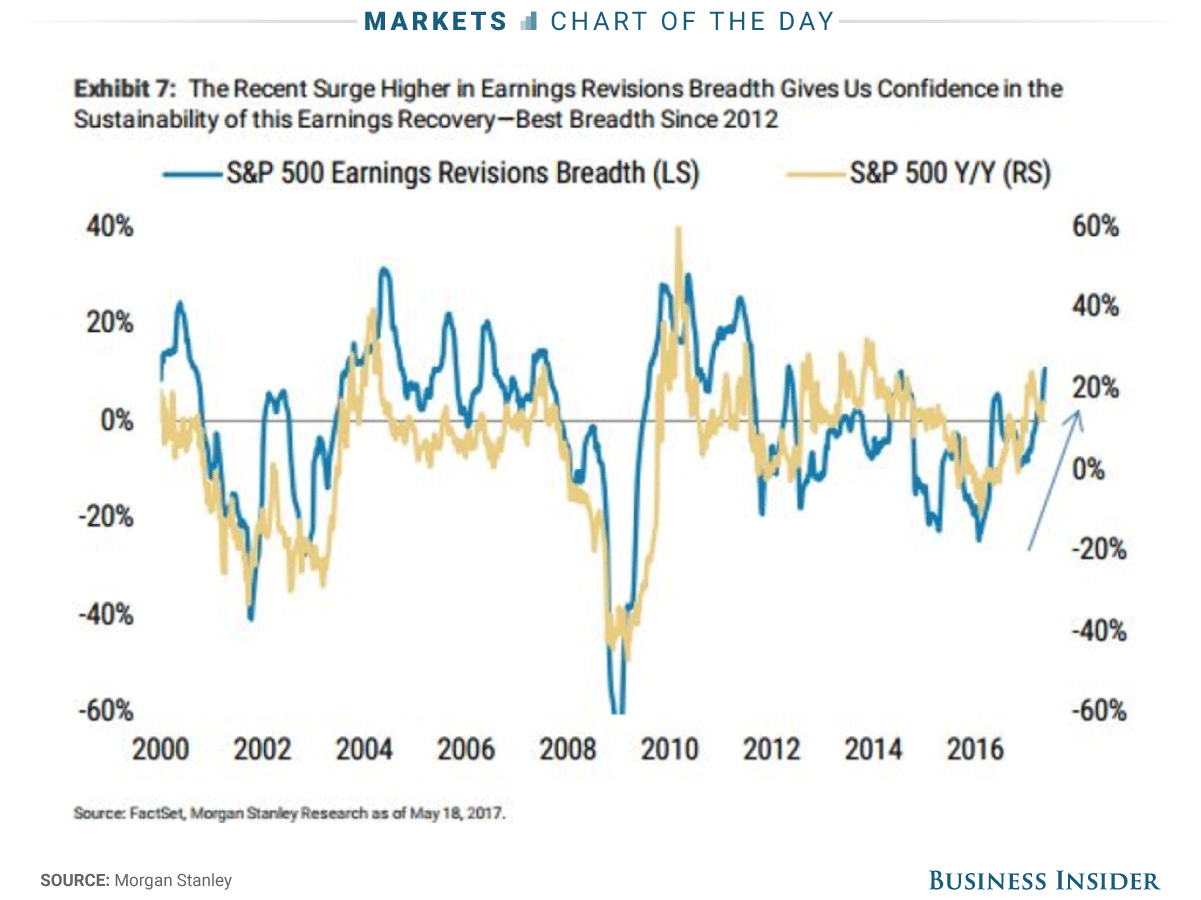
Analysts at Morgan Stanley believe that “profit expansion within the S&P 500 is growing at its best rate in nearly six years. Specifically, ratio of companies raising internal earnings estimates versus those lowering future earnings expectations is reaching its highest level since 2012”.

Michael J. Wilson, Morgan Stanley Equity Strategist, wrote in a client note, “The momentum of earnings revisions breadth like that seen recently is often synonymous with higher equity prices over a 12-month horizon.”

nb4


Intermarket Analysis:

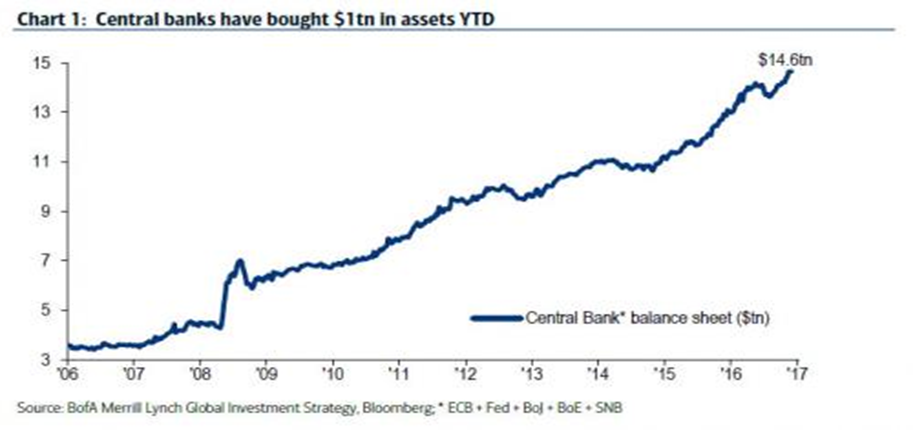
Global Central Banks have injected a record $1 trillion in 2017… they will be required to continue to inject more as the year progresses.

nb5

The current focus is on the fundamental key drivers that move the market. The current drivers are Trumponomics, the FED rate hikes, Quantitative Easing and ZIRP.

‘Correlation’ is when you look at one market and it can forecast another markets’ behavior.  For example, if the USD turns higher, it is likely that commodity prices will soon begin to fall. If commodities do not drop right away, they have diverged from their natural relationship and we can expect them to start to fall soon.

Correlations offer useful information for traders.  Linear correlation analysis presupposes the effects which are linear in nature in a one-to-one causal relationship. The correlation of any two markets can range between +1.0 (the price behavior of the two markets is the same) and -1.0 (the price behavior of the two markets is exactly the opposite of one another).

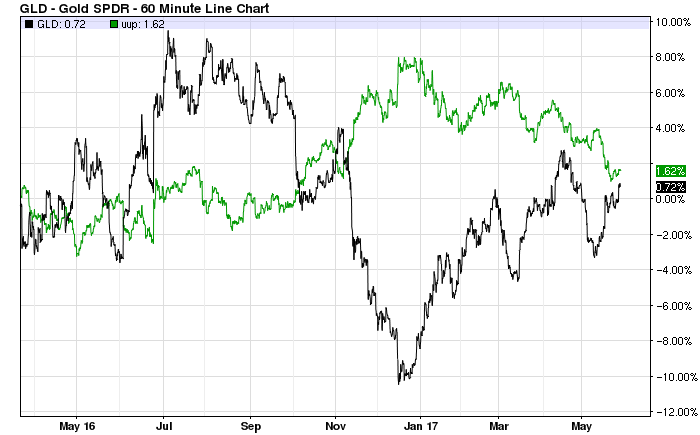
The historical correlation between GLD and the U.S. dollar has been -0.59.

nb6


IS GOLD DUE FOR A BREAKOUT?

Gold is the ultimate hedge for setbacks in the Trump agenda.  If the administration fails to get its’ agenda enacted, gold prices will likely move higher.

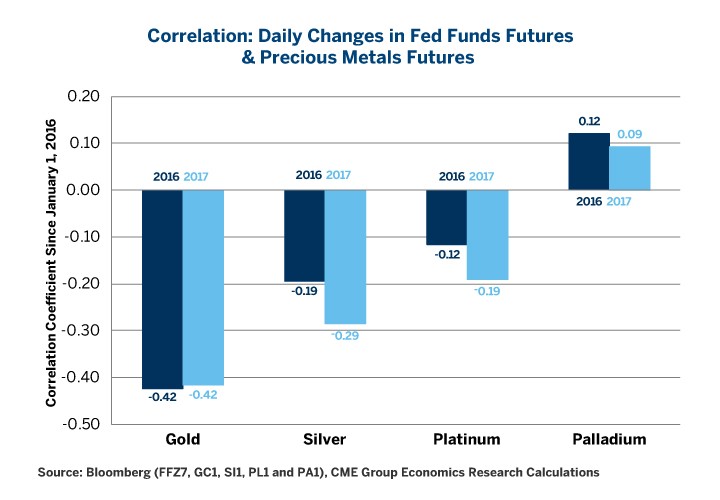
Gold is the most (negatively) sensitive precious metal to react to changes in the Federal Funds Futures.

nb7

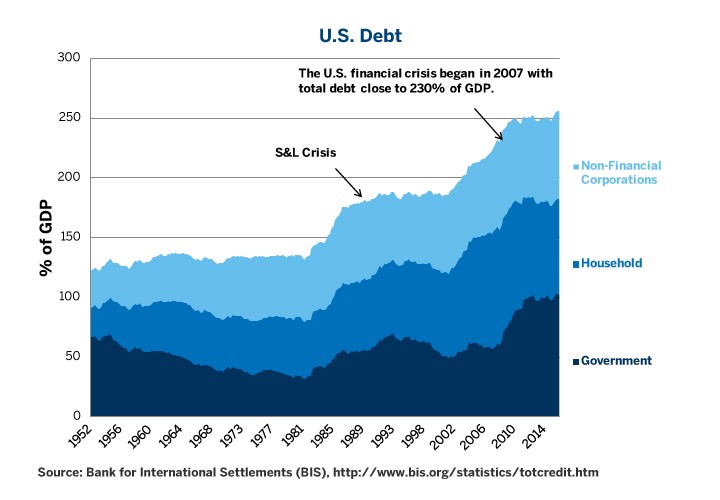
The FED cannot raise rates, aggressively, without harming the U.S. economy: U.S. debt levels remain ‘astronomically high’. There has been no deleveraging since the Great Financial Crisis of 2007/ 2008.

Total U.S. debt remains above 250% of GDP.  This explains, better than any other factor, why the Federal Funds target rate is still below 1%.

 nb8


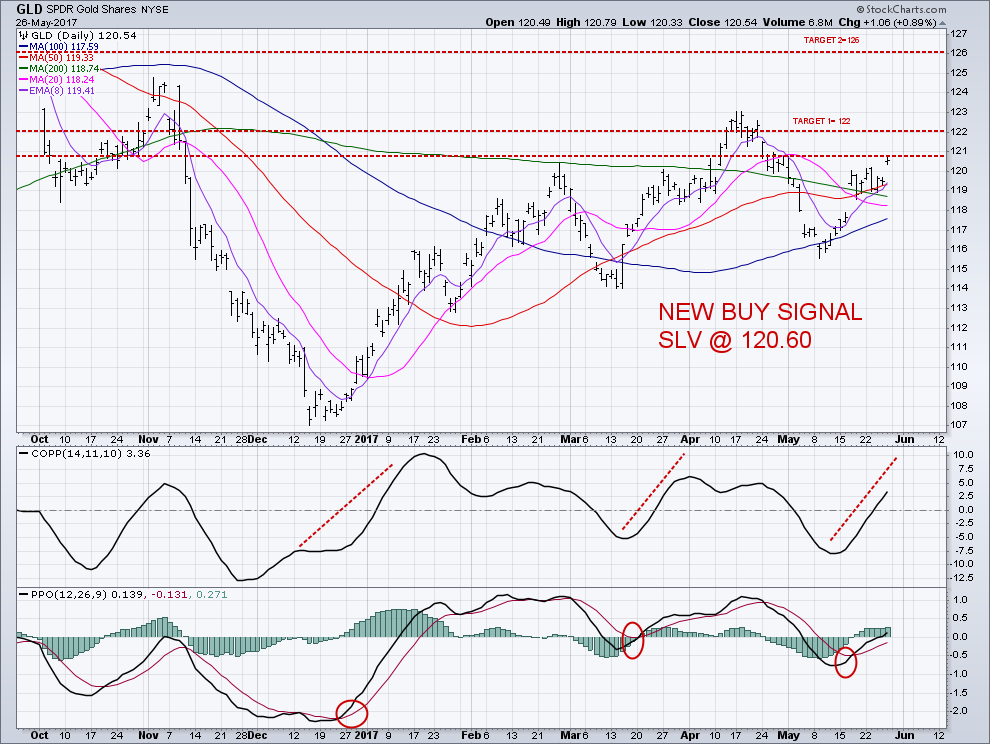
GLD broke through an important resistance level and remains above all key moving averages. GLD out-performed other safe havens last week.

A close above GLD 120.60 would indicate a great swing trade to GLD 122 and then GLD 126.  This would also reflect the continuation of the bearish move on the U.S. dollar to the 94 and 95 levels.

 nb9


In Conclusion:

Tune in every morning for my video analysis and market forecasts at TheGoldAndOilGuy.com to now where the main ‘asset classes’ are headed tomorrow, this week, and next month.

Short-term aggressive traders may want to look at our premium newsletter ATP where we alert our clients to weekly opportunities and attempt to keep our members aware of new trade setups using our proprietary Momentum Reversal Method trading system.

TRADES IN MAY:

ERY 4.75%, in 2 Days

SLV 3.2%, in 6 Days

MOBL 15%, in 7 Days

FOLD 9.5% in 40 Days


If you want to take FULL Advantage of All Our insight and expertise tune in every morning for BOTH our daily market forecasts video and our Stock & ETF Trade Alerts services now!

This week will be most interesting in the markets. It is vital that you understand what the markets are telling you. Attempting to trade stocks, bonds, commodities, and the currency markets, without intermarket awareness, can be very costly.

Chris Vermeulen
TheTechnicalTraders.com

The SPX hit new highs and will see even higher highs! Goldman Sachs, is the latest bank to publish research, to justify the current high prices of the market and its year-end SPX price target. Goldman argues that the index can head higher to 2580 in this bull market trend.

The current rally continues to climb without a quantifiable pullback!

My proprietary technical model has now confirmed a NEW BUY SIGNAL on the SPX!  This is a new signal informing us of the continuation of this rally.  President Trump’s pro-business policies, along with soaring business and consumer optimism, is jet fuel for this bull market to continue even higher.

The correction is OVER and the next leg of this bull market will take the SPX to 2500+.  The bears will be left with nothing, except huge losses. The call and put buying action that is reflected from the CBOE shows that the leveraged money is now on the long side of these equity markets.

In my research report that I released back on April 18th, 2017, I stated that “On a short -term basis, we are at that point where sentiment is overly ‘pessimistic’. Seasonality is turning positive and any further selling should be erased by the time when everyone pays Uncle Sam. When short-term sentiment becomes pessimistic, it creates a new BUY SIGNAL to re-enter the SPX long!”.  This is exactly what occurred on May 25th, 2017.


Margin Debt:

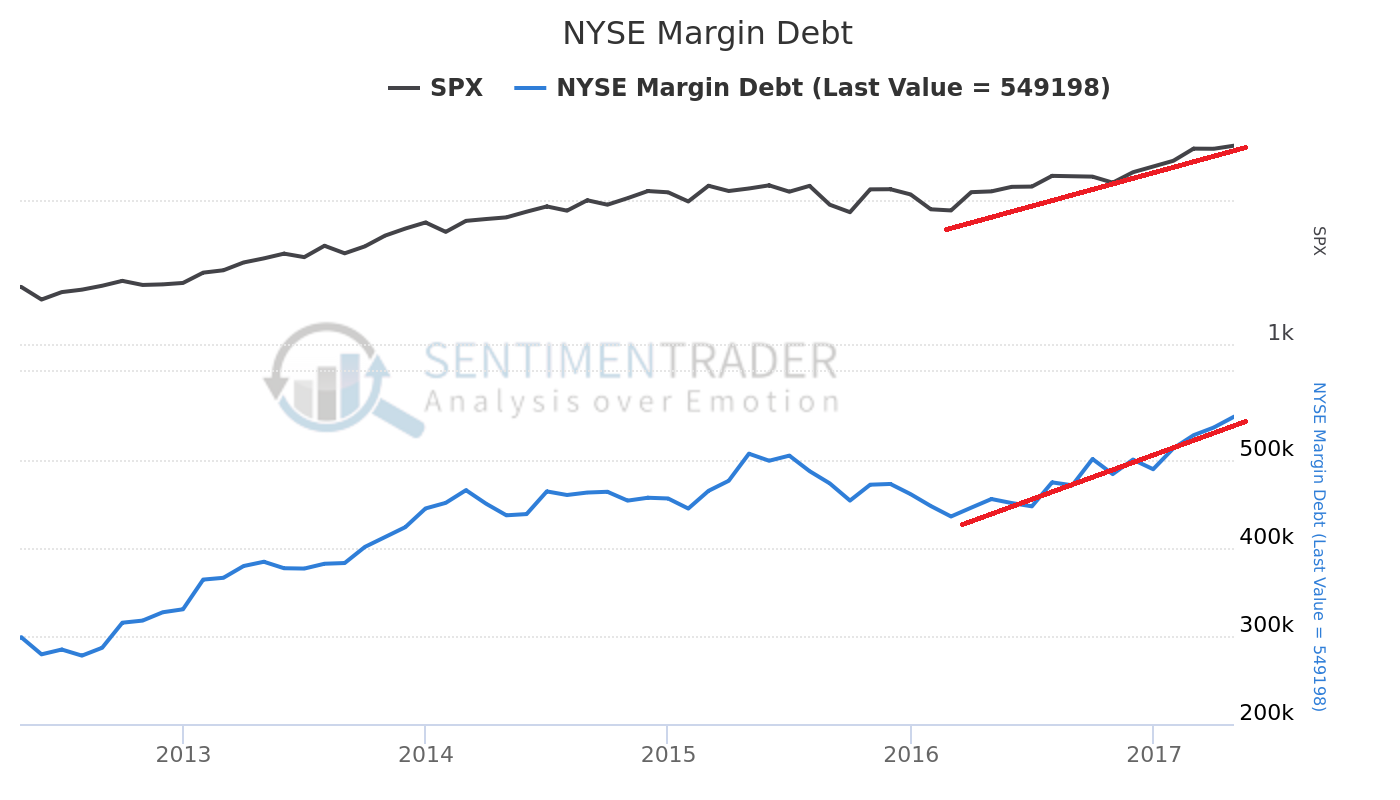
The New York Stock Exchange, (NYSE), releases data monthly, of the customers of clearing firms overseen by the NYSE. This data includes margin debt and free credit balances. As you can view, from the chart below, there is a positive correlation between margin debt and the rise of the SPX.  It is now confirming that buying continues to push the SPX much higher!

sf1

Follow the Smart Money!

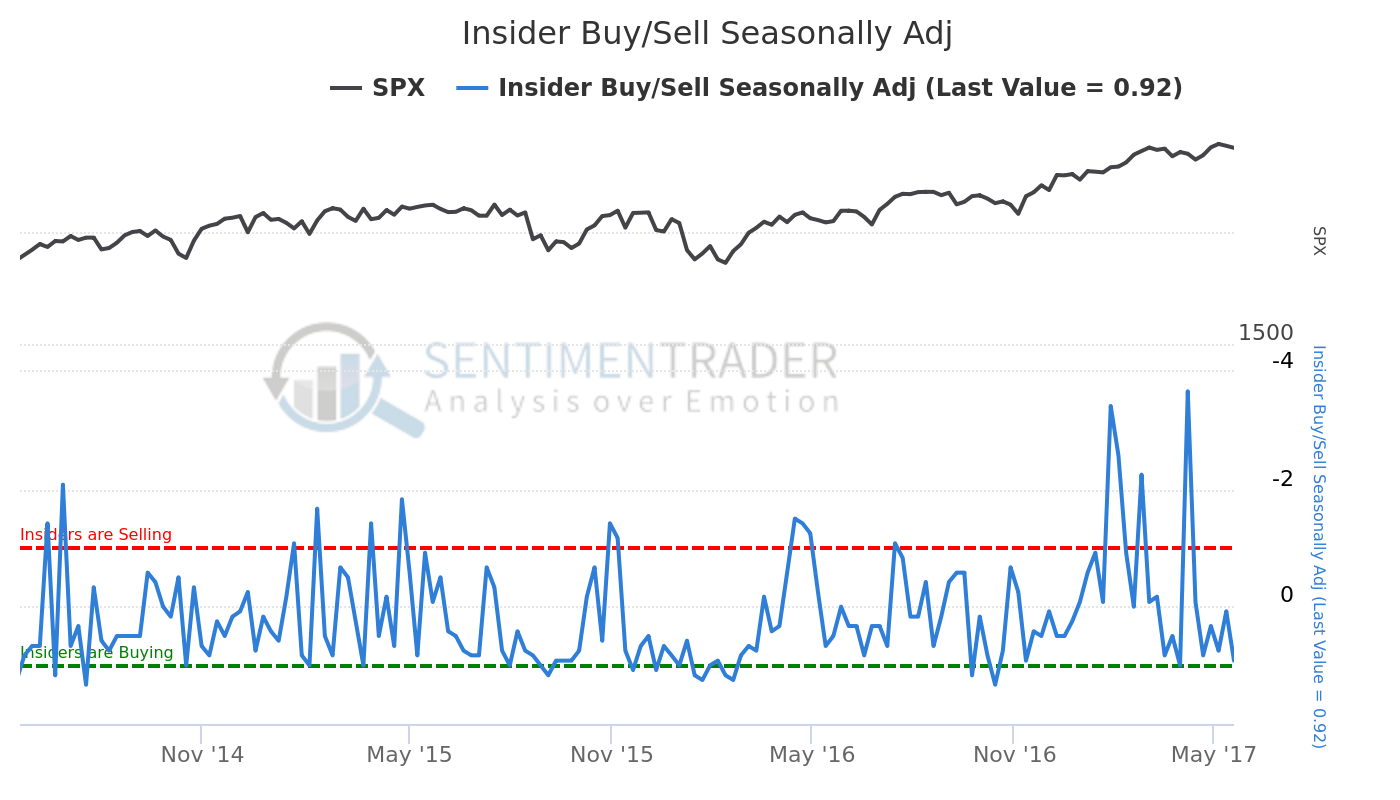
Company insiders tend to be the smart money. When there is insider buying, it is good for the markets.  Buying and selling, by corporate insiders, often occurs when they believe in the future prospects of their company’s earning potential.

A proprietary ‘insider’ indicator was created to monitor the buying and selling of options.  This indicator measures the net number of insiders among companies in the SPX, that sold minus bought, shares in their own companies. It looks over the past five years to determine the average level of buying or selling during that month, and adjusts the current figure based on those averages.

The bottom green line is when the insiders are buying, meaning when the blue indicator line is low it means stocks should be bottoming and can be bought based on insiders activity.

sf2

The Slippery Slope – Oil

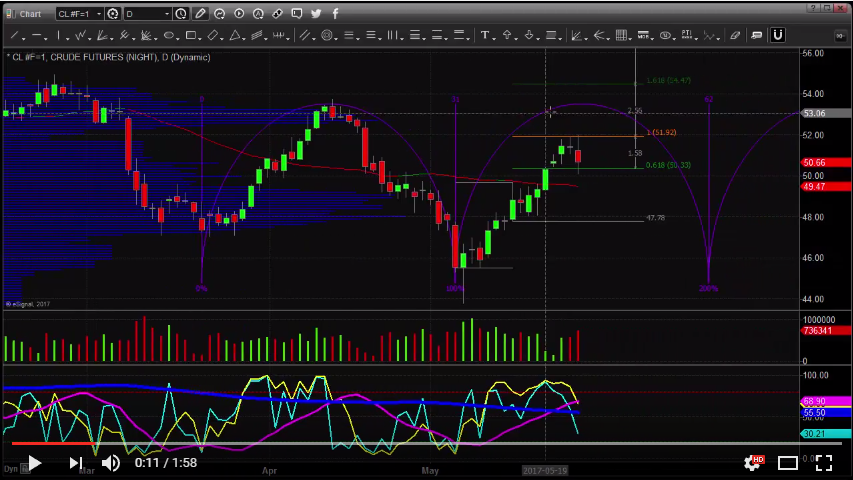
On, Thursday May 25th, 2017, oil prices plummeted 5% after the OPEC and non-OPEC producers agreed to extend the oil output cut deal for nine months. Oil sold-off, aggressively, as market participants were expecting the cartel to announce deeper cuts to output.

I issued a trade alert, to my membership, a couple of hours before the opening bell as I could see what oil what about to do next. We at TheGoldAndOilGuy.com purchased the SCO ETF which is a 2x oil ETF, which rocketed higher by 10.4% over the next few hours on May 25th which we locked in partial profits and adjusted our stop to eliminate any downside risk. Members were elated with our instant results.

Watch Crude Oil Forecast Today Video

crude-oil-forecast-todayCLICK HERE TO WATCH


Short-term aggressive stock traders may want to look at our premium newsletter where we alert our clients to these types of opportunities every week at ActiveTradingPartners.com and attempt to keep our members aware of strong trading signals using our proprietary Momentum Reversal Method trading system.


TRADES THIS MONTH:

ERY 4.75%, in 2 Days

SLV 3.2%, in 6 Days

MOBL 15%, in 7 Days

FOLD 9.5% in 40 Days


If you want to take FULL Advantage of All Our insight and expertise tune in every morning for BOTH our daily stock market forecast video and our Stock & ETF Trade Alerts Newsletter today!

Chris Vermeulen

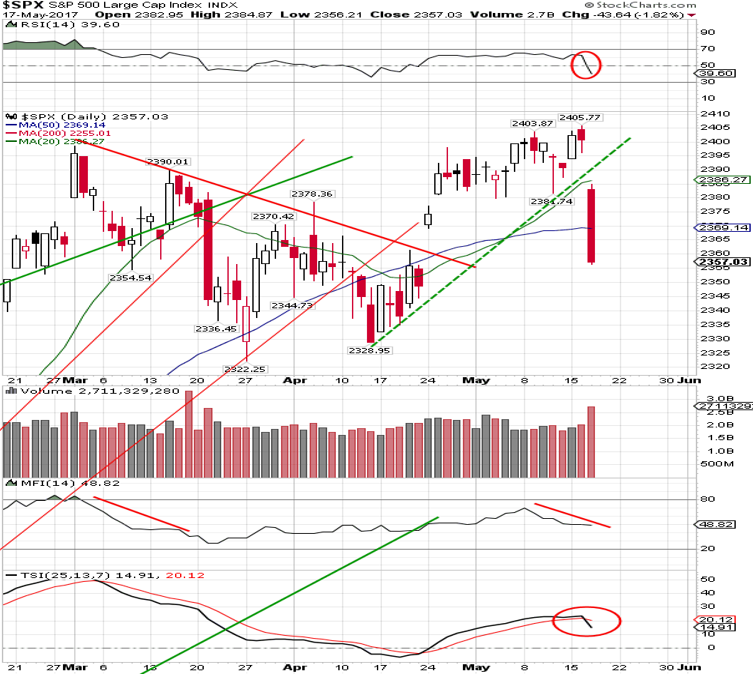
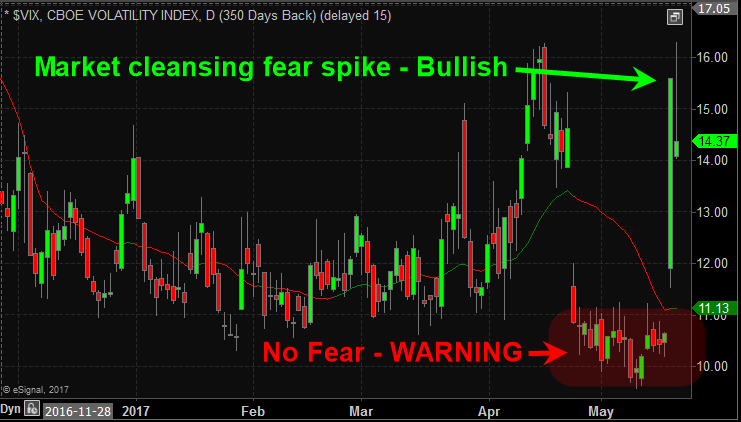
The broad US stock market last week took a tumble sending a massive wave of fear through investors’ minds. On Wednesday May 17th the S&P 500 index plummeted 1.7% causing the fear index to jump a whopping 48% in a single session.

What does this mean and what should we expect going forward? I don’t see the recent drop as being anything to worry about at this point. It’s important to remember that some of that larges drops in stocks happen during a bull market (rising trend). In fact, these stand out sharp drops on the charts are nothing more than the market trying to buck investors out of the bull market (scare them out) before it continues higher.


The Market Trend Forecast Prediction

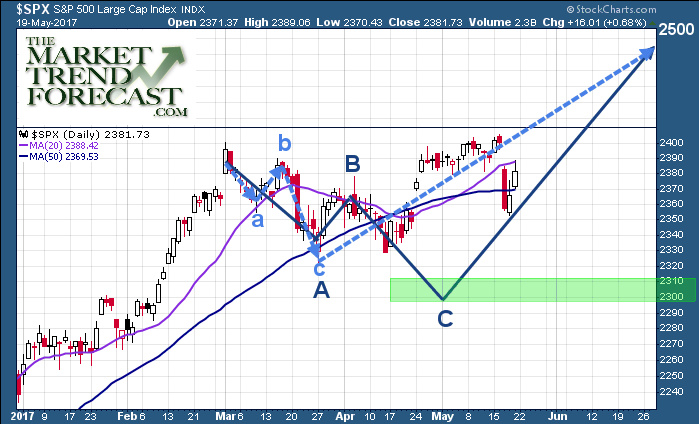
Look at the chart below courtesy of TMTF website. This chart was originally posted back in April with two potential price paths for the SP500 to reach the next price target of 2500. The overall forecast points to higher prices this summer with the potential of a major top forming late July or August.

I should caution that I believe there is potential for another washout low with the SPX dropping to the 2300 level still to reach that Elliott Wave level. Even if this level is hit, the overall market trend will remain bullish and would be fully rejuvenated for the next big leg higher.

TMTF--3


Fade the Fear – Swing Trading Fear

Let’s face it, we all know the feeling of when so one jumps out and scares us. The surge of blood pressure, adrenaline, and how our body jolts into action is a natural human response.

Fear among investors is almost identical when there is a sharp drop in price. Other than the fact that investors don’t typically scream, put up their fists and/or run away, instead they hit the SELL button to close out losing position in order to remove the fear/pain of further losses.

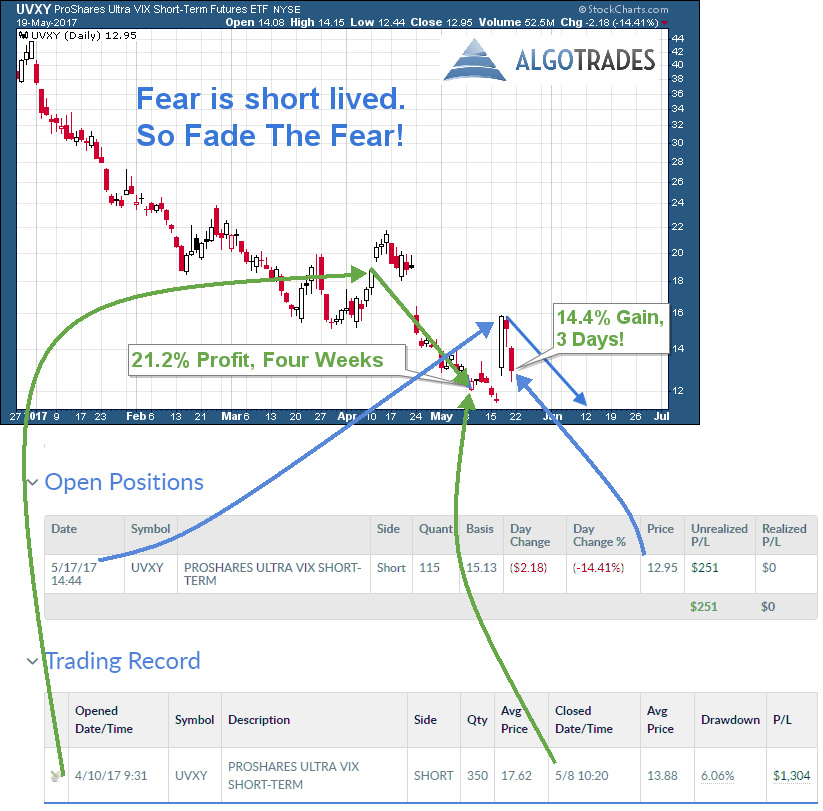
Typically, most traders panic out of positions at the same time (within a few trading days) and this sentiment shift can be seen as a price spike on the VIX chart.

Below you will see a chart and recent trades executed based on a strategy I have been testing for some time and recently started trading live. It is based around the fact that fear/panic is very short lived and fades away quickly. It is also based on the fact that leveraged VIX ETFs also fall in value over time because of how they have been designed. This allows us to short the long leveraged VIX ETF adding further potential gains to a falling VIX price.

vix-atn


Momentum Trade Extreme Panic & Greed

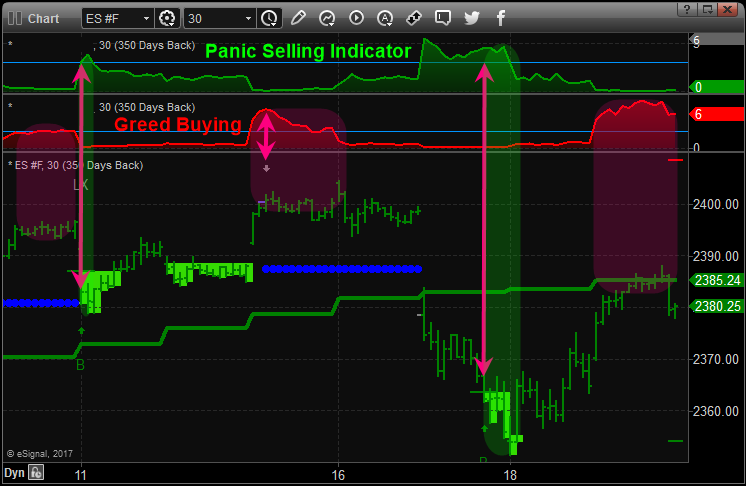
The two previous charts above were based on daily charts of the markets. This portion shows you the potential turning points and trade setups each week based on the 30-minute intraday chart. Some weeks can provide multiple trade setups if property identified.

The below chart is the SP500 continuous contract futures chart which I created and use for identifying turning points and trades in the broad market using SPY, SSO, SDS, or ES Mini Futures. This chart and its analysis also helps me identify when the VIX (Fear index) should be topping or bottoming as well.

Obviously, these moves are small and quick only lasting a day or two. But keep in mind if you have high probability trade setups and apply leverage like ES mini futures one can profit handsomely from small but frequent moves like this ranging between $250 – $1500 profit.

OB-OS


In Conclusion:

In short, the longer-term trend for US equities remains up (bullish). Based on the short-term 30-minute chart above stocks are a little overbought so a small pullback or pause is likely. While this week is a full trading week, it is going into a holiday weekend which typically favors higher stock prices by the closing bell on Friday.

In my next article, I plan to share with you what gold, silver, and miners are setting up for and it’s likely bigger and in the opposite direction than you think, stay tuned!

Finally, I want to mention that I will be getting back to my roots and passion in terms of article content. The past two years I changed gears to write more about the global economy and news. Recently I realized that I just don’t enjoy writing about these types of thing. Its all doom, gloom, corruption, and ridiculous actions but leaders around the world and not fun to write or read. So, I am thrilled to say that things will be back to how they were: Simple, technical analysis based forecasts and weekly trade setups.

Learn more about my daily price forecasts and turning points video: www.TheGoldAndOilGuy.com

Chris Vermeulen

The financial markets have already “priced in” huge tax cuts, reducing red tape regulations and a massive increase in infrastructure spending.

Perhaps, the markets are now believing that the agenda is not going to occur with Al Green asking for Trump impeachment?  This could result in a significant downturn for stocks if it were to unfold.


The SPX index declined more than 1.75% and wiped away about $375 billion in market value. The SPX went from a record close three days ago, to below its 50-day simple moving average on Wednesday May 17th, 2017.  Institutional traders view the 50-day simple moving average as very strong trend support. The SPX level at 2407 turned out to be the best the bulls were capable to achieve. Their second attempt to push the benchmark higher failed at 2406, where the bears stepped in.


Financial Markets are Spooked!

There is a slow leak in U.S. stocks. The SPX has more declining stocks than advancing ones during this tight trading range. This is unusual behavior and resulted in lower returns over the following month.  Tune in every morning for my video analysis and market forecasts on all ‘asset classes’ so you know where and why the market is about to move.

The SPX decline on Wednesday May 17th, 2017, was abnormally large, relative to the past 3 years.

SPXM18

These two market warning signs, the Titanic Syndrome” and the Hindenburg Omen” are giving a “preliminary sell signal” based on analyses of 52-week New Lows in relation to New Highs on the NYSE. On May 4th, 2017, the Hindenburg Omen was triggered on the NYSE and Nasdaq exchanges.  It has a consistent record at highlighting underlying weak market conditions that preceded market trouble. On May 16th, 2017, both exchanges triggered the Titanic Syndrome. This occurs when the NYSE 52-week lows out-number 52-week highs within 7 days of an all-time high in equities within days of the major indexes closing at a one-year highs. Historically, these signals have led to further weakness over the following two weeks. As stocks were plunging, investors are currently panicking out of stocks and into the “safety” of bonds.


Is This The Return of New Volatility?

Richard Haworth, CIO of Capital Advisors, a London-based hedge fund, which bets on rising price swings is quoted as saying, “The market will revert to higher volatility and this could be the start of it. The sharp move this week reflects how low volatility the market was — how complacent.”

VIXM18


Conclusion:

In short, investors have been overly bullish with virtually no fear that share prices could fall.  But this weeks drop seems to have renewed the fear and is cleansing the market by weak investor shares being sold to those who are bullish and willing to hold them for higher prices.

This is normal bullish price action and once this phase ends higher prices should return as we enter the summer months.

In the past week over at ATP service we have closed a few winning trades whie the market sold off. SLV 3.2% profit, FOLD 9.5%, MOBL 15%, and ERY 5.4%.

The bottom line is that it really does not matter which way the market goes, there will always be ways to profit.

Chris Vermeulen
Daily Market Price Forecasting Video
Active Stock & ETF Trading