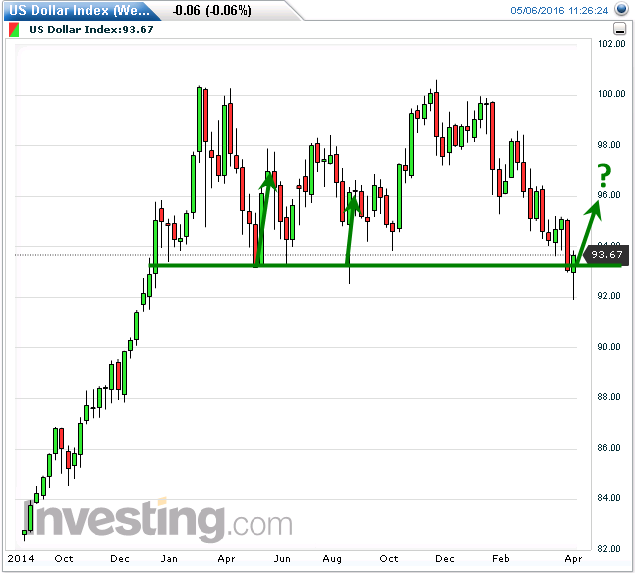
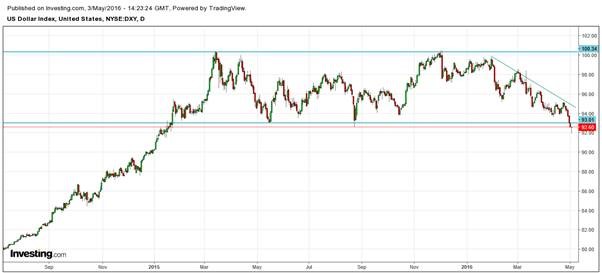
Traders who follow the price of gold and silver, should keep an eye out on the U.S. dollar index. The dollar has been within a trading range for more than a year. During December of 2015, the dollar rose to test the highs at 100, however, since February of 2016, the dollar has been in a downtrend, as shown in the chart below.

The FED has reduced the expectations of a rate hike in 2016 from one full percentage point, in the beginning of the year, to a half percent and perhaps to none at all. However, my expectation is that the FED may have to start rolling back this increase before the end of 2016.

The bullishness in the dollar was sparked by expectations of a change in the monetary policy of the FED. Market participants believed that the Zero Interest Rate Policy, NIRP, would end and that the rates were on an upward trajectory.  However, world economic conditions have deteriorated since the beginning of 2016 and the ECB and BOJ both responded with Negative Interest Rates, NIRP and more QE. Consequently, the FED was forced to delay their rate hikes.

Last week’s shot term breakdown of the dollar, below the critical support of 93, was a bearish sign which can bring the dollar further down to the 86 levels. But the dollar posted a solid rally by the end of the week to regain that critical support level for the time being.

price of gold dollars

Although gold is a commodity, it is used as a hedge against ‘uncertainties’ and ‘crisis points’ which gives it a different edge. Gold, also behaves differently because of its’ usage as money, as ‘a store of value’, for many centuries for both individuals and countries.

Due to the ‘meaningless’ monetary policies of the various global Central Banks, gold will follow its’ unique behaviour. I have explained this earlier and my models have been very timely in forecasting the turning points.

Gold will have a one-way move higher with many corrective phases on its’ impulsive new uptrend, therefore, I always keep my subscribers immediately informed so as they know when to make the next profitable trades of both gold and silver. The next trade I feel is just around the corner.

Follow My ETF Trading Alerts and Analysis: www.TheGoldAndOilGuy.com

Chris Vermeulen


Price of Gold: The activities of the ‘commercial traders’ in the COT data is closely watched by the market participants, as they are believed to be the smartest of the lot.  They take deliveries on their bets, unlike the speculators, who have no interest in taking a delivery.

If you have followed the ‘commercial traders’, without paying attention to my proprietary predictive trend and cycle analysis for the price of gold and silver, you would be sitting on large losses, due to their ‘short positions’ which mean they expect price to move lower.

The ‘commercial traders’ ‘short positions’ are currently at record levels which are more than twice of that as compared to last years’ readings. Since the beginning of the second half of February of 2016, the ‘commercials’ have been increasing their short positions during the time that gold was closer to $1220/oz.

Price Of Gold
Daily Price of Gold Chart and Analysis:

However, if you have followed my recommendation, you would have maintained that once the price of gold crossed the $1190/oz. levels, it was destined to go higher.

However, the head and shoulder formation which developed after gold broke above the $1190 resistance trend line I did feel it would correct for a few weeks.

Instead, the price of gold did not correct, rather it consolidated with this what looked to be a head and shoulders pattern then broke out to the upside and rallied. Once a bearish pattern fails, it becomes very bullish which is what has happened in this case. I was quick to alert my subscribers to buy as soon as the pattern was broken and turned bullish.

However, the current price of gold at $1300/ oz. could offer some resistance, but the resolution of the trend in due time is going to be very strong. The pattern target of the current move is $1350/oz.

priceofgold

What about the ‘poor man’s gold’, Silver? 

The chart indicates that in the last three weeks of April of 2016, the ‘commercial traders’ have added to their short positions continuously, however, they have been proven wrong once again with the breakout in silver returning 20% during the month of April of 2016.

Price Of Silver


Although we take note of the ‘commercial positions’, I strongly believe in my analytic models which have provided excellent returns, over many years.

Once above the $16/oz. levels, I have had no doubt that silver was ready for a sharp run-up. Therefore, I will be advising my private subscribers as to when to purchase silver, against the bias of the ‘commercial traders’ and I am confident that my subscribers will reap a windfall when the time is right.

 priceofsilver

Conclusion – Current Investment Strategy of the Mega-Rich


Do you really want to follow the ‘smart money’? Then follow the billionaires and the big banks as I have been doing.  Ray Dalio, the founder of Bridgewater Associates, manages the largest hedge fund, in the world. His fund manages over $160 billion in assets.  Today, his fund is bullish on gold.  He recently stated “if you don’t own gold there is no sensible reason other than you don’t know history or you don’t know the economics of it”.

Stanley Druckenmiller has been purchasing a large long-term position in gold.  He made an average of 30% of an annual return in his fund since 1986. So, what is he buying now?

He has an $880 million position in gold, right now. Do you think you should now be following the ‘really smart money’, today?

Follow the ‘smart money’! Gold is for the long-term investor, well looking forward 3-5 years at least.

Get My Daily Live Price of Gold Market Analysis, Forecast & Trade Alerts: www.TheGoldAndOilGuy.com

Chris Vermeulen

Last Friday, April 29th, 2016, the U.S. Indexes were very bearish as price clearly broke below the 20 day moving average then rebounded back up to test that level and was rejected and sold into.

The chart below shows the market bullish and bearish momentum and price action. The momentum of these markets has now shifted away from being ‘bullish’. It is currently struggling to find support and hold up.  Do not expect new highs on the SPX and I feel its beginning its ‘bearish reversal’ (topping phase) before making a new leg down.

idealbounce

This ‘counter trend rally’ is now completing!

It is important to realize that all bear markets have strong rallies within them. In fact, some of the more powerful market rallies happen during bear markets, so what we have experienced this year is very normal.

With being that said, this bear market counter trend rally is running out of steam and is on the verge of a very strong wave of selling which will catch the majority of market participants off guard. Why? Because these super strong counter trend rallies actually convince the average investor that stocks are the place to be and will continue higher. These counter trend rallied get investors to buy up stocks at the ultimate worst possible time, just before prices collapse. We have seen this happen time and time again and this time is no different.

counterchart

Where Do We Put Our Money Then?

Gold prices have surged this year. Silver has lagged far behind but has recently rallied to make up for its underperformance this year. Silver, known as ‘poor man’s gold” and I feel will do exceptionally well in the coming year as it enters a new bull market.

I would expect sideways consolidation at this point for gold and silver before they continue up again, but they are definitely moving much higher the rest of this year.  Subscribers and I are long gold through an ETF and if this trade pans out in the coming weeks it could end up being a multi-year investment.

These ‘monetary metals’ are now ‘confirmed’ to keep rising as a safe haven and currency play by both investors and countries in my opinion.

The U.S. dollar has broken support in the last few days.  This is a primary driver causing gold and silver to begin these big moves up in the past week.

US Dollar Index Weekly Chart Below:

As you can see below, the dollar broke support early in the week, but has recovered nicely to get back above support for the time being.  I feel it’s just a matter of time before the dollar breaks down and collapses 10 – 15 cents. If this/when this happens precious metals should sky rocket!

usd-bounce

Market Trading Conclusion:

In short, the US large cap stock are in the very final stage of topping before share prices collapse and start a 8-16 month bear market. There will likely be some big event that triggers the selloff, the question is what and when?

There are going to be some great short term trades that could generate 50%, 100% or more within the next month which I have been following closely with subscribers of my ETF trading newsletter which you can be a part of. Join at: http://www.thegoldandoilguy.com/etf-trading-newsletter/

Chris Vermeulen

This past Friday, April 29th, 2016, GOLD entered its “first phase” of its new long-term bull market. This has created a whole new world of opportunity, for my subscribers. The global Central Banks opened the floodgates encouraging us to go on a gold buying spree.

The Government Is Like an Unethical Banker Playing Monopoly

What the government has been doing and continue to do is such a joke. In Laymen’s terms, it’s like all of us playing the game Monopoly. We all start off with some money, slowly accumulate properties, rental income and build wealth, while closely managing our money and making sure we have enough cash on hand to buy more properties and/or pay rent and other fees as we move around the board. We are honest players paying our debts as required and expected.

Then there is the banker, who helps with the transactions of paying fees, rents, properties etc.

Unfortunately, the banker is also a player at the table (banker = Government). This banker always happens to be the worst/dumbest/unethical player one could ever be forced to play with.

The emergence of the “BLICS”, not BRICS, nations, has been a new proxy entity designed solely for exporting QE!

This undisclosed systemic risk is being spread to secondary nations without the benefit of any investor/trader knowledge through the Financial World.

Over $818 Billion in US treasury’s and swaps have taken place already.

READ FULL ARTICLE: CLICK HERE

The newest issue of TradersWorld magazine just came out which has some great articles in it. They wanted me to contribute some trading insight which I have. You can get this exclusive insight article on page 40: Metals & Miners Set To Explode

cover62