The group of charts is this article may look a little noisy and overwhelming but this is really simple analysis if you look at in bite size pieces. Let me explain each chart and you will start to see the power that technical analysis provides those who accept this so-called witchcraft…


So here it is, No Fluff, Just Trading Stuff…


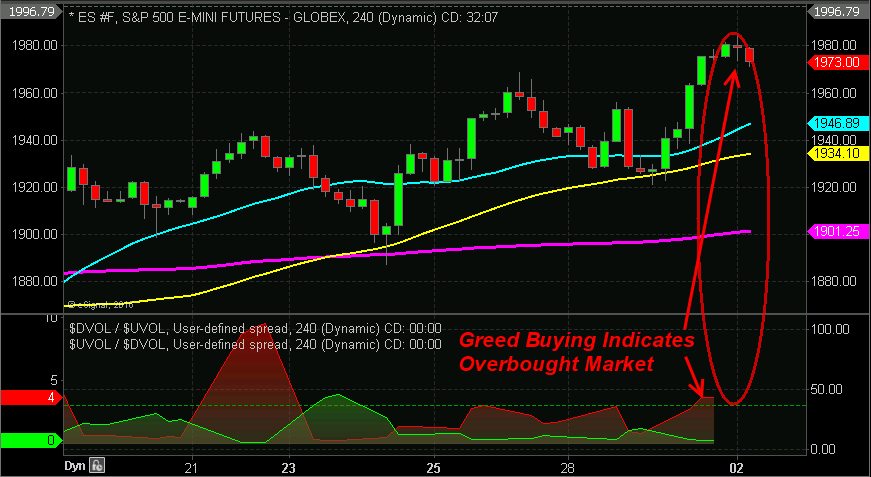
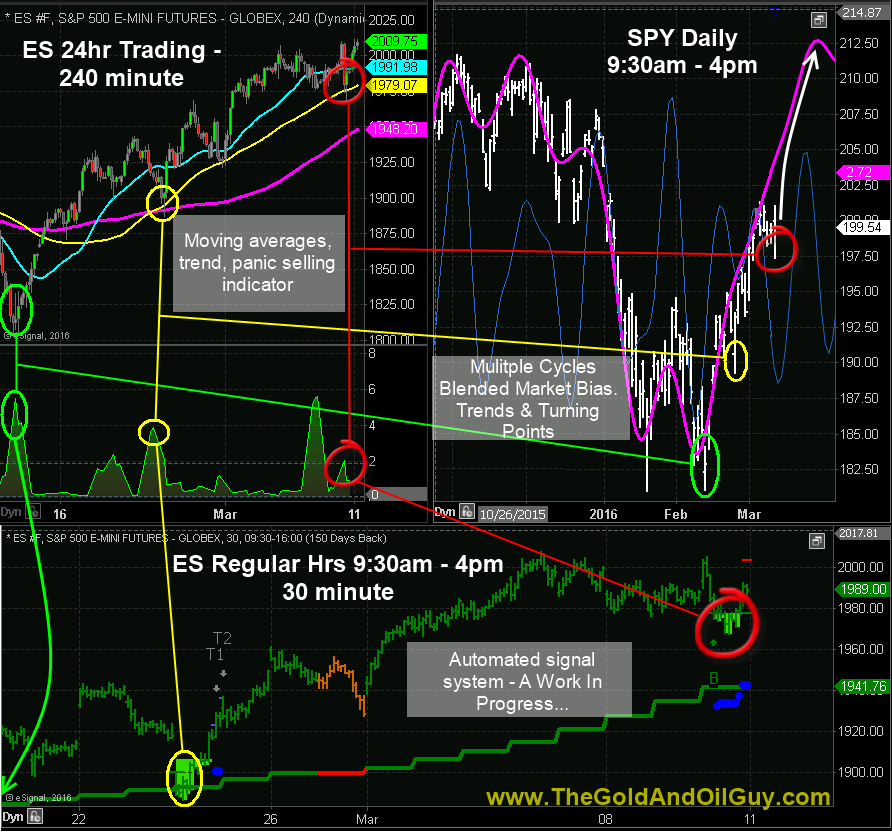
ES 24hr Trading – 240 Minute Chart:

This 24-hour moving chart gives you the ultimate view of the current stock market trend and overbought/oversold levels. I use simple moving averages to gauge trend and how far price is from a mean average price for a visual of how far the market is overbought or oversold.

Also, I use these MA’s as possible support and resistance levels to add confirmation when other indicators I use confirm at the same price and time.

At the bottom of this 24 hour chart you will see my custom panic selling volume indicator. When this spikes I know traders and investors are fearful and panicking out of positions. That is when I start looking for bottoms because I want to take the other side of these emotional trades placed by the masses.
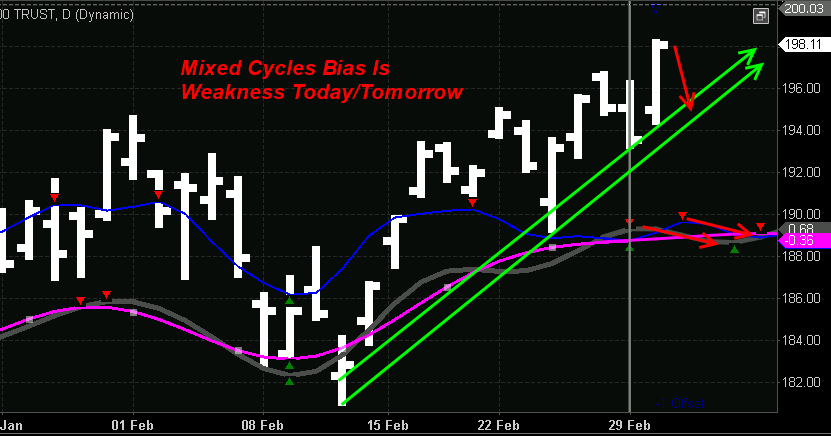
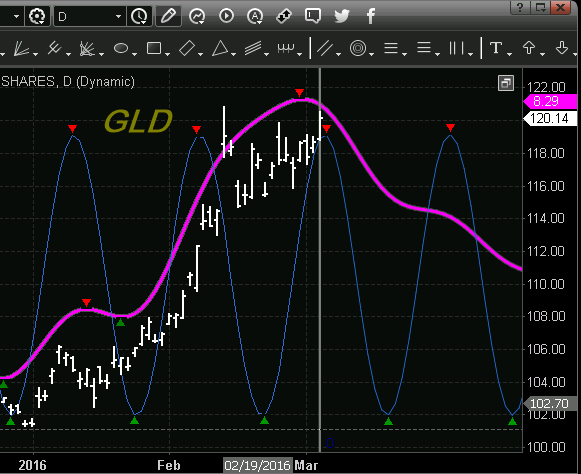
 

SPY Daily Chart:

The daily chart of regular trading hours has many different characteristics from the 240 intraday chart. Where the 24-hour chart above shows ALL PRICE ACTION, the SPY only shows 1/3 of the days price (9:30am – 4pm ET). This is when most of the day’s volume is traded and I like to see how the masses/average joe traders perceive the market.

I use these time frame just for my cycle analysis which allows me to identify the market trend/direction (pink cycle line), to identify short-term noise or counter trend moves within that uptrend using the shorter cycle analysis (blue line).

Both of these cycle lines use a combination of the most active cycles in the market across multiple time frames and then are blended and weighted into one line. This tells subscribers and me where the market is most likely to move and when it should be struggling or reversing.

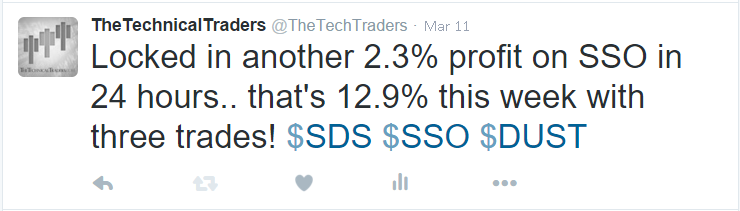
In fact, I saw the pullback coming in stocks and shorted the market for a quick counter trend trade, and exited it Thursday morning, and then go long again and this new SSO long SP500 trade is already up 3% within a few hours for us. Very exciting stuff to say the least.


ES Regular Hours 9:30am – 4pm: 30 Minute Chart

This is one of my trading signal systems that I am building which will identify these market conditions and will eventually autotrade them. This is my newest improvement and is still a work in progress, but I expect it will replace some of my other systems later this summer. My focus is to have something like this trade futures and the SP500 ETFs.

setup2

twitter


CONTINUE TO NEXT PAGE:

Wednesday subscribers and I sold DUST for a quick 8.6% profit, then Thursday morning sold our SDS for another profit and jump into another trade which is already nicely in the money within the first few hours…
Things are starting to get really good again and the second half of 2016 and 2017 should be nothing short of AWESOME!
We do need the large caps to break key support and start a bear market before the mega new trends emerge in three different asset classes. That time will come and subscribers to my paid newsletter know this well ahead of time.
I will be posting on my blog and emailing out a quick technical report showing Thursday’s pivot know so you know how to spot these and trade them for near instant gains.
Until then we will continue to trade with caution and play the markets short-term price gyrations for small but consistent profits as you can see below…
Oya, and on Friday or Monday I think we could be entering a trade that could last a month and generate huge potential, and its a trade no one is expecting…
perfmarch2
Larry the owner of Traders World Magazine wanted me to write an exclusive article for this issue which I did. And he gave me a special link for you to download and read it FREE!
Just visit the link below, and click on the image of the magazine to view it.
My article is on page 40

Globally, Central Banks are resorting to measures which have never before been witnessed in history. Since the beginning of time, ‘boom and bust cycles’ have been a natural economic cycle. Economies, globally auto-correct themselves by punishing the ‘excesses’ and ‘rewarding prudence.’

Find out exactly what you can do to protect yourself and profit!

READ SPECIAL REPORT: CLICK HERE

Gold’s Next 10% Move is Down, Not Up

Gold has been on a tear since the start of this year. It is the best performing asset with a 16% rise in 2 months, however, if you are planning to enter gold at these current levels, you are likely in for a big surprise. Gold is overbought and technical analysis is pointing to a drop in gold price to the $1150/oz. level, a good 10% lower from the current levels.

The equity markets are in a bounce/rally mode and likely to remain buoyant till end of March. Oil prices, which were causing a scare worldwide are also on the mend, the bottom is likely in place at $26/barrel.

The Nonfarm Payroll data, released on March, 4th 2016, has given a green signal to the FED to move ahead with the next proposed rate hike. Whether they go ahead with the hike or postpone it till the next meeting is difficult to assess, but the U.S. Dollar will likely trade with a bullish bias as long as the chances of a rate hike remains on the table.

A strong dollar dims the sheen on the yellow metal, if the dollar continues to remain strong, gold will likely come off towards our target low area of $1150.

Technically, gold has risen from its lows without any retracement, as shown in the chart below. Though gold has broken out of its long-term downtrend, the market participants should remain cautious on it. Many bulls will want to pocket their profits as gold is nearing a resistance area.  The bears will enter shorts closer to resistance. With both of these events coinciding together, gold will retrace back to its breakout level.

The bulls will buy closer to $1190/oz., which was the earlier resistance, they will attempt to defend the level and support the market. The market can either take support at $1190/oz. or drop down towards $1150/oz. area to shake out many long positions before rising again.

mgold1


Take a look at my gold cycle analysis. The pink line is a blend of multiple cycles and follows the actual price very closely and allows me to predict into the future if the bias will be downward or rising.gldBoth Societe Generale and Goldman Sachs are negative on gold with targets of $1150/oz. and $1000/oz. I totally disagree with them on their longer bearish views, I want to make it clear that I am not bearish on gold from a longer term perspective. Gold price will make new highs in the coming months, however, the next 10% move for gold is down rather than up.

Gold is still more than 30% below its highs. Traders and investors should buy 10-15% of their portfolio allocation in gold, when it drops to $1150-$1190/oz. levels which I expect will happen over the next 1-4 weeks.

In fact in a recent conversation I had with Kyle Winn the Founder and COO of Gold Gate Capital. A firm that specializes in precious metals, gold investing. He agrees with my forecast of what is to unfold and he has a free book called “The Looming Financial Crisis” that focuses specifically on how to properly invest in metals and how to do it properly within your IRA and 401k. He went on to mention that those between the ages of 65-85 can benefit the most.

Get My Specific ETF Trade Alerts at: www.TheGoldAndOilGuy.com

Chris Vermeulen

Its beginning to feel a lot like greed buying in stocks and metals… As talked about in today’s video and many other times in the past 10 days we are waiting to see if we get a bearish price pattern on gold miners, or a blow off time. Today looks and feels like a blow-off top in gold and miners. We could see price gap up tomorrow or maybe more up for another day or two, but overall I think big selling is just around the corner. My story has not changed, it just that them market always has a way for dragging patterns out longer than you anticipated.

The saying is “If the market can’t shake you out, it will wait you out.”

Here are two gold cycles… See chart below or login to view:

gld

Chris Vermeulen – Get My ETF Trades www.TheGoldAndOilGuy.com

Yesterday the US stock market posted massive gains with indexes closing up 2-3%. We don’t see that very often. This type of price action is what causes most traders and investors to become bullish at the wrong time

I could write a book on the characteristics of a bear market but the important point for today is to know that some of the strongest rallies is stocks happen during bear markets. It’s just the way the market moves because of fear, greed, and short covering.

When traders and investors see these massive price gains the think the bull market is back and price will continue higher. While they may be correct for some time, the overall longer market trend clearly remains down and price will weaken and drop over time.

Take a look at the chart below because they paint a simple picture of short term market trend and timing of minor market tops and bottoms.


SP500 Futures 240 Minute Chart (4 hour bar chart)

This chart shows the overall trend is up by looking at the moving averages. And more importantly the bottom custom RED indicator line which moves above the dotted line threshold.

I use tells us when market participants are becoming greedy and buying at high price s because they fear they will miss more of a price rise. This is blatant greed and it typically signals a top is very close.

On the contrary, the GREEN line indicates fear/panic among traders and that they are dumping shares because they fear price is going to continue to drop.

overbought1


Now let’s take a look at the Barchart.com market momentum index.

This is a simple free online chart I follow closely so I know if I should be looking to get long, short or just avoid day trades or momentum trades. I like to only take positions during extreme levels because it typically means price will have a strong reversal and trend vs a slower, choppy and more unpredictable movement.

This indicator is simple yet highly effective. If the price is over 101 then the market is overbought and we should see price pullback the same day or the next session. When its is below 99 then the market is oversold and a bounce or bottom is likely.

It is important to understand that if the trend is up with the broad market, then you should be looking buy into the oversold dips and be taking partial profits during overbought times. And Vice-versa in a down trend. See this momentum index chart live here.

overbought2


My Cycle Analysis and Trend Forecast

It’s tough to see the dark blue cycle line and the dark grey line point to a pullback for a couple days. A pullback to first support level is highly likely.

overbought3


Price Spikes Provide Steady Stream of Intraday/Momentum Trades

Yesterday March 1st was a great day for day traders and momentum traders who followed my price spike trade setups in the SPY and GLD. Both of these setups played out and reached their targets in the first day.

targetshit


Market Forecast Tips and Analysis Conclusion:

Hopefully, this short article helps shed some light on how to identify market tops and bottoms. Trading is not rocket science but it does take extreme discipline, patients and practice.

Get My Daily Analysis at: http://www.thegoldandoilguy.com/etf-trading-newsletter/

Chris Vermeulen

Last Wednesday I sent out an update telling you we have a price spike pointing to higher prices.. well today that level was reached, and in fact last night we had a spike down… likely gold rolls over today.


Chris Vermeulen – Follow My Lead As Premium Subscriber: www.TheGoldAndOilGuy.com