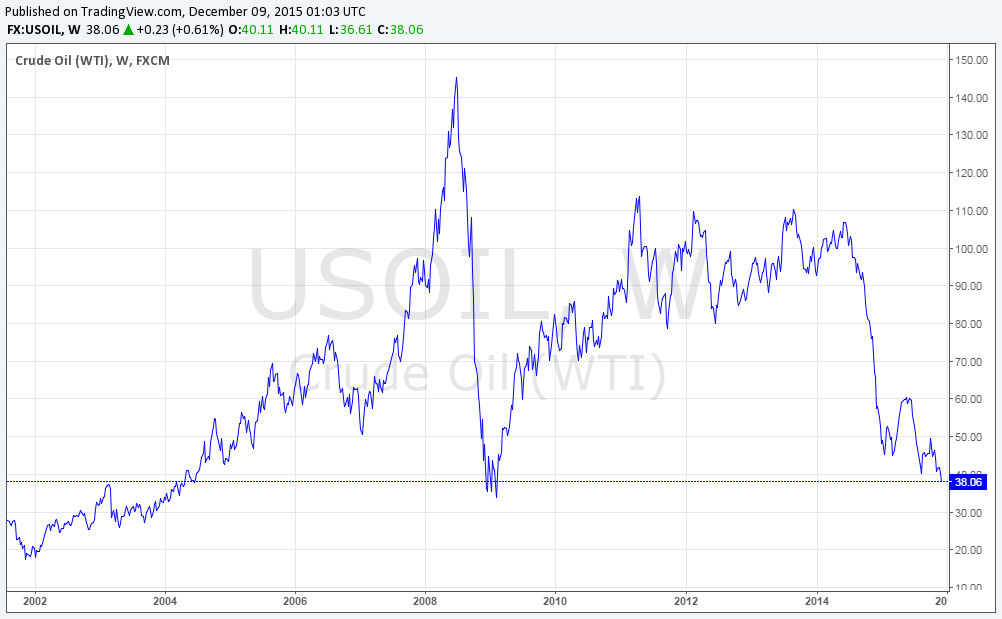
About eighteen months ago the international price of WTI Crude Oil, at the close of June 2014, was $105.93 per barrel. Flash-forward to today; the price of WTI Crude Oil was just holding above $38.00 per barrel, a drastic fall of more than 65% since June 2014. I will point out several reasons behind this
https://thegoldandoilguy.com/wp-content/uploads/2014/06/oilwti.png179273adminhttp://www.thegoldandoilguy.com/wp-content/uploads/2014/11/tgaoglogo.pngadmin2015-12-30 17:31:592015-12-30 17:31:59The Biggest Conspiracy of the Century by Saudi Arabia and OPEC to Eliminate It’s Competition
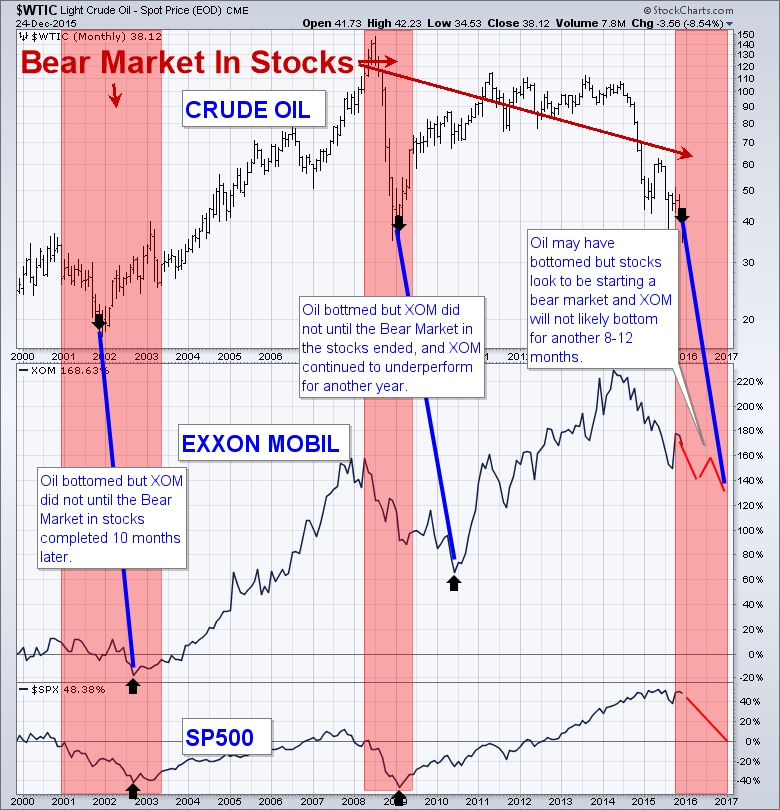
A full blown bear market in energy resources and energy stocks has been underway since mid-2014. History shows that the price of crude oil typically bottoms before the broad stock market. And oil related stocks bottom at the same time or later than the broad market.
The monthly chart below shows how oil bottoms several months before the stock market does. This provides us with some insight on when we should start to expect a bear market to end in the US stock market.
Many traders follow and trade shares of Exxon Mobil. And while the are big money maker I do feel their share price is going to underperform oil for some time. Based on my research XOM has acquired many new oil operations, which many require $70+ per barrel to be profitable. This has cost XOM a considerable amount of capital and is now left holding and operating business that are losing money with the current price of oil sub $40 per barrel.
Base on my analysis, economic data and forecast I feel as though oil will remain low for another 3-9 months below $60 per barrel. It will do this for several reasons but what matter to us is that it forced the majority of oil producers to cap and close off well and go out of business. While this is taking place stocks and the economy will rebalance through a strong economic recession and a bear market in equities that will last most if not longer than 2016.
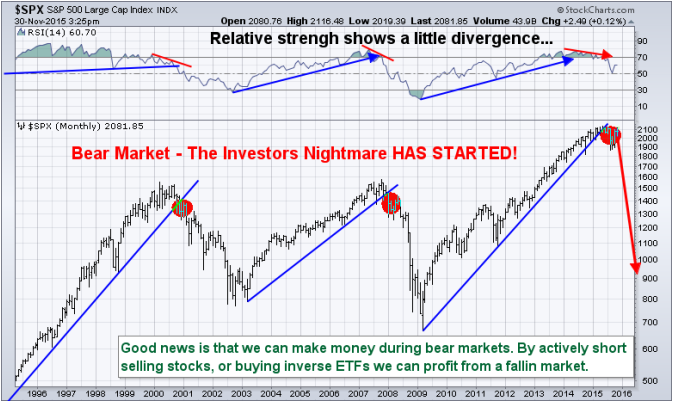
Take a look at the US stock market average (SP500 index) in the chart below. While this chart is a very basic and simple looking forecast understand that the stock market internals and market breadth have completely collapsed just s we saw in 2000 and again in 2008 months before the index collapsed and started bear markets.
Oil, XOM, and Stock Trading Conclusion:
In short, I expect oil to find a bottom during the next 1-3 months. Oil services stocks on average are likely to trade sideways and build a basing pattern. These oil services stocks will not breakout and rally until the broad stock market has bottomed which I expect to happen late in 2016 or early 2017.
Unfortunately, oil and oil stocks collapsed so fast without any retest or pause for us to get short and enjoy the ride down for profits. I feel trading oil and oil stocks will be choppy and tough in the near year. Last week subscribers and I played the energy (XLE) for a quick two-day pop of 2-4% return depending on entry and exit. These types of plays will continue, but the big trend trade in oil and energy are a long way away yet.
The easier money will be likely be shorting the stock market (buying inverse ETFs) to profit as stocks collapse which is what I provide subscribers to my ETF trade alert newsletter.
HOLIDAY SPECIAL – GET 12 MONTH OF TRADE ALERTS FOR THE PRICE OF ONLY 6!
https://thegoldandoilguy.com/wp-content/uploads/2015/04/bullandbear.png229306adminhttp://www.thegoldandoilguy.com/wp-content/uploads/2014/11/tgaoglogo.pngadmin2015-12-27 15:21:412015-12-27 19:45:54When Will They Bottom? Oil, SP500, then Exxon Mobil
Yesterday December 23rd we closed out a nice winning trade in XLE energy sector. If you have not yet closed the trade can should do so today and will locking an even larger gain of 4-5% return in only three days.
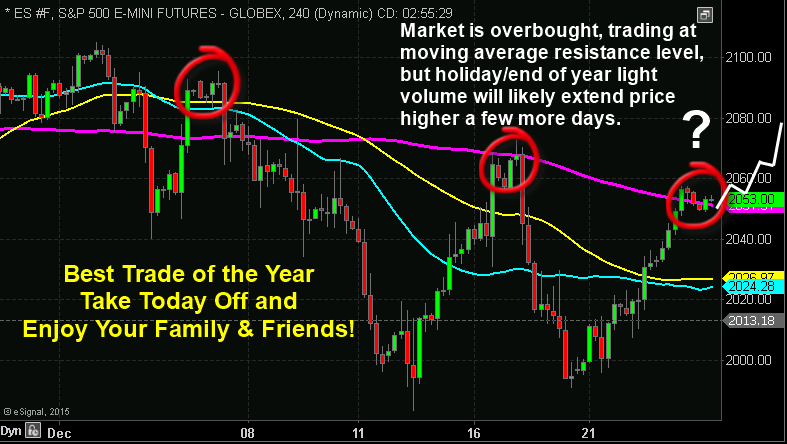
The stock market closes early today at 1 pm ET. Today volume will be light and its not worth sitting around watching or trying to trade in my opinion. The best trade for today is to spend quality time with your family and friends.
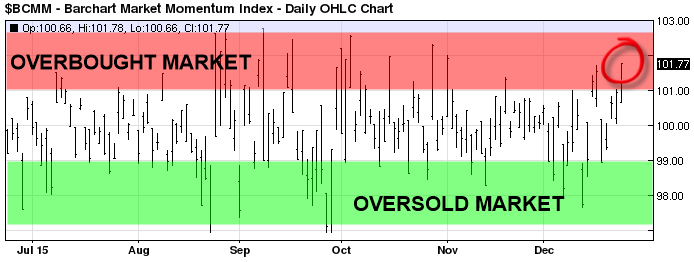
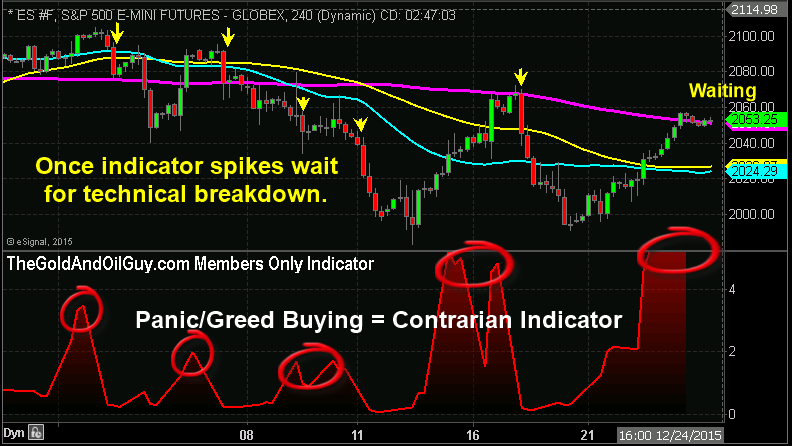
Attached are couple charts that show where the market is currently trading with my short term analysis and why XLE position was closed yesterday. The market is primed for a sharp correction which may start Monday and if possible, we will take action, but volume will likely remain light for the rest of the year and first couple days of January, so the top may drag out a few more days. Let’s wait for a technical breakdown first before buying inverse ETFs.
I would like to thank all my followers and subscribers for their support and kind words throughout the year. It has been an extremely difficult market to trade with the broad market trading in a Stage 3 Distribution pattern. Hedge funds, mutual funds and those who hold individual stocks in their portfolio are all down sharply for reasons I have explained and warned about all year.
Early in 2015 I published a short book talking about how the US stock market was showing significant signs of a topping along with many timing cycles and events that were also unfolding and pointed to a new bear market that will likely last through 2016 and into 2017. Thus far, everything has unfolded as expected and once this Stage 3 Distribution pattern breaks down a new bear market will have confirmed and all kinds of huge trades will start to unfold. It will be a VERY DIFFERENT year than 2014 and 2015.
HOLIDAY SPECIAL – GET 12 MONTH OF TRADE ALERTS FOR THE PRICE OF ONLY 6!
https://thegoldandoilguy.com/wp-content/uploads/2014/06/etf-trading-newsletter-alert.jpg121144adminhttp://www.thegoldandoilguy.com/wp-content/uploads/2014/11/tgaoglogo.pngadmin2015-12-24 15:07:412015-12-24 15:07:41Closed Another Winning Trade And New Forecast
Here we are again, down to the wire for us guys (if you are a guy) to get our Christmas shopping done, with only couple days left before it’s too late.
The question many of us are asking ourselves is what to get our family, friends, boss, partner etc. for the holiday season?
In a recent radio interview I did with Jim Goddard of HoweStreet.com we talked bout how there really was not anything really new and exciting on the technology side of things this year. Apple finally came out with the idea I had the first day I Apple TV box came on the market when I had to type in what I was searching for with that tiny little remote. My idea along with everyone else I’m sure was why not have a mic on the remote so we could just say what we wanted it to type… Now, YEARS later with this simple yet great feature has been added to the product.
I have new product and gift idea which costs a quarter of the price of the new Apple TV box, and will allow the entire family and friends to enjoy the benefits each and ever day!
This new product has patent and trademark pending filed for Lomiko Metals Inc. This small company is publicly traded and is in both the resource and technology industries (TSXV: LMR) (OTCQX: LMRMF) (FSE: DH8B) (“Lomiko”) Lomiko.
Your Next Holiday Gift – The Spider Charger(TM)
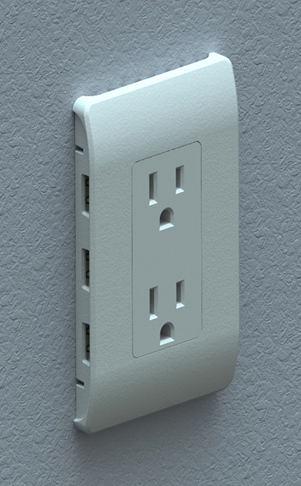
Lomiko commenced a Kickstarter campaign to fund safety certification of the Spider Charger, an in-wall USB charging device that sets a new standard for energy efficiency and convenience for today’s connected consumer.
The Spider Charger is able to safely charge up to six devices with USB connections. It works with any type of mobile phone, computer, camera or other electronic devices.
“The Spider Charger appeals to end users who value high energy efficiency, convenience, and sleek aesthetics. Our product features an easy-to-install designer-coordinated package that incorporates the latest advances in miniaturized power management technology. This puts the Spider Charger head and shoulders above bulky power bars that plug into conventional wall outlets.” State A. Paul Gill, CEO of Lomiko Technologies.
How Does the Spider Charger Work?
The Spider Charger installs flush and out of sight in place of an existing conventional wall outlet. That means it’s far more elegant and discreet than plug-in alternatives. But the Spider Charger’s true advantage lies in the fact that the two conventional wall receptacles remain unobstructed when using the USB ports. Unsightly and crowded wall receptacles can be a thing of the past.
The Kickstarter campaign will raise funds to help cover the cost of obtaining safety and green standard certifications which will qualify the product for commercial use, specifically in new green buildings.
Lomiko’s research has shown that a market niche exists for airport terminals, hospitals, coffee shops and office buildings for a product with multi-charging capability. I am putting one in my kitchen island for charging my families 3 iPads, 2 iPhones, and my daughters iPod.
The Spider Charger offers the most USB ports in a conventional outlet, in addition to its unique energy saving capabilities and sleek design.
This brand new product will be delivered within a couple months on a first come first served basis. I’m very excited about this product and will be putting one in my kitchen island, my office, and will be an extra upgrade/selling feature to tenant’s in all my rental properties. While this may not be the most exciting product on the surface, it’s something we need and use every day making this gift idea a great family and home present.
Buy, Invest and Help Promote the Spider Charger for Profits!
Several months ago heard about this product coming down the pipeline for Lomiko and it caught my attention because it’s a simple concept, affordable, and everyone need it.
So I took part in their last private placement and own a large chunk of shares. Why? In anticipation of a couple things. First I like their resource side of the business and equity stakes they own in various tech companies. Also, because they have the Spider Charger product which will hit the market early next year.
Lomiko is still a tiny company and in the early stages of development. Their resource of Graphene deposits and mining are making great progress but as we all know the mining sector has been under pressure and permits/approvals take time.
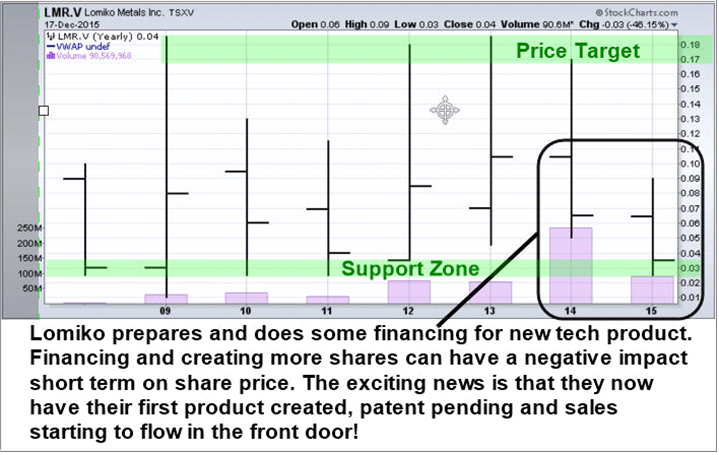
I see great upside for Lomiko in the years to come and if you take a look at the chart below take not of these key points:
In 20112. 2013, and 2014 Lomiko has identified large Graphene deposits showing they have rich resources in the ground to build a strong business. This caused triggered strong buying in shares during those years. Several 300+% rallies.
More recently they have raised capital via Private Placement (selling new shares to investors in exchange for capital). While this is needed to move the company forward, it is seen as a negative for current shareholders in the short term.
Lomiko just received an updated Buy Recommendation from See ThruEquity with $0.19 Target Price is a potential 375% gain!
Holiday Gift and Investment Opportunity Conclusion:
In short, I have presented as simple and affordable holiday gift idea for your friends, partners, bosses, family members, office etc… Also, you have the potential to own shares and help get this product into homes, stores and businesses which in turn will provide more exposure for the product and eventually boost the share price to new highs.
With Lomiko taking great strides forward with their graphene resource business, their new tech product, and with share prices trading at major long-term support, and a new resource bull market set to start in 2016, this little company is a hidden gem.
Disclosure of Interest and Advisory Cautions: Nothing in this report should be construed as a solicitation to buy or sell any securities mentioned. Technical Traders Ltd., its owners and the author of this report are not registered broker-dealers or financial advisors. Before investing in any securities, you should consult with your financial advisor and a registered broker-dealer. Never make an investment based solely on what you read in an online or printed report, including this report, especially if the investment involves a small, thinly-traded company that isn’t well known. Technical Traders Ltd. and the author of this report has been paid by Lomiko Metals Inc. In addition, the author owns shares of Lomiko Metals Inc. and would also benefit from volume and price appreciation of its stock. The information provided here within should not be construed as a financial analysis but rather as an advertisement. The author’s views and opinions regarding the companies featured in reports are his own views and are based on information that he has researched independently and has received, which the author assumes to be reliable. Technical Traders Ltd. and the author of this report do not guarantee the accuracy, completeness, or usefulness of any content of this report, nor its fitness for any particular purpose. Lastly, the author does not guarantee that the company mentioned in the reports will perform as expected.
https://thegoldandoilguy.com/wp-content/uploads/2015/12/lowgift.png194168adminhttp://www.thegoldandoilguy.com/wp-content/uploads/2014/11/tgaoglogo.pngadmin2015-12-21 17:48:162015-12-21 18:18:19A Holiday Gift and Investment Opportunity
Before I dig into the nitty gritty of this potentially sweet trade setup, I would like to first wish everyone a Merry Christmas and Happy Holiday!
Being from Canada, I’m very lucky to be able to spend quality time with my family for the next month down in the sunshine state of Florida. I sure love the ocean breeze, sand between the toes, palm trees, and heat. Its amazing how cold Floridians make a sunny 70-degree day look being all bundled up in pants, jackets, and hats while I live in my bathing suit practically the entire time I’m down here. I don’t put on pants or a sweater until its 65ish outside or a restaurant demands I must wear pants and I’m still sweating wearing all that clothing. Its great to be back in America!
Ok, lets get back to this sweet trade setting up!
In this article, I show you my analysis and share my thoughts on what is likely to take place with sugar looking forward 2-3 months if not longer. Instead of writing a long article I have attached three charts which clearly show my thinking and price projections.
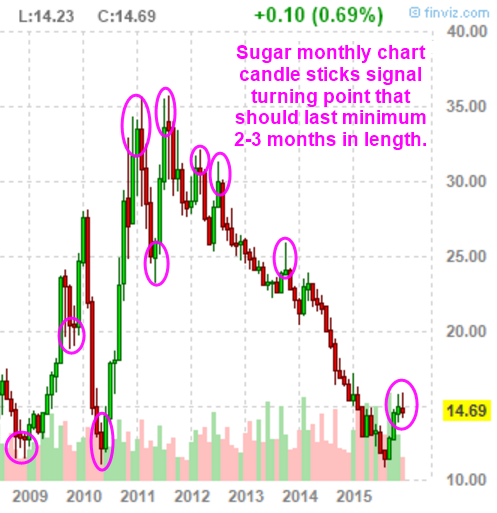
MONTHLY CHART OF SUGAR
The monthly chart moves as slow as molasses for trading and investing, but it does provide valuable information. The key data it shows us are the major trend, support and resistance levels, and potential reversal signals via candlestick patterns.
Typically, if a chart shows a long lower or upper wick it signals price has found either support or resistance and a change in direction is likely to occur.
The chart below is currently showing up what I call “Tweezers”. Two candles both with long upper wicks which tell us seller are present and selling into the buying pressure. This is a great signal that lower prices are very possible. You should keep in mind that we are only half way through the month of December which means this candle still has another 10+ days of trading before it closes. So this is not a true tweeze pattern until the month is over.
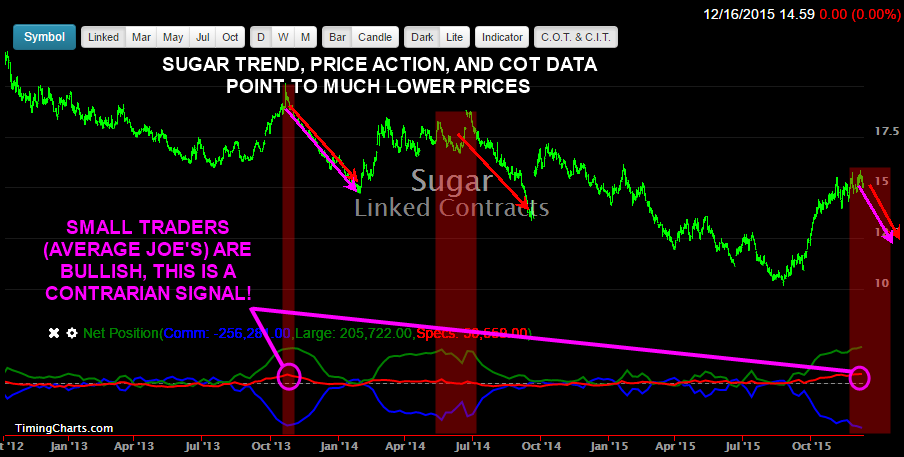
DAILY CHART OF SUGAR & COT DATA
This chart below shows some very interesting data which one of my subscribers pointed out a couple weeks ago. I have been watching the price of sugar waiting for a potential setup to form and it looks as though the time has come which I will show in more detail later in this article.
What I like most about this information is the COT data. Specifically, the spec traders position which show the average joe/gamblers are all very bullish trying to get their sugar fix J.
Typically, the small spec positions are based on emotions and when everyone is doing something, people don’t like to be left behind so they follow the herd mentality, BUY BUY BUY!
As you can see in the recent trading the price of sugar has been chopping around with increased volatility, which tells me sellers are entering the market.
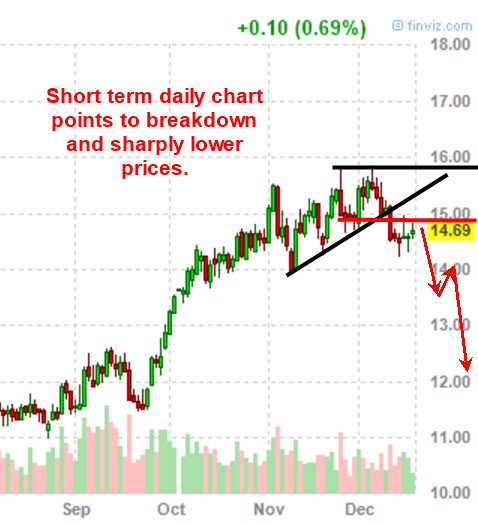
DAILY CHART OF SUGAR TRADE SETUP
Below I have laid out visually the key resistance levels for sugar. Ideally, the sooner price breaks down the lower price are likely to fall as it will have strong momentum. If price lingers and moves above the $15 level for several days, then it won’t be as bearish of a setup in my opinion.
The breakdown that I have drawn on the chart with red arrows shows the best case scenario. Unfortunately, there is not an inverse EFT for sugar. For one to profit from falling sugar you will need to short sell the sugar ETF SGG.
I should mention that earlier this week I sent out a great trading opportunity that would allow you to easily trade indexes, all commodities, currencies and even the most popular 50 stocks using what I use. Its commission free trading, you can trade 24 hours a day, and place any position size you want as little as $15 on sugar or the SP500 index. It’s the ultimate way to learn to trade while trading live without losing a ton of money. And to sweeten the deal, if you use my special link here you can get free trading cash to start! Special Trading Opportunity:CLICK HERE
SUGAR TRADE SETUP CONCLUSION:
In short, I think sugar is/has setup for a short trade and will fall over the coming months. Nothing in the financial market is for certain, but I do like this trade setup for a small speculative position.
Stay tuned for more trading ideas as I have a great Holiday Gift Idea and Trade that I will share in a few days… So get on my email list, or join my premium trade alert newsletter and get all my trades, analysis and educational videos so you can master the markets and profit for life!
https://thegoldandoilguy.com/wp-content/uploads/2015/12/tis.png200262adminhttp://www.thegoldandoilguy.com/wp-content/uploads/2014/11/tgaoglogo.pngadmin2015-12-17 20:27:272015-12-18 18:23:41A Sweet Trade Setup for The Holiday Season – ‘Tis the Season!
We are approaching the most anticipated and crucial week of the past seven years, and the global markets have been selling off. Last week, saw crude oil, junk bonds and the stock market competing with one another, while on their way down. Is there a connection between the three, or is it just a co-incidence that all three have fallen concurrently? Is the fall of one market, signaling a warning sign to the other(s)?
If you have any interest in either market, by way of investments, or if you are planning to become a part of the market, this article is for you. The junk bond markets are flashing a red signal, therefore, you should heed the warning.
What are junk bonds and why are they important?
The bonds issued by companies, which have a low credit rating, are termed as “junk bonds”. Due to their weak balance sheet and their dubious track record, these companies are considered risky. So why would anyone invest in this instrument? With the Fed keeping interest rates near a zero level, for the past seven years, the hunger for higher returns have led many to invest in the “junk bonds” (which offer very high returns compared to the treasury bills).
What is the size of the bond market?
The total bonds issued, since the last financial crisis, have now crossed $9.3 trillion. Yes, you read correctly; it is a trillion with a ‘T’. The bonds issued in 2014, reached a record level at $1.3 trillion and the year 2015 has created another new record. According to the Financial Times, 50% of the bonds issued by the corporate world, are rated as “junk”, (this figure was at 40% during the 2007 financial crisis). What is corporate America doing with such massive debts?
Has all this massive debt incurred by companies, been used for infrastructure, R & D, upgrade technology or for improved businesses? No! Most of the debt has rolled back into the stock market, in the form of buybacks and dividends. According to Bloomberg news, 104% of the profits earned by the companies in the S&P 500 were used for buybacks or dividends during the first quarter of 2015. Surprised? Don’t be. They went on to say that the last time the figure crossed 100%, was in the second quarter of 2007 and it peaked at 156%, two quarters later. We all know what happened to the stock markets after 2008.
Is it different this time, and will the companies return the money?
If you think so then you are in for surprises, if you think so. According to S&P, the 12-month default rate on junk bonds was at 2.5% in September 2015, up from 1.4% in July 2014. The S&P has downgraded 297 companies within the first three-quarters of this year and upgraded only 172 companies. The rate of the downgrades are the worst since 2009.
According to Bloomberg, the profits of the S&P 500 companies have fallen by $25 billion in the first three quarters of this year. On a share-weighted basis, the profits were down 3.3% on the year in the third quarter (the worst performance since 2009). The fourth quarter earnings are expected to be down by 5%, which will make it three consecutive quarters of negative earnings growth, this year. Aggregate revenues of the group were down by $287 Billion over last year. 17% of all the junk bonds are held by the companies within the energy sector, and with crude oil prices threatening to break the 2009 lows, it is anybody’s guess as to how many of these companies will be able to honor their payments.
The FED is set to raise interest rates in the coming week!
The FED is most likely going to raise rates, for the first time, in almost a decade. The yields on the short end of the market have begun to react and are at their highest level since 2009. With interest rates set to rise, many investors are likely to pile up on the investment grade bonds, rather than remain in the “risky ones”.
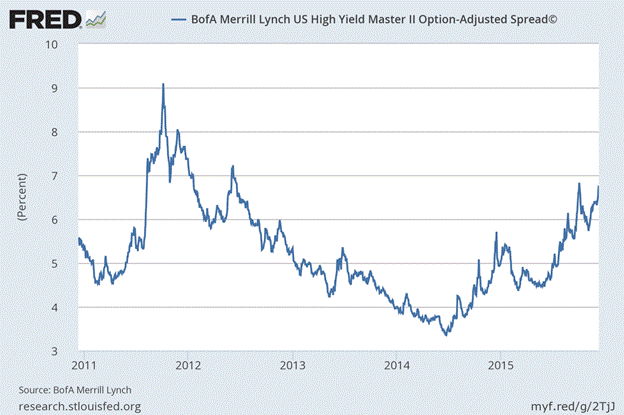
Difference in yields between investment grade and junk bonds
The below chart shows the difference in yields between the treasury securities and the dollar-denominated “junk bonds” issued in the US. The spread which reached a low in June of 2014 has been rising consistently, and has reached its highest level since 2012, at 6.71%. It is threatening to close the gap of the highs seen during the 2011 European crisis.
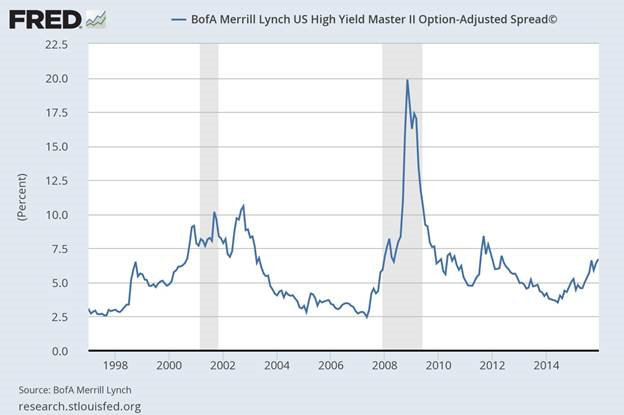
The next chart, shows the movement of the yields, since 1996. It can be seen that barring the last time, whenever we crossed 7.5% levels, the US experienced a recession, as denoted by the shaded area in the graph. In 2011, the US Fed was injecting large amounts of QE into the markets, which helped, but with the US Fed expected to hike rates in the coming week, the picture looks bleak.
Frightened? Do you want to redeem your investment in the “junk bonds”?
The investors of the Third Avenue Focused Credit Fund, also wanted their money back, but the Third Avenue Management “blocked” investors from withdrawing their money and has announced the liquidation of the fund. The investors will now receive a cash distribution on December 16th, 2015, and periodic distributions from the liquidating trust, over the course of the next year.
The Wall Street Journal reported that a few hedge funds are also following the same path as Third Avenue Focused Credit Fund. Hedge-fund firm, Stone Lion Capital Partners, L.P, Caryle Group LP’s and Claren Roan Asset Management, LLC have all taken a similar action and have suspended redemptions.
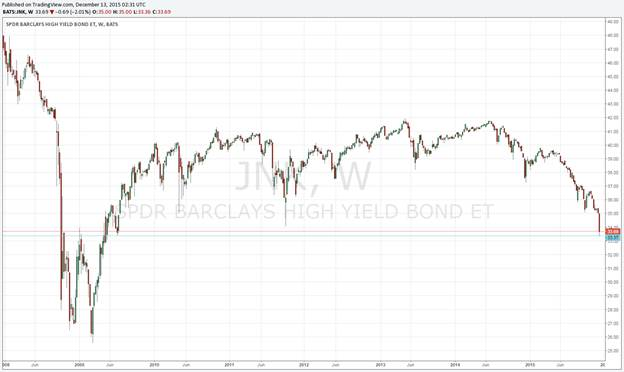
SPDR Barclays High Yield Bond ETF (JNK) is at 2009 levels
The chart below speaks for itself. The drop on the right side, shows the rate at which the ETF has been falling. It’s close to its July 2009 levels, the closing on Friday marked by the red line, on the chart, is very close to the final support marked with the blue horizontal line. Below this support, we will likely see a retest of the lows of 2009.
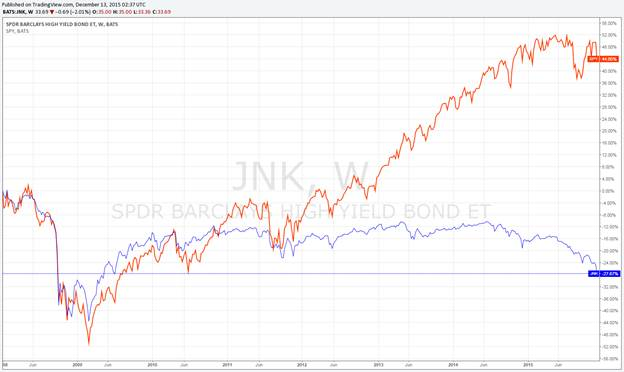
The next chart, shows a comparison between the ETF and SPY. There has been a long-term divergence during the rise of the stock markets, but the similarity of the fall in both the SPY and JNK can be seen on the left hand side. This indicates that the stock markets have a long way to fall and in order to close the gap between the two. The findings of the chart do not bode well, for the stock markets, in the coming months.
Conclusion:
The large drop in JNK to 2009 levels has the markets in a state of fear and panic. With the FED likely to raise rates this week, the markets look to be on shakey ground. With the makings of the bond market, which is considered to be a precursor to a stock market top which seems to be in place. The path of least resistance of the stock markets is down. To all investors who are planning to buy this drop, Think twice! This is not a “Buy the Bounce Event”.
If you want to know trend in various asset classes like stocks, select sectors, gold and silver then be sure to join my trading and investment newsletter at www.TheGoldAndOilGuy.com
Chris Vermeulen
https://thegoldandoilguy.com/wp-content/uploads/2015/10/vermeulen101415-1a.jpg112177adminhttp://www.thegoldandoilguy.com/wp-content/uploads/2014/11/tgaoglogo.pngadmin2015-12-15 14:45:222015-12-15 14:47:50The crash of junk bonds is indicating something that has yet to happen in the Stock market!
The energy markets are tanking and are at levels that have not been seen since “The Recession” of 2009. Opinions are divided on the effects of the fall. Some say it is good for consumers, whereas, others say it is bad for the global economy. This article will analyze the overall effects of low crude oil prices on the industry, the major oil-producing nations, consumers and the overall global economy. The severity of the fall can be seen in the chart below.
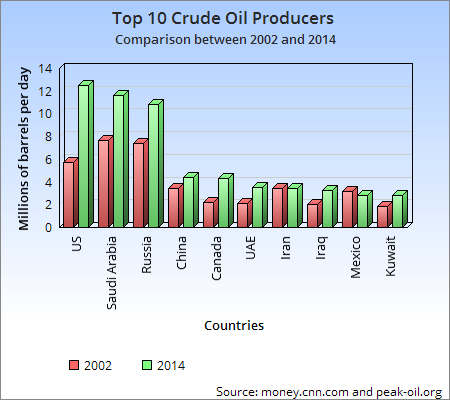
Top 10 crude oil producers which are being affected:
A glance at the charts of the top 10 crude oil producers shows the clear shift from Saudi Arabia to the US, as the largest energy producer in the world.
An analysis of the top producers of oil gives us a clear picture of the effects of this fall on the global economy. Does the drop in price have far-reaching effects, which may lead to geopolitical tensions in the world? Is the power to decide the pricing shifting from the hands of the OPEC nations, for the first time in decades? Are the low prices laying a base for a much larger uptrend in the future?
Effects of low crude oil prices on the US economy:
The US is both the largest producer, as well as the largest user of crude oil, in the world. Domestic supply caters to 50% of the daily needs, and the other 50% is imported, from around the world. The production from the US Shale wells have increased rapidly, in the last few years, and the industries associated with shale oil are being crushed.
Shale oil drilling is unprofitable at these levels:
The boom in oil prices, and an improvement in fracking technology, has led to a rapid growth in the number of shale oil wells. However, according to various reports, most of the shale oil wells are profitable only when priced above $60/barrel. Some of these companies have taken large loans, in order, to expand their production, and with prices remaining low, these loans are likely to become unserviceable. A failure of the companies with heavy loans is likely to strain US Banks, which have loaned the monies to said companies. Along with the crude oil producers, the associate industries ie: the equipment suppliers, the hotel industry, the truck companies, etc. are also struggling, due to a decline in prices.
With many drillers cutting costs, unemployment within this sector is on the rise, and wages are either stagnant or being reduced. New investments are being postponed. Associate companies, which supply to the oil producers, are slowly going “out of business”. As the US economy is very diverse, the overall impact is not alarming, however, US States that are dependent on the shale oil drilling, will almost certainly take a hit.
Advantage to the Consumers and the Auto Industry and the Airline Industry:
Auto and airline industries are welcoming the drop in prices. Consumers, also have more disposable income to spend for their holiday shopping this year, due to lower gas prices at the pumps. According to Goldman Sachs, US households have around $150 billion to spend this year, due to the fall in crude oil prices. If the price remains low, the domestic consumer will become the beneficiary!
Deflation:
The FED is struggling to increase the inflation figures to around 2%, but with low energy prices, fears of deflation are ever increasing.
Effects of low crude oil prices on the Russian economy:
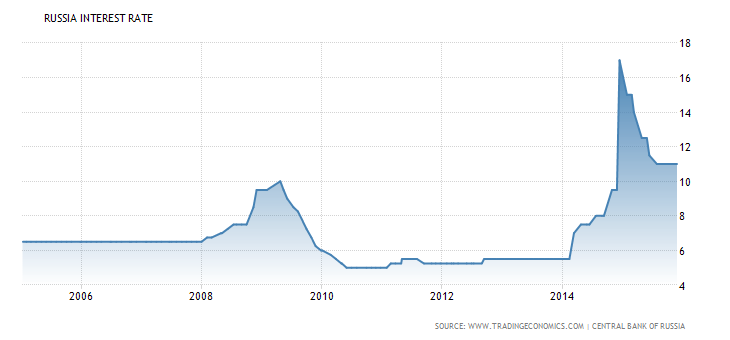
Russia is another major exporter of crude oil in the global economy. The high price of crude oil during 2009-2014, assisted them in recovering from the crisis. However, with oil prices ‘tanking’, the Russian economy is now struggling. According to bbc.com, oil and gas contribute 70% of the export income for Russia. Every dollar drop in the price of crude oil impacts the Russian economy by $2 billion worth of losses.
With the Russian economy struggling, due to low crude oil prices and Western sanctions, it raised its interest rates to 17% this year, in order to stem the run on the Ruble. Refer to: chart of the Russian interest rate as shown. If the oil prices continue to stay low, Russia will struggle with its federal budget, since it mainly depends on the profits of crude oil. Some believe that President Putin is likely to resort to actions which will divert the attention from his struggling economy, and thus create geopolitical tensions in the world wide.
Source: Central Bank Of Russia and tradingeconomics.com
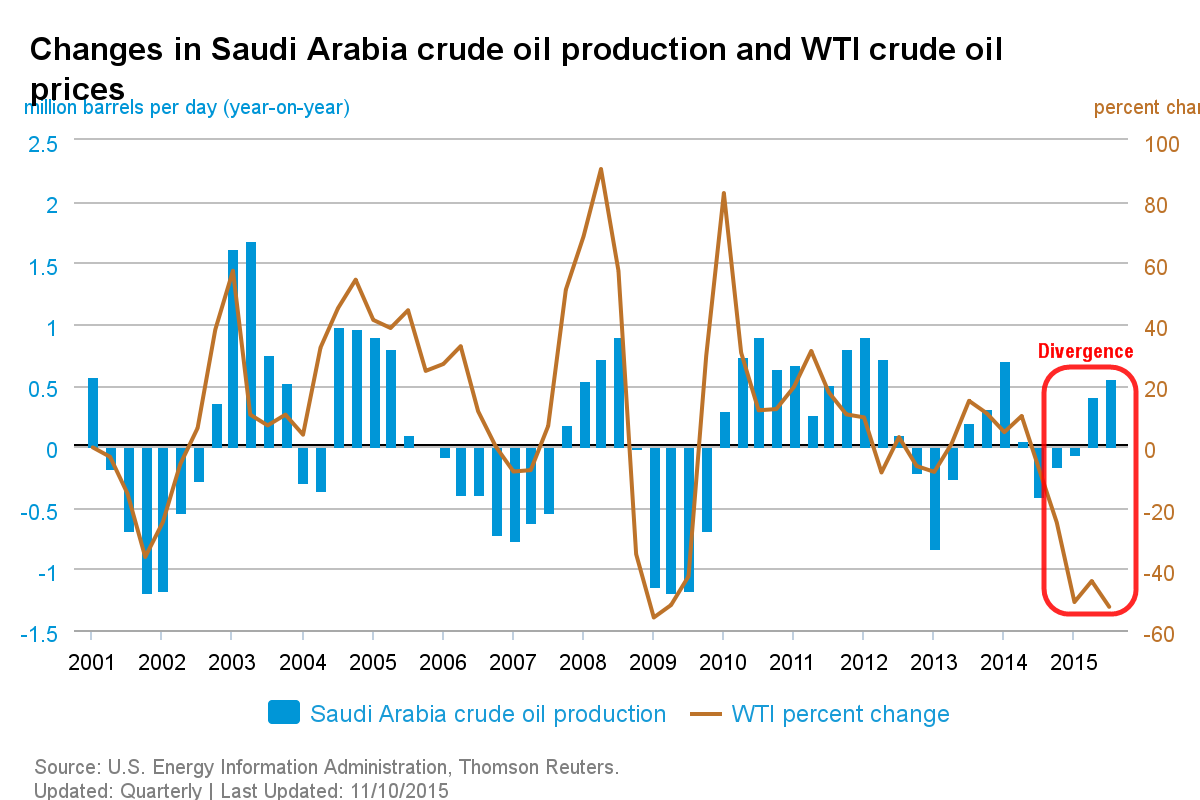
Effects of low crude oil prices on OPEC:
OPEC consists of twelve countries that produce 40% of the world’s crude oil demand. Saudi Arabia has been the leader of the OPEC nations and its change in production has significantly impacted the price of crude oil. For the first time in years, it looks like Saudi Arabia is losing its status as the decision maker of crude oil prices in the world. The divergence in price and the increase in production of crude oil, by Saudi Arabia in 2015 in the chart below is an indication of its declining power as price and their production have moved together in the past.
The recently concluded meeting of OPEC, on December 4th, 2015, showed the divide among the OPEC nations. The smaller nations like Algeria, Venezuela and Ecuador are all reeling under the effects of low crude oil prices, and their efforts to force a ceiling on the total production was rejected. Though Saudi Arabia has strong foreign reserves, which can support its economy and aid in pumping oil at these low price rates over a long time, it too has begun to feel the pain. The Saudi stock market is down 27% from its high of this year.
Lower oil prices can lead to a crisis in the middle east region similar to 2010:
The international rating agency of Stand & Poor’s reduced the sovereign rating of Saudi Arabia by one notch in October 2015, with a negative outlook. Stand & Poor’s expects Saudi Arabia to have a budget deficit of 16% of its GDP, in 2015. There are unconfirmed reports of an internal power struggle of the throne, in the oil-rich nation. Any power struggle in the Kingdom of Saudi Arabia is likely to destabilize the entire Middle East region.
The Study of the price needed by various countries in order to balance budgets:
The chart below clearly shows that the current price of crude oil is not favorable to most of the nations. Many are bleeding heavily, due to the lower oil price and are struggling to fund their budgets. It won’t be long before the chinks in the armor of the weaker nations will begin indicating whether prices remain low, for a long time.
Low crude oil price is not a negative for all countries:
Oil importing countries like India, Japan, China, and some Western European countries have actually benefited from lower crude oil prices. China has been a major net importer of crude oil in recent years. With the Chinese economy slowing down, a fall in crude oil prices will help by increasing its foreign exchange reserves. However, only a fall in crude oil may not be sufficient enough to prop up the Chinese economy. For a few countries, like India, the fall in crude oil prices is good news, as it will help them control their current account deficit.
Another Crisis in the making:
However, the major ill effect of this fall has been the fears of deflation in Japan, Europe and the US. The ECB, the FED, and the BOJ are all struggling to bring inflation to around 2% so as to avoid deflation, but thus far they have failed. If prices remain low for a considerable period of time, it may lead to another crisis with deflation at the core.
Conclusion:
Saudi Arabia likely wants to keep the price down so the US Shale producers to go “out of business”. However, the US Shale production has been resilient so far. Russia is also at its highest output and Iran is expected to increase its output in the coming months and therefore, many oil-dependent countries are finding it difficult to handle their budgets. The strain among the countries taking opposing sides was evident during the recently completed OPEC meeting on December 4th, 2015.
If price remains low for too long, it is sure to cause geopolitical tension, lead the economies of Europe, the US and Japan towards deflation. Oil producers will have to cut production, in the future, as the low price is unsustainable in the long-term. When this starts to occur crude oil price will find a bottom. I will keep you updated regarding the time to enter oil, for long-term gains in the future. But until then follow my analysis and forecast.
HOLIDAY TRADE ALERT SPECIAL GET 12 MONTHS OF TRADE ALERTS FOR PRICE OF 6! www.TheGoldAndOilGuy.com
https://thegoldandoilguy.com/wp-content/uploads/2014/07/oil.png172151adminhttp://www.thegoldandoilguy.com/wp-content/uploads/2014/11/tgaoglogo.pngadmin2015-12-12 14:55:282015-12-12 14:57:15Are Low Crude Oil Prices a “Boom Or A Curse” For The World Economy?
Today will be a big day for the European Central Banks (ECB) as they are on opposite sides of the FED. FED Chair Dr. Yellen appeared before Congress today to make her case to increase short-term rate at the FED on December 16, 2015.
“WASHINGTON – Federal Reserve Chair Janet Yellen tells Congress that economic conditions are falling into place for policymakers to raise interest rates when they meet in two weeks — as long as there are no major shocks that undermine her confidence.
Yellen says that even after the first increase, rates will still be at very low levels, which should encourage more borrowing by consumers and businesses.
In testimony before the Joint Economic Committee, Yellen says further delays in a Fed rate hike could force the central bank to tighten credit too quickly later. Such an abrupt move could push the economy into a recession.
Fed policymakers meet on Dec. 15-16. The Fed’s key short-term rate has been at a record low near zero for the past seven years.” Source: news1130.com
The SPX continues to find resistance at the 2100 resistance level. The market and its participants seem to lack any enthusiasm.
It’s my belief that the markets are awaiting a big news release from the FED regarding a “potential” rate increase which the markets currently does not favor.
Will there be a FED increase in the Fed Fund Rates or is this much to do about nothing AGAIN! Is the FED going to continue to kick the can down the road even further? That is the million dollar question. History shows us that the fed typically raises rates a little near just before a bear market starts in hopes they can continue to convince the masses (investors) that the economy is fine and dandy, nothing to worry about. And its that rate hike that tips the scale, triggers a bear market and clobbers the average investor holding stocks in their portfolio. I talked about this in a recent interview I did with Jim Goddard on HoweStreet.com.
Inflation continues to decline at home and abroad. The FED’s measure of inflation, the core PCE deflator, is running at about a 1-percent annual rate which is half of the Fed’s stated target.
On Tuesday, December 2, 2015, Oil broke its “psychological level” of $40/barrel to $39.84. The last time this occurred was back in 2008, when the price of oil crashed below $40/barrel just before the stock market collapsed. Now, it has happened again.
The bond yields of the 10 year treasuries (TNX) have been declining over the past few days. The 20 year Treasury bond ETF (TLT) is rising and currently closed last night at 123.04. Apparently, they have serious doubts about any FED rate increase as well.
Any increase, in short term rates, by the FED would be a catastrophic mistake. It would have severe global consequences. An interest rate hike will just push the U.S. Dollar even higher. The rising U.S. Dollar is already crippling emerging markets all around the globe.
This would turn out to be a tragic mistake by the FED?
The strong rally in the US Dollar since the past year has led to commodity markets selling off as investors pursued the equity markets led by years of accommodative monetary policy in a search for higher yielding assets. However, what goes up must eventually come down and the US Dollar is no different. With the markets trading at extremes the markets are likely to see a correction in the near term as the US Fed prepares for interest rate liftoff this December. Given the current monetary policy conditions and the markets being prepped for a rate hike, there is further upside to the UUP while the price of Gold continues to decline to new multi-year lows.
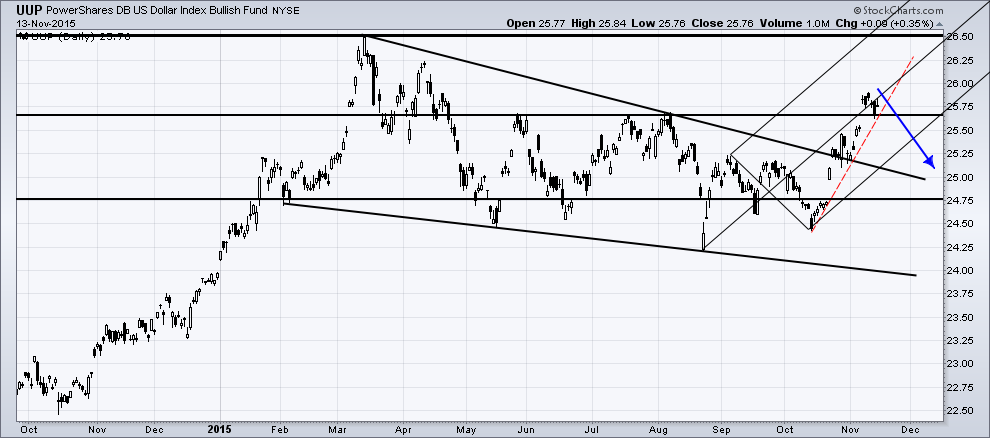
UUP – Powershares DB US Dollar Index
The UUP Powershares DB ETF which tracks the trade weighted US Dollar Index has gained a further 5.56% on a year-to-date basis, while rallying a massive 18.06% since early 2014. The strong momentum in the US Dollar Index was largely due to the efforts by the US Federal Reserve which deployed the unconventional monetary policy tools, the QE or Quantitative Easing in a bid to stimulate the economy. While the UUP has been on a strong parabolic uptrend, commodity markets have been trending lower, clearly reflecting the deflationary pressures, or rather the lack of inflation.
The UUP touched multi-year highs of 26.50 around March this year as the Fed prepared the markets for a potential rate hike (which got kicked down the calendar and is now slated for an imminent rate hike in December).
UUP recently broke out from its large descending triangle pattern and also closed above the short term support/resistance level at 25.65 – 25.7. Marking the minor trend line connecting the lows of 14th October, 24.43 and 2nd November 25.18, the steep rising trend line will be an important trend line to watch. As long as prices hold above the trend line, UUP could see further upside with the most immediate target coming in at 26.50.
To the downside, support comes in at 25.75, which if tested can offer a good price level to enter long on the UUP.
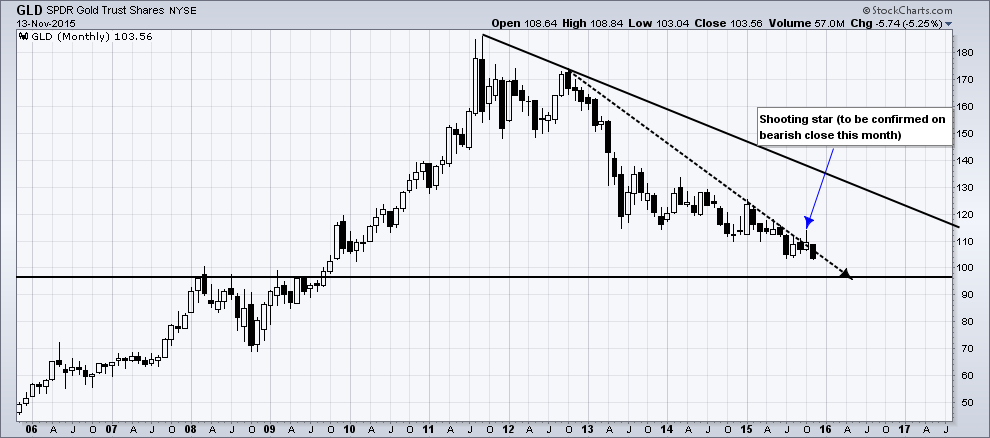
GLD – SPDR Gold Shares ETF
The SPDR Gold shares ETF, on the weekly charts shows that Gold prices have been trending in a gradual downtrend with the most recent price action attempting to break out from the minor trend line, but failure to hold above the trend line break saw a strong decline lower. There is a long term support/resistance at 98.71 region, which looks to be quite likely to be tested in the next month or two. A dip to the 98.71 will most likely offer a bounce back higher.
Looking at both the UUP and the GLD charts, it is quite certain that we can expect to see the US Dollar continue to trend higher, although the momentum is slowing down in UUP. Likewise, GLD is trading close to the 98.71 level. An interesting view is that the GLD’s monthly chart is the shooting star pattern that has been formed. Although we need a confirmation by having a bearish close this month (November 2015), the shooting star pattern validates by the rejection of the minor trend line. A dip down to 98.71 would confirm the multi-year correction, which should potentially mark a bottom in Gold prices.
To conclude, the UUP US Dollar is trading close to multi-year resistance levels and a breakout to the upside would send a shocking blow to gold, silver and other countries.
The Fed Rate & Dollar Will Move the World
The US Dollar rallied to 100.36 in the European trading session last night. It is re-testing the yearly high of 100.39 made on March 13, 2015. That was its highest level since April 2003. As the US Dollar rallied, gold and silver continued to fall. Both made new 5-6 year lows last week, with silver dropping to $13.85/oz. on Monday, November 23 2015, and Gold testing $1050/oz. on Friday, November 27, 2015.
World equity markets continued their rallies last week, with many reaching their highest levels since early August 2015. The SPX resumed it “corrective” uptrend in order to complete the final last stage of this past bull market. Entering December this week, market watchers will intensely focus on what the Federal Reserve Board will do with their short-term rates. It seems almost a given that they will announce a rate hike. This Friday, December 4, 2015, the payroll report could likely be the catalyst for that decision.
With ‘global growth’ occurring worldwide, why are central banks around the world continuing to hit the panic button?
Europe, Japan, Sweden and Switzerland are continuing to devalue their currencies and cut interest rates to record lows, while others seem to be resorting to negative interest rates in order to stimulate growth. This is not supposed to be happening after seven years of ‘economic recovery’.
The FED could raise rates in December 2015. If they do, this could throw the U.S. economy into a depression.
The FED has been telegraphing the markets, implying that they are going to raise the FED Funds rate by 25 basis points next month during their December 2015 FED Meeting. The financial markets think they are serious this time and, therefore, have been pricing in this 25 basis point rate hike for the past six weeks.
The FED has told us that they have been ‘data-dependent’ for the past seven years, regarding changes to monetary policy. So, the real questions are; what has really changed in economic data, for the positive? Why now, of all times, do they decide to raise rates? Are they raising rates for the right reasons?
The above are just some of my concerns as the FED embarks upon their final FOMC Meeting on December 16th, 2015.
Is the FED motivated to raise rates now, just to show that they can actually raise rates? It is obvious to everyone in the global financial markets that there is no need to raise rates. Actually, the FED should have raised rates three or four years ago or, at the very least, last year when GDP was more robust during the second half of 2014. Despite them being ‘data-dependent’, the FED missed their opportunity to raise rates then, according to economic data and the overall global economic environment.
With the prolonged weakness in oil prices continuing to keep inflation low, all central banks around the world are expected to further loosen monetary policy.
Mario Draghi, president of the European Central Bank, paved the way for an extension of QE. The Bank of Japan may well decide to go the same way, to bring inflation back to target. In China, the central bank may also cut rates further to stimulate growth. The outlook for emerging markets is harder to gauge. If a FED hike were to trigger turmoil across Africa, Asia and Latin America, countries there may choose to cut rates to help the economy, or increase them in order to deter investors from taking their money abroad.
Higher U.S. interest rates translates to a stronger U.S. Dollar that will depress the value of emerging market currencies, at a time when many emerging economies are already weakening; their currencies have already slumped against the greenback. The FED’s rate rise could exacerbate the emerging economies currency turmoil, and even help precipitate a full-blown crisis.
Even before the most powerful central bank in the world makes a move, the effects are reverberating throughout the global economy. While there’s a supposed probability of roughly 75% that the FED will raise rates, there is still a lot of skepticism. An economic nightmare seems to be unfolding and there is nothing we can do about it but be prepared with our investments to ride out the storm the best we can.