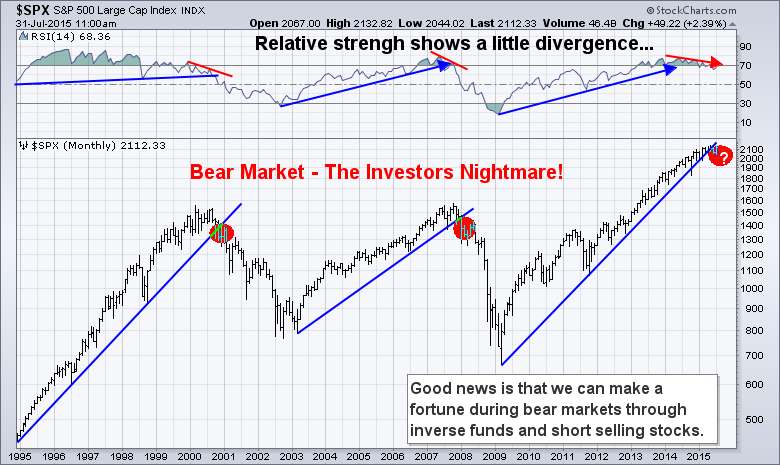
The US stock market continues to grind higher but is doing so with eroding market internals. As the market indexes rise we see fewer stocks moving up to support the move. It’s a matter of time before a large correction occurs.

It seems everyone is calling for a market top, and many have done so for the past 3 years. But the key to success is to follow the market, not predict market tops or bottoms. We follow price trends and trade alongside. We do have a bearish tone looking forward the next 1-2 years for stocks, but we are not calling a market top, nor are we shorting the market in anticipation. Instead, we actively trade the markets smaller trends which occur on a regular basis (weekly and monthly) through active buying, and shorting these smaller trends.

The month of July has been an incredible month for the new and improved automated trading system as you saw from the Results posted recently. The frustrating part is that it takes some time for us to move and integrate this improved system into our platform for our users. While the system is trading incredibly well during one of the toughest market conditions we have experienced in years, we are excited that our users will have these trades executed in their accounts starting September 1st.

Adding to this excitement is the fact that stocks typically fall 3-7 times faster than they rise, which means we can make more money, and make it faster during a falling market then we do from a rising market. Once the major trend turns down (likely later this year) we will be off to the races with out-sized trading gains once again.

Over the next couple months we should start to see the US equities market top, and start its first major correction. Once it start we trade the market in a way that should generate gains as the stock market falls in value.


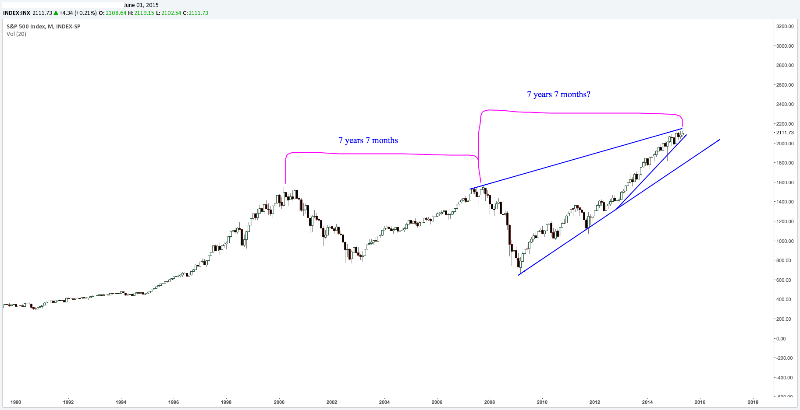
 S&P 500 Monthly Chart – 7 Year Cycle

The SP500 index (US Stock Market) continues to be in and Uptrend.

The major trend line on the chart below must be broken in a big way before a full blown bear market will be confirmed. This is still months away at best. The AlgoTrades INNER-Market Analysis will get us positioned when the time is right and enable us to profit as the stock market loses value.

Your long term equity investments can continue to be held at this point. Speculative and momentum stocks (Russell 2K) continue to show weakness. Large cap stocks will likely be in favor as the safe haven “blue chip” stocks, but when the market is ready to roll over, all stocks will fall.

I do fear a global economic collapse is possible which I talk about in our GoldAndOilGuy Trading Newsletter. But at this time, we do not need to change our trading approach and investment capital. But when certain events start to happen in the USA and abroad we will need re-allocate some of our investment capital, but again, we will keep you updated on this also when the time is right.

1


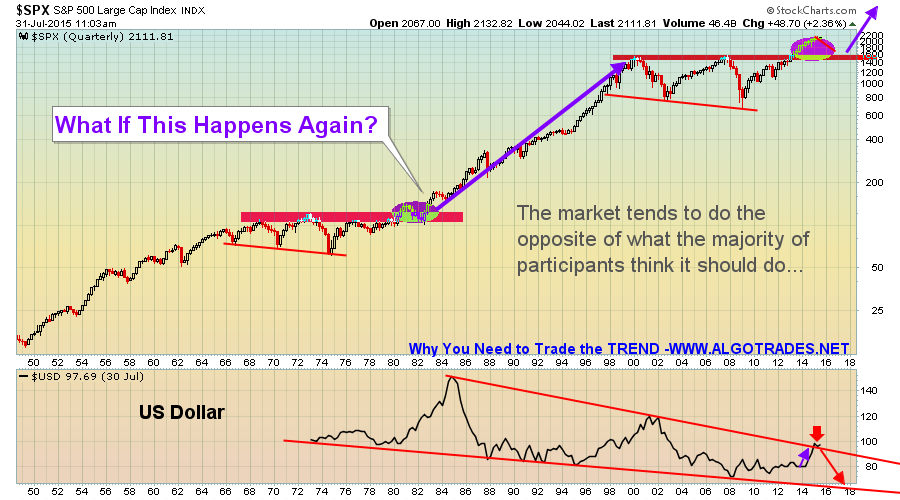
S&P 500 Quarterly Chart – BIGGER PICTURE

This chart I feel provides a great perspective on the overall market trend and price patterns. This is the 70 year prospective. I hope something like this unfolds. Fingers crossed to a nominal 12 month correction/bear market. This will build a new base for the next super cycle.

US Dollar has now reached the upper resistance trend line… we could see weakness in the dollar going forward… Keep in mind this is a quarterly chart, lower prices may still be a few months away.

2


Factory Orders Scream Recession/Correction

This has never happened outside of recession… Year-over-year, factory orders dropped 6.3% (adjusted) but 8% non-adjusted, the most since the financial crisis. Against expectations of a 0.5% drop MoM, manufacturers saw new orders tumble 1.0% and previous months were revised dramatically lower. Factory orders has now missed 10 of the last 11 months. Factory Orders have fallen for 9 of the last 10 months…
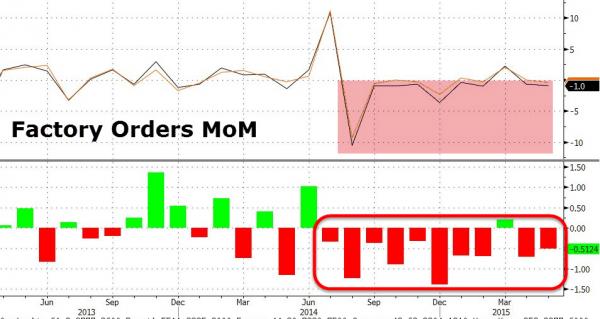
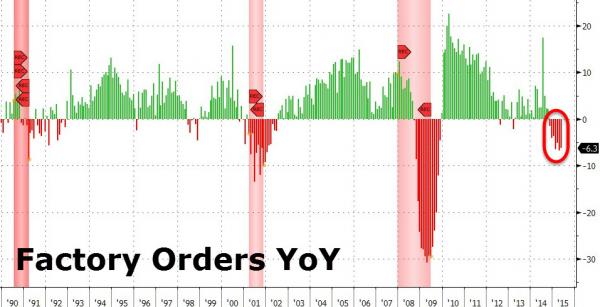
factory1

factory2

Source: ZeroHedge


Also, the New York Stock Exchange and SP500 indexes are losing momentum.

The SP500 index has been trading sideways the over the last 6 months. It has not provided many trades for our automated trading system (AlgoTrades).

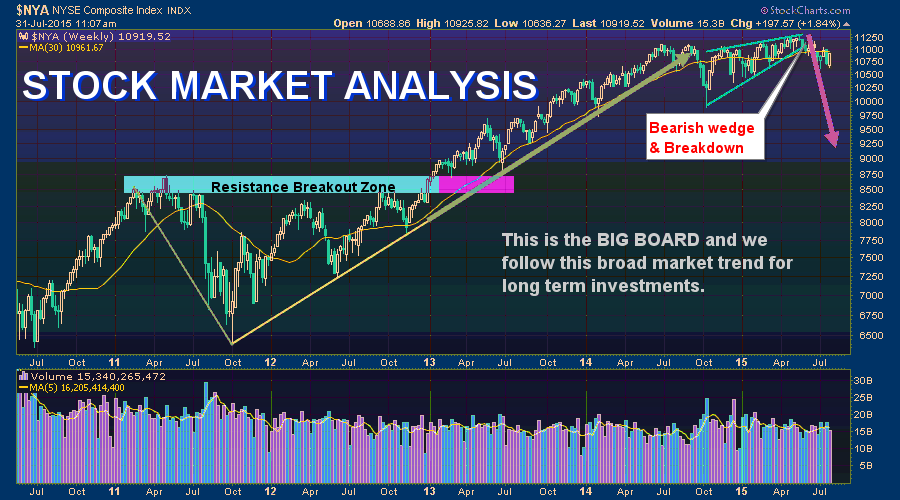
NYSE BIG BOARD STOCKS – Breaking Down

4b 


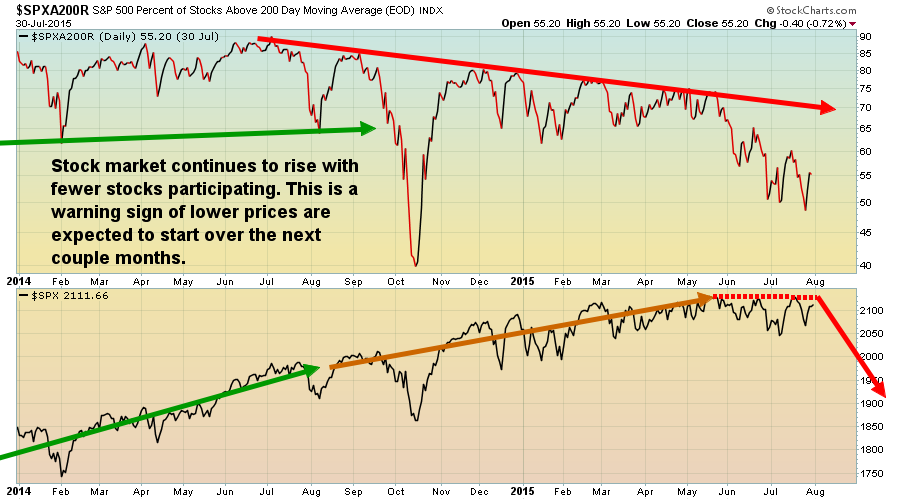
Stock Market Rises with Fewer Stocks – RED FLAG

Since mid 2014 the US stock market has become move volatile. Fewer stocks participating in the markets move up. This can be seen by comparing the percent of stocks trading above their 200 day moving average and the S&P 500 index.

Once the stock market comes to a complete stall it will drop violently. While I am not calling a top yet, understand each month we are getting closer and I believe the stock market is in a stage 3 topping process.

5


INNER-Investor Monthly Conclusion:

The New York Stock Exchange, S&P 500, and Dow Jones forming a bearish rising wedge which they appear to have broken down from. This could be the start of a bear market but until the price action truly confirms this the major trend remains up. The last quarter of 2015 will likely provide great opportunities for the active trader. BECOME AN ALGOTRADES USER TODAY – CLICK HERE


OTHER TRADING EDUCATIONAL MATERIALS


algocourse“IF YOU’VE GOT 3 HOURS, WE’LL SHOW YOU HOW TO EASILY TURN YOUR TRADING AROUND AND IMPROVE YOUR BOTTOM LINE BY AT LEAST $1,000 EVERY MONTH”

…No B.S., No Kidding or Exaggeration. WE GUARANTEE IT!

Steaming Video Course: Click Here


book1If you are not part of the AlgoTrades program join today!

Not yet read my book? I highly recommend you do this as it walks you through the key indicators/analysis used so you understand how the AlgoTrades system can make you money on auto-pilot.

Digital Book Download: Click Here


book2A Sudden Collapse In Equities Is On The Way!

It is more critical than ever in our history to hedge against an economic collapse, especially this year.

Seven experts from around the world agree with this impending collapse and you will have a once-in-a-lifetime opportunity to profit from chaos.

Digital Book Download: Click Here

I am issuing a “Red Flag Warning” To Financial Markets for the next six months of 2015.  I have come to this conclusion that the next and most devastating financial collapse lies right in front of us. This information comes from my confidential sources who have shared this with me, and is supported by my 15+ years of trading and investment analysis experience, as well as the implementation of our financial forecasting models.

The SPX market internals/market breadth have started to correct itself and therefore the “rolling-over process” is now in progress.  This is primarily due to the 7-year cycle.  It has been slow, but steady.  So far, the result has been to pressure prices into a short-term downtrend.  This correction of the 7 year cycle will be significant!  If we look at the first three trading days of 2015, the SPX was down 2.75%.  The only other time in history that this occurred was when the SPX declined by more than 3% in the years 2000 and 2008.

Financial Markets do move in predictable waves, cycles and patterns.  Economic cycles have enabled experienced analysts, as well as myself, to correctly forecast the timing of stock market peaks and stock market crashes/corrections over a very long period of time. These cycles are currently indicating that the U.S Financial Markets and the US Economy are about to enter a major downturn. These are repeating patterns that do occur in different fractals.

There are many cycles that I have studied over the last 15+ years.  The 7 year cycle is most dominant and repetitive for our analysis and current application. We can look back at the most recent financial crisis which occurred in 2008 in which the stock market crashed, Lehman Brothers collapsed, and we were plunged into the worst recession that we had experienced since the Great Depression.   Prior to that, the last time that the stock market experienced a major decline was during the bursting of the dot com bubble, seven years earlier.  2001 was a year of recession for the U.S. economy and of major problems for stocks. That was the year in which “9-11″ tragically occurred.  Seven years earlier, in 1994, investors experienced the worst bond market of their lifetimes. Another seven years earlier brings us to 1987 in which most of us remember as “Black Monday”.  These repeating patterns are well documented in history.  The same price patterns appear, at any given time, from monthly, daily, hourly, even down to one minute charts. This is the reason why markets are “fractals”.

chart1

This current seven year cycle also aligns with the seven year “Shemitah cycle” that can be found in the Bible.  The Sabbath year (shemita Hebrew: שמיטה‎, literally “release”) also called the sabbatical year or sheviit (Hebrew: שביעית‎, literally “seventh”) is the seventh year of the seven-year agricultural cycle mandated by the Torah for the Land of Israel and is still observed within contemporary Judaism. All of the great economic crashes in the U.S, including the Great Depression, have been in alignment with Shemitah years.

chart2

I first discovered a long term cycle when I came across “The Kondratieff Wave” while in my early years of studying finance and economics. It was developed by a Russian economist named Nikolai Kondratiev.  Nikolai Kondratieff (Kondratiev), a Russian economist was the first to suggest that industrial economies followed a cycle of change

within business cycles which included “inflation”, the “expansion of the economy” and “deflation”, which is the contraction of the economy within a “business cycle”.

During these periods of decline that occur, in the long waves, a large number of important discoveries and inventions in the technique of production and communication have been made.   These are applied on a large scale at the beginning of the next long upswing.

The originally estimated cycle length lasts 50 to 54 years.  These are shifts over time between economic growth “expansions” and periods of economic declines of “contractions”.

This is my interpretation of the time frame.

I have defined 6 long economic waves (cycles) and each of them was initiated by a specific technological revolution:

  1. (1600-1780) The wave of the Financial-agricultural revolution
  2. (1780-1880) The wave of the Industrial revolution
  3. (1880-1940) The wave of the Technical revolution
  4. (1940-1985) The wave of the Scientific-technical revolution
  5. (1985-2015) The wave of the Information and telecommunications revolution
  6. (2015-2035?)The hypothetical wave of the post-informational technological revolution

The only thing predictable about todays’ global economy is the “K Long-Wave” economic cycle.  This is the reason more and more analysts are embracing the “K Long-Wave Principle” as an unrivaled economic indicator, and the source for accurate economic forecasts.

Our clients will profit substantially from the use of this proven advantage of the “K Long-Wave Principle”   This wave is characterized by four seasons:  Winter, spring, summer and autumn. We are currently in the Economic Winter.  We are in a global depression and experiencing an economic collapse during this period of time which is identical to the “roaring twenties”, but now it is similar to 1929. The last “Great Depression” lasted fifteen years and a World War to get out of that economic downturn.

My technical trader which is also a Capitol Hill insider went into development and research for a 5 year period of time 30 years ago. What was created was a financial forecasting model, which he implemented 25 years ago.  It is a Predictive Model in its nature.  It forecasts nearly every major market turn, within the U.S Financial Market. This gives you (my) private clients the EDGE which does not exist anywhere else.  It signaled that we exit all U.S Market positions on November 25th, 2014 for putting new investment money to work in US Equities.

Since that period of time, in history, the markets have just been “channeling” and going into a neutral position and we have been sitting in a “cash position” for these respective markets, which was the optimal position to be in.   When it has confirmed that the “TOP”, is in place, we will implement the proper position in which we will substantially obtain huge gains.  Until this time arrives, I ask that you follow our weekend updates.

Both, the 7 year cycle and “The Kondratieff Wave” are occurring at the same time.  This is a major occurrence that will take place very shortly.

Derivatives are going to play a major role in this next upcoming major financial crisis.  When you start hearing that word, on the news, then you will realize that things have started to really unravel. “Too big to fail” banks in the U.S have over 250 trillion dollars of total exposure to derivatives while only having 9.8 trillion dollars in total assets.

Derivatives are one of the three main categories of financial instruments.  The other two are stocks (equities or shares) and debt (bonds and mortgages).

When, not “if”, the derivatives market crashes, all U.S citizens will be responsible for bailing out the major derivatives clearing houses.  According to The Dodd-Frank Act: Section 2, U.S. taxpayers will bare the brunt. This gives the Federal Reserve the power to provide “discount and borrowing privileges” to derivatives clearing houses in the event of a major derivatives crisis.

Derivatives almost caused the complete collapse of the insurance giant AIG back in 2008. This financial crisis is inevitable because the causes of the previous one have not been solved. The derivative markets are not regulated, and they continue to grow unchecked.  The truth of this matter, is that there are no financial resources left. It is now out of control, and we just allowed it to get bigger and bigger and bigger.  The Federal Reserve, the US Congress and President Obama have created this situation, in which, there is not enough money in the world to cover these debts.

Find out how to profit from the coming events here: http://www.thetechnicaltraders.com/GFWSS/

Chris Vermeulen

The Time Has come again to own a few very special situation resource stocks that I believe will sky rocket in value over the next few months.

I have not owned any junior exploration companies since 2011 when the top was formed in the sector, and in fact I shorted miners early this year for some decent gains.

But I believe now is time to add a few small positions to my portfolio which should provide big rewards during a time when the overall equities market and financial system are about to struggle.

From being involved in the precious metal market since 2001 I have seen numerous exploration companies succeed and even more fail. But what is important to understand is that each of these winning companies had the same core things working for them.

Characteristics among Successful Exploration Companies:

  1. Properties located in a proven resource rich zone
  2. Properties explored and have proven value in the ground
  3. Low-cost operation and logistics for transportation ore and supplies
  4. Management team which proven track record of success
  5. Market timing – completes exploration for being acquired or starts producing just before a resource bull market.

These core characteristics are what allow companies to emerge as buyout targets and get acquired or become low cost producers. Both of these outcomes can generate a substantial increase in share value.

While junior producers can generate more share value growth than that of a company being acquired, they typically take more time to mature and become known.

But, junior exploration companies who have fully explored their properties and know the value being stored in the ground through the use of drilling and a PEA, provide a much different type of potential reward to its shareholders.

When these tiny, unknown hidden gems are acquired, investors tend to see the share price gap higher to the purchaser’s value and stay there, to generate gains of 6x or more return on investment in many cases.

Recently I shared my junior oil exploration stock I own with my followers. It is becoming a producer as we speak and the next couple weeks are going to be exciting. Its share price has surged from 6 cents to 24 cents and the crazy part is no one knows about it yet.

Also a few weeks ago I shared two junior gold and silver exploration companies which will become producers. One should start producing within a couple weeks, another is still a few months out, but when they do I expect share value to rise substantially.

In a couple days I will share with you another stock I personally own. This is a silver stock and provides a different type of investment opportunity than normal. This type of play should be in your portfolio for the coming resource bull market I expect to start later this year.

Get My Hidden Gem Stock Picks Free: www.GoldTradingNewsletter.com

Chris Vermeulen