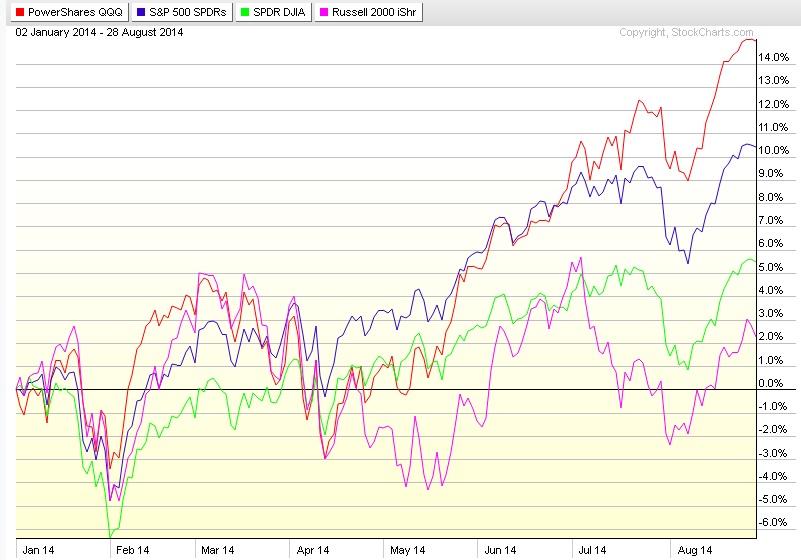
In July I showed talked about the Russell 2K index and how it was underperforming the broad market. I went on to explain what it likely meant was in store for the US stock market this fall. The outlook was negative, just in case you were wondering…

This week I want to talk about two different sectors that have often lead the broad market in rallies and corrections over the years. These sectors have underperformed the broad market much like that of small cap stocks, and this does not bode well for investors going into fall.

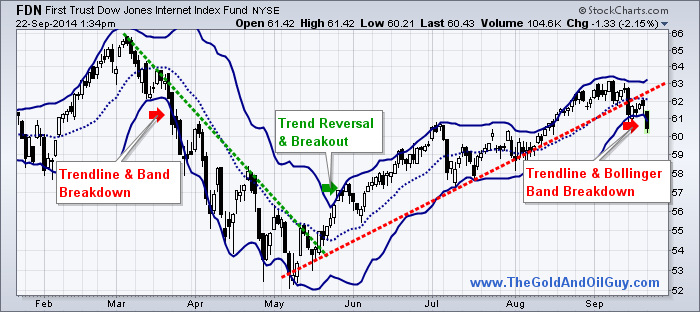
In the analysis below I use Bollinger bands and trendlines. Using only these tools keeps the charts clean and easy to understand. In short, once a trenline has been broken that is the first early warning that a trend may be coming to an end. The second is the break of a Bollinger band.

A combination of these can be taken as a trend reversal and likely the start of a multi week or month correction. This will depend on the chart time frame you are reviewing though. I use a similar method to identify trends with my automated futures trading system.


INTERNET INDEX FUND ANALYSIS

fdn-chart


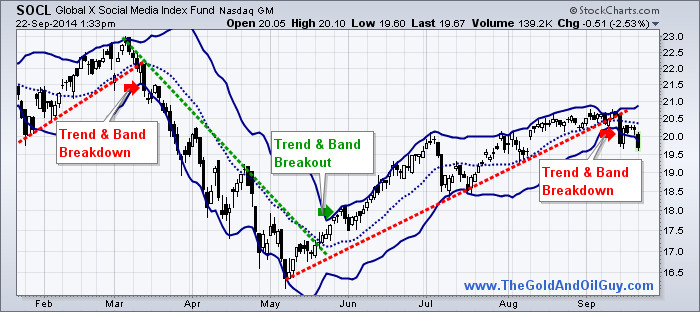
SOCIAL MEDIA INDEX FUND ANALYSIS

Futures Trading System

If you are wondering what exactly these two charts are pointing to… let me share my outlook.

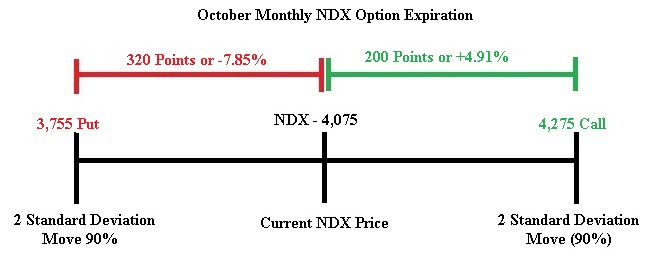
Because we have seen the support trend lines broken to the downside this month, and the fact that price has pushed more than 2 standard deviations from its norm, the odds favor more downside is to come.

From years of experience trading price patterns and breakouts I know that when price breaks to the downs side and triggers fear among its investors it is typically your best time to sell short so you can profit from the falling prices. Fear is the most powerful force in the stock market and it must be traded much differently than when prices are rising.

Although I feel the broad market is still within its uptrend, these two underperforming sectors may just continue to sell lower. Obviously once the broad market rolls over, these sectors should fall even faster to the downside but until then, they could chop around and grind their way down.

Like My Simple Analysis & Tips? Join My Free Newsletter at www.GoldAndOilGuy.com

Want My Trades Automatically Trade for You? www.AlgoTrades.net

Chris Vermeulen

I will be honest, it has been a long time since I have been excited about gold, but I am starting to like gold once again. I had grown too bored to care what gold did. With the bull market top in 2011, and four years later price continues to founder can you blame me?

Let me start out by painting a picture for you. This is my technical analysis overlaid on the price of gold. This simply gives you a visual of were the price of gold is trading.

But first, if you have not yet seen this “Gold in the USA” infographic you must check it out… it shows the history of gold in a visual format, and you will likely learn something from it – Click Here

GOLD HOLDS LONG-TERM BEARISH PATTERN

Gold peaked around 1900 in September 2011 and quickly fell to the 1550 area. The metal then consolidated for 18 months before it broke support. The sharp decline triggered a drop in price to $1200 in April 2013. Since then gold has been in another consolidation, which is a bearish continuation pattern.

The lower highs in 2013 and 2014 reflect weakening demand and increasing selling pressure at lower price levels. A break down in price below support would trigger further weakness and a drop to roughly $900 oz. If you want more of a bearish visual; see my August gold report – Click Here

gold technicals forecast

GOLD’S BULLISH OUTLOOK SIGNS OF A BOTTOM

SIGN #1: Gold is technically still in a down trend but it may be quietly forming a bottom. This is how bull markets often start. First it declines in value to a point which breaks the most steadfast bulls. And it does this by relentlessly losing value for an extended period of time. If the market doesn’t shake you out, it will wear you out!

Gold is no longer talked about by the majority of participants, nor is it talked about every day in the media. Simply put, everyone is bored of the low price and sideways trading the past couple of years.

SIGN #2: The key to front running the next rally in gold is to watch the price of gold stocks. They typically lead gold. So when gold stocks start outperforming the price of gold along with the HUI gold stock index we can expect the price of gold to follow a few days or weeks later.

Gold stocks as a whole have not yet started to outperform gold. But if we look at the HUI/Gold ratio it is at extreme levels. This is the same level we saw in 2001 before gold and gold stocks rocketed higher for several years. The ratio is not something you should trade off of, but it’s a good confirmation indicator that gold stocks are priced fairly.

SIGN #3: Looking at what the price of gold has done over the past 40 years 12 months before interest rates have been increased is very interesting and not something many traders know.

With interest rates expected to rise in 2015 this is a statistic that should be reviewed. Numbers do not lie and historical charts show the price of gold rising an average of 20% within the year before interest rates rise. And in case you happen to miss the first 6 months of the move, do not worry. Most of the rally takes place just 6 months before rates go up.

SIGN #4: September is the strongest month for gold each year when looking at the 32 year seasonal chart. The odds favor higher prices this month. Likely not enough to spark a new bull market, but may build a base in the price.

gold seasonal

GOLD FORECAST AND CONCLUSION:

One day these weeks gold will breakout down from this consolidation pattern or breakout and rally from this basing pattern. Which way is the question we are all wondering.

Anyone who clearly states gold has bottomed and to buy is taking a stab at being a hero and to say what the masses want to hear. Sure, it sounds great, but it’s BS.

From a price and technical standpoint gold remains bearish or neutral at best. Until price clearly breaks out from this range you should trade with caution and small position sizes.

However, when/if gold starts to rally it is likely best to jump on the train rather than wait for a pause or pullback in price after the breakout. It may just keep on rising until $1550 is reached.

Watch My Daily Gold Video Analysis at www.TheGoldAndOilGuy.com

Automated Investing System for the Average Trader: www.AlgoTrades.net

Chris Vermeulen

By now it is no secret that equity markets continue to deliver solid gains for 2014. In fact, all of the major U.S. domestic stock market indexes are higher for the year. U.S. equities have benefited from an accommodating Federal Reserve, massive corporate stock buy-back plans, and solid earnings growth. The bullish trend which began in early 2009 has pushed equity indexes to several all-time highs.

However, when we focus our attention on 2014 one index is showing major relative out performance. The Nasdaq Composite and the Nasdaq 100 indexes have blown away every other major index in terms of overall returns in 2014. The chart shown below illustrates the returns of each major U.S. equity index year-to-date.

Chart1

As can be seen above, when looking at the corresponding ETF for each major index, the Nasdaq 100 (QQQ) is running away from every other major index in terms of performance. As a contrarian trader, I am of the opinion that now may be an excellent time to consider looking for a possible short position to hedge against the bullish trend.

The equity markets in the United States are becoming frothy and prices are at the very least fair valued if not overvalued depending on which methods are used to calculate current prices. When we consider the major out performance in the Nasdaq 100 Index, it would only make sense that if we see downside in the future we could capture some big potential profits.

As an option trader who focuses primarily on probabilities for trade executions using a variety of implied volatility calculations and Delta assumptions, the following observations regarding the Nasdaq 100 Cash Index (NDX) were derived based on data points on Friday, August 29th.

Based on the September NDX option expiration date, the current skew in the NDX option data is to the downside. In fact, as I am typing this NDX is trading around 4,075. A 2 standard deviation move to the upside (90%) is around the 4,200 call strike and the same measurement to the downside is around the 3,900 put strike.

Chart2

When looking at the same data based on the October NDX option expiration date, the current skew in the NDX option data demonstrates more aggressive downside Skew in October versus September. A 2    standard deviation move in the October series to the upside (90%) is around the 4,275 call strike and the same measurement to the downside is around the 3,755 put strike.

Chart3

While I realize this is somewhat technical, the main premise is that the option market in the Nasdaq 100 Cash Index (NDX) is skewed toward more potential downside risk. This data lead me to place a new trade earlier this week which was next short the Nasdaq 100 Cash Index (NDX) using an October Call Credit Spread as a trade structure.

Recent results for the service have been very strong for the options alert service. The last 4 trades have produced a 13.95% winner in Matador Resources (MTDR), a 17.05% winner in the S&P 500 Cash Index (SPX), a small 1% loss in the Nasdaq 100 (QQQ), and a 21.95% in the Russell 2000 Cash Index  (RUT). The options newsletter service is priced super affordable at just $29.99 per month with new trade alerts sent out almost daily.

Ultimately time will tell if the skew in the NDX proves to work. For now, I like the near 75% probability of success that the NDX Call Credit Spread is offering with a nearly 20% potential return. In the future readers can expect a recap of this trade. Happy Trading!

Chris Vermeulen
www.thetechnicaltraders.com/options/