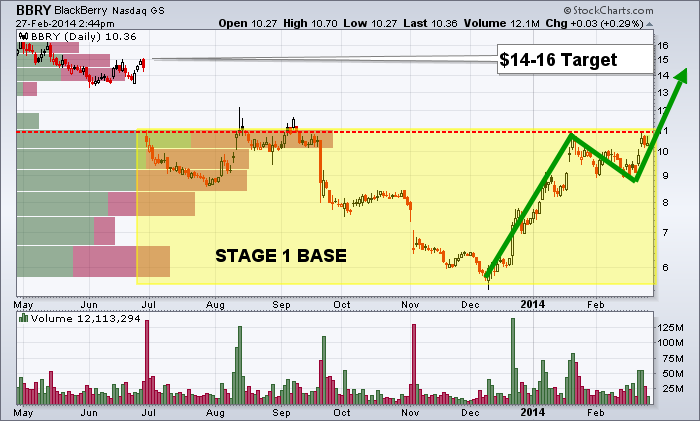
I point out the BBRY (black berry chart). The last time it made this pattern (Stage 1 Base) we saw a quick 54% jump in price. This stock has bucked the broad market trends many times in the past. Meaning, if the SP500 rallied it would trade sideways or low, and during market sell offs we have seen it rally. While it is volatile I like it because its correlation to the broad market is low. I did buy a small 2% ($2000) position in it yesterday as a little momentum trade.
https://thegoldandoilguy.com/wp-content/uploads/2014/02/bbry.png421700adminhttp://www.thegoldandoilguy.com/wp-content/uploads/2014/11/tgaoglogo.pngadmin2014-02-27 19:51:012014-03-03 13:47:57BBRY Chart Of The Week
As you likely know I have been working on automating my long term SP500 investing strategy which I call AlgoTrades. I would like to mention that we are taking on new clients to our AlgoTrades automated investing system.
We are very excited to tell you that the doors are currently open for you to become a part of this new way of investing.
To ensure peak performance from our automated trading system and trading results for our clients. We have a limited number of seats available to ensure this. As with any good system, once there are too many clients the profitable edge in the market will no longer exist. As we are trading the system with our own investment capital, we are going to monitor and protect our system.
This system is very exclusive as it can only handle a limited group of clients. Be sure to join today, before we are over subscribed. Reserve your seat to have our system trading a portion of your investment capital.
https://thegoldandoilguy.com/wp-content/uploads/2014/02/images3.jpg5359adminhttp://www.thegoldandoilguy.com/wp-content/uploads/2014/11/tgaoglogo.pngadmin2014-02-27 09:40:042014-03-04 03:18:48AlgoTrades system is now available for automated investing
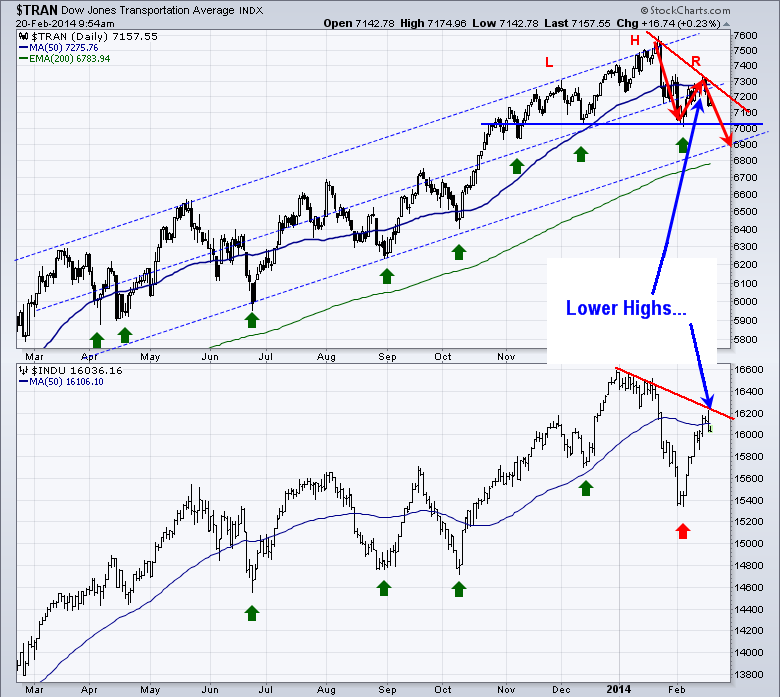
The Dow Theory could be in play here with the broad market. When both the Transports (IYT) and the Dow Industrials (DIA) cannot make higher highs and start making lower lows the market has topped according to Dow Theory. We are watching the transports closely because the Dow chart has already made a lower low and now e are waiting for the Transports to do the same. They have both made lower highs if this current rally stalls here. This will be important in the next few weeks to help calculate the markets next major move and if there will be a trend change.
https://thegoldandoilguy.com/wp-content/uploads/2014/02/trans2.png697780adminhttp://www.thegoldandoilguy.com/wp-content/uploads/2014/11/tgaoglogo.pngadmin2014-02-26 13:58:102014-03-03 13:30:26The Dow & Transport ETF Play – The Dow Theory
I have had a few emails asking about our silver position and why we are not moving our protective stops and taking more profits similar to how we are trading Natural Gas.
These are great questions and here are my thoughts:
Depending on your outlook and trading/investing type you will either be looking at silver as a quick trade to lock in gains, or as a early entry point into silver as precious metals start to form a basing pattern. What you do is up to you as I cannot give individual investment advice.
We/I did take some profits off the table and move our stop up last week for a portion of this position (1/3rd) and we moved our stops to breakeven. As shown in this morning video gold, silver and miners still have a LOT of work to do to build this basing pattern and it may take a few months yet. If you did not watch today’s video then do so for a visual.
I am more of a short term trader which is why I sold 1/3rd of our position last week. My brain/emotions demand I lock in profits when the market gives us a quick move in our favor. That being said, I really like the precious metals sector and feel we are getting in early and at a great price. If this basing pattern holds up and price continues to rally in our favor this year, it means we will be deep in the money on this position and can add a lot more money upon the next setup in gold, silver or miners with less risk because of our profit cushion on this first silver trade.
So I am holding the balance of my silver position with a breakeven stop looking for the longer term trend to pick up speed in the coming months.
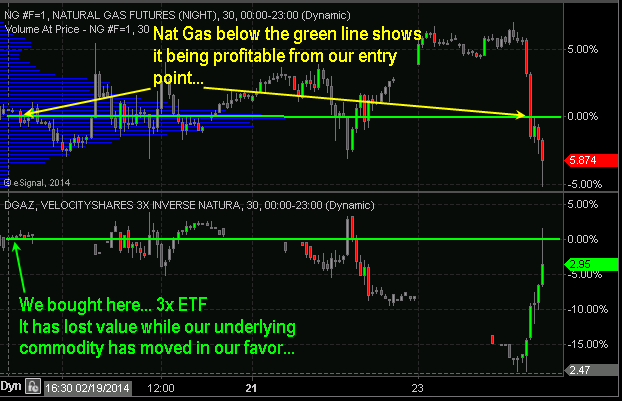
Here is a perfect example showing how 3x leveraged ETF funds can lose value over a short period of time while the underlying investment is deep in our favor by 5% and should have our ETF in our favor by 15%). But instead we are under water by a few percent still…
This is a prime example of why I don’t trade 3x ETFs that often. And when you actually run the numbers on how much leverage you actually get with 3x ETFs its actually the same or less than if you just bought a single ETF with the same amount of capital and margin… 3X ETFs require you to have 90% margin, while a single ETF only requires you 30%. It’s a little complicated to crunch the numbers and explain but know that 3x ETFs are nothing special when you do the math for both long term and short term trades.
For example, if you wanted to buy $1000 worth of a 3x ETF, the margin requirements on these fund are 90% meaning you must have $900 in your MARGIN account to trade this position. But if you wanted to trade say a single ETF where the margin is only say 30% for a non levegeage fund, you can technically trade the same position size with the same amount of money WITHOUT the 3x leveraged fund price decay we all know is terrible in these highly leveraged funds.
So if you wanted a position to match the power of the $1000 3x leveraged ETF position but using the single ETF, you would only need to buy $3000 worth of the single ETF, but because its only 30% margin requirement. This may be confusing, the only point im trying to make here is that you can get almost the same trade using a single ETF simply because of the margin requirements between the two types of ETF funds. Most individuals do not realize the crazy margin required for 3x ETFs and its likely the reason most traders get margin calls with trading these funds.
Long story short, if today’s price action is a reversal day it will only take another big down day for us to be deep in the money on our inverse ETFs.
The Next Trading Session Is another Big Sell Off in our Favor – Current Live Trade
This is a continuation of yesterday’s post talking about how we needed another big down day for the ETF catch up to the natural gas price action.
Today Nat Gas is down another 10% and has sent our 3x leveraged ETF fund deep in the money with subscribers traded up over 18% in only a couple trading sessions.
We continue to hold our remaining 1/3rd of our position in DGAZ with a stop 5% in the money in case price reverses hard today or this week.
https://thegoldandoilguy.com/wp-content/uploads/2014/02/ng-Gain.png400596adminhttp://www.thegoldandoilguy.com/wp-content/uploads/2014/11/tgaoglogo.pngadmin2014-02-25 09:50:132014-03-03 13:33:59Price Erosion of 3x Leveraged Natural Gas ETFs
Both the Canadian and US stock markets are closed today. Futures trading have shortened mixed hours also. Being a holiday and limited trading there is no video this morning.
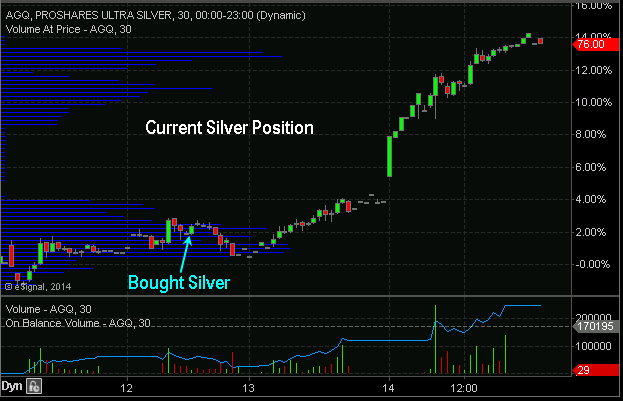
Taking a look at the futures market we can see trading up another 1.35% today which is great to see. So far out silver position is up over 12% in just a few trading sessions.
Natural gas is no fire once again… up nearly 5% again today and is now testing the recent spike highs in price in which we shorted earlier this month for a net 20+% profit in only a few days. Nat gas actually looks ready to rally even more this time so I am not looking to short it unless we get a picture perfect setup again.
The SP500 (broad market) continues to claw it’s way higher and its trading up 0.25% this morning. We are going to leave the stock market alone until we get a correction in price, then we will review the charts for a possible trade setup.
On different note, today we are excited to announce the opening of doors to our automated trading system for investors. Many of you are already on the waiting list as we have a limited amount of client seats available to have the system traded automatically in your brokerage account and it is first come first serve. Keep in mind today is a holiday with brokers and services are running on a skeleton crew. If you have not taken a look at our automated trading system you can review all the details here: www.AlgoTrades.net
Chris Vermeulen
https://thegoldandoilguy.com/wp-content/uploads/2014/02/silverposition.png401623adminhttp://www.thegoldandoilguy.com/wp-content/uploads/2014/11/tgaoglogo.pngadmin2014-02-17 08:56:372014-03-03 13:34:41Silver Trade & Automated Trading System for Investors
The SP500 continued to rally and is pushing extreme overbought conditions today. Our net short ETF trading strategy on the SP500 is close to getting stopped out as the trend is on the verge of turning back up if sellers do not step in tomorrow. We are under water on this trade and unfortunately we lose when trends reverse as that is just part of trading. The trend remains down and we could get a miracle tomorrow to save the day. only time will tell.
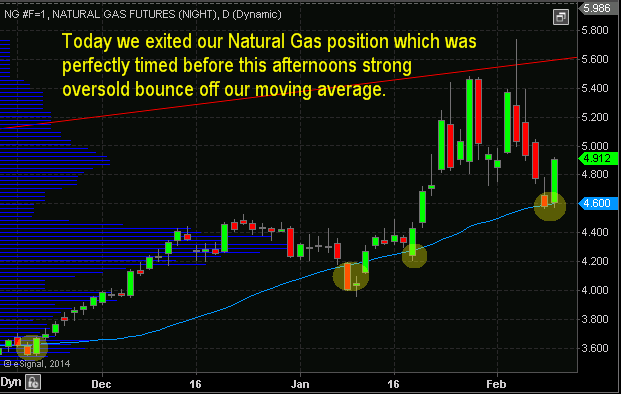
Natural Gas ETF Trading Strategies: This morning we closed out our natural gas trade for a big profit of roughly 18-20% depending where you entered and placed your stop. I have had a several emails from members wanting to add to their position yesterday, and another bunch today saying they still hold their position in natural gas cause they think price will continue to move in their favor. Technically, closing out our trade today was the proper thing to do. We followed our rules and the trade managed it’s self perfectly. While natural gas could continue to sell down in the long run, wanting to hold your position or add to a trade that is up 40% without any real pullbacks is the sign of a GREEDY trader. General rule is, if you do not take profits on a trade, the market will simply take them back, its that simple.
ETF Trading Strategy for DGAZ Pays out 20% return!
It looks as though precious metal miners and gold are having an impulse wave higher and have turned up. Silver remains in a down trend/basing pattern. I plan to get long this sector on the first pause or pullback. Though we could get long Silver tomorrow using one of our precious metals etf trading strategies.
Chris Vermeulen
https://thegoldandoilguy.com/wp-content/uploads/2014/02/natgasbounce.png394621adminhttp://www.thegoldandoilguy.com/wp-content/uploads/2014/11/tgaoglogo.pngadmin2014-02-11 16:39:322014-03-03 13:35:18ETF Trading Strategies for Gold, Silver, Miners and Natural Gas
Recent price action in the stock market has many traders on edge. With the market closing below our key support trend line last week, the market has now technically starting a down trend.
While trend lines are a great tool for identifying a weakening trend and reversals in the market, I do not put a lot of my analysis weighting on them.
Most of my timing and trading is based around what I call INNER-Market Analysis (Market Stages, Cycles, Momentum and Sentiment). Using these data we can diagnose the overall health of the market. Knowing the strength of the market we can then forecast short term trend reversals before they happen with a high degree of accuracy.
In this report I keep things clean and simple using just trend lines. During the last three weeks we have seen the price of stocks pullback. And because 2013 was such a strong year for stocks most participants are expecting a sharp market correction to take place anytime now.
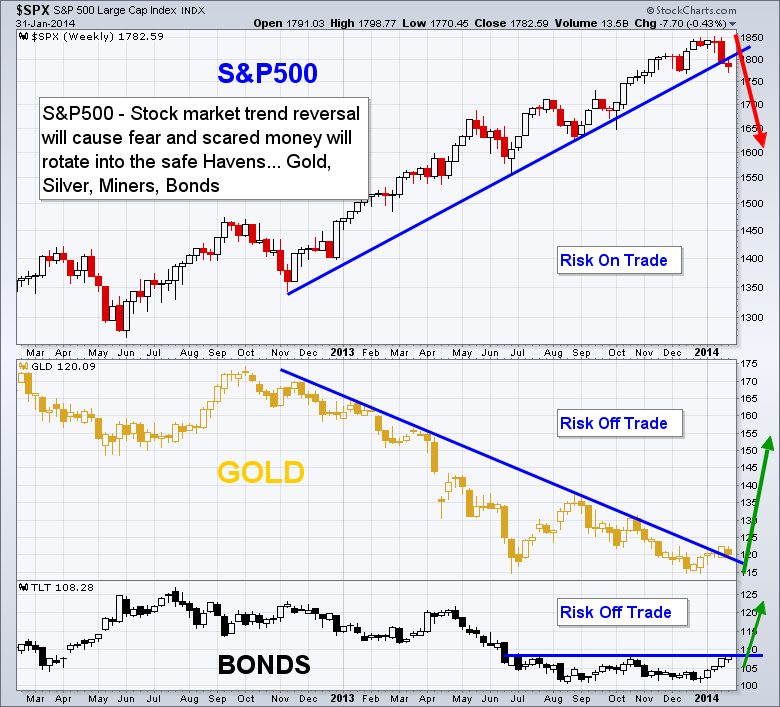
So with the recent price correction fear is starting to enter the market and money is rotating out of stocks and into the Risk-Off assets like gold and bonds.
Stocks tend to fall in times of economic uncertainty or fear. These same factors push investors towards the safety trades (Risk-Off) high quality bonds and precious metals. As more money goes from risk-on to risk-off, stocks will continue to fall and the safety trades will rise. The move by investors to select the safety of gold and bonds compared to the volatility of stocks will result in these risk plays to moving in opposite directions.
Let’s take a look at the chart below for a visual of what looks to be unfolding…
How to Trade These Markets:
While these markets look to be starting to reverse trends, it is critical that we understand how the market moves during reversals and understand position/money management.
Getting short stocks and long precious metals in the long run could work out very well, but if you understand the price action that typically happens during reversals you know that the stock market will become choppy and we could see the recent highs tested or possibly even a new high made before price actually starts a down trend. And the opposite situation for gold and bonds. Drawdowns can be huge when investing and why I don’t just change position directions when the first sign of a trend change shows up on the chart.
Price reversals are a process, not an event. So it is important to follow along using a short term time frame like the daily chart and play the intermediate trends that last 4-12 weeks in length. By doing this, you are trading in the direction of the most active cycle in the stock market and positioned properly as new a trend starts.
What I am looking for in the next week or two:
1. Stocks to trade sideways or drift higher for 3-6 days, then I will be looking to get short. Again, cycle, sentiment, and momentum analysis must remain down for me to short the market. If they turn back up I will remain in cash until a setup for another short or long entry forms.
2. Gold remains in a down trend but is starting to breakout to the upside. I do have concerns with the daily chart patterns for both gold and silver, so next week will be critical for them. We will be using some ETF Trading Strategies to take advantage of these moves.
3. Bond prices (not yields) look to be forming a bottom “W” pattern. They have had a big run in the last few weeks and are now testing resistance. I think a long bond position is slowly starting to unfold but if we look at the futures price charts for both bonds and gold, they have not yet broken to the upside and have more work to do. As mentioned before ETFs are not really the best tool for charting but I show them because they what the masses follow and trade.
https://thegoldandoilguy.com/wp-content/uploads/2014/01/Gold-Stocks.png530700adminhttp://www.thegoldandoilguy.com/wp-content/uploads/2014/11/tgaoglogo.pngadmin2014-02-02 12:24:142014-03-03 13:37:43Is February a Risk-On or Risk-Off Trade: Equities or Gold & Bonds